Data and Model Driven Hybrid Approach to
Activity Scoring of Cyclic Pathways
Zerrin I¸s k1, Volkan Atalay1, Cevdet Aykanat2, and Reng¨ul C¸ etin-Atalay31 Department of Computer Engineering, Middle East Technical University 2
Department of Computer Engineering, Bilkent University
3 Department of Molecular Biology and Genetics, Bilkent University, Ankara,
TURKEY
Abstract. Analysis of large scale -omics data based on a single tool re-mains inefficient to reveal molecular basis of cellular events. Therefore, data integration from multiple heterogeneous sources is highly desirable and required. In this study, we developed a data- and model-driven hy-brid approach to evaluate biological activity of cellular processes. Bio-logical pathway models were taken as graphs and gene scores were trans-ferred through neighbouring nodes of these graphs. An activity score describes the behaviour of a specific biological process was computed by flowing of converged gene scores until reaching a target process. Biolog-ical pathway model based approach that we describe in this study is a novel approach in which converged scores are calculated for the cellular processes of a cyclic pathway. The convergence of the activity scores for cyclic graphs were demonstrated on the KEGG pathways.
1
Introduction
behaviour of several genes under particular conditions. A microarray data anal-ysis method initially generates lists of significant genes hopefully related with the particular condition of the experiment. Researchers focus on integrating bi-ological pathways and gene lists to associate genes to a specific cellular process. Biological pathways represent several experimental interactions in the form of graphs. The vertices and edges of these graphs represent genes/molecules and relations between genes/molecules, respectively. Several tools have been devel-oped to visualize microarray data by considering existing biological pathways [1–3]. Generally, these pathway analysis tools identify significant genes or path-ways based on traditional statistical tests. However, the analysis capacity of such tools depends on the initially identified differentially expressed gene set. More-over, existing tools do not integrate individual gene information with pathway models to provide more biologically significant results.
In our previous study, we integrated transcriptome data to evaluate acyclic signaling cascades under the control of specific biological process [4]. In this study, we describe a hybrid approach integrating large scale data (microarray
© Springer Science+Business Media B.V. 2010
Microarray experiments produce transcriptome data which reflects the biological
in Electrical Engineering 62, DOI 10.1007/978-90-481-9794-1_18,
91 E. Gelenbe et al. (eds.), Computer and Information Sciences, Lecture Notes
gene expression and ChIP-seq) to quantitatively assess paths in a cyclic path-way under the control of a biological process. We use the integrated data as the attribute of a node and we transfer this attribute to en route of the cyclic pathway as scores which explain the current activity of analyzed pathway. Our main contribution in this study is to assess biological activity of cyclic pathways by developing a linear-time graph cascading algorithm combined with a rank product gene scoring method.
2
Material and Methods
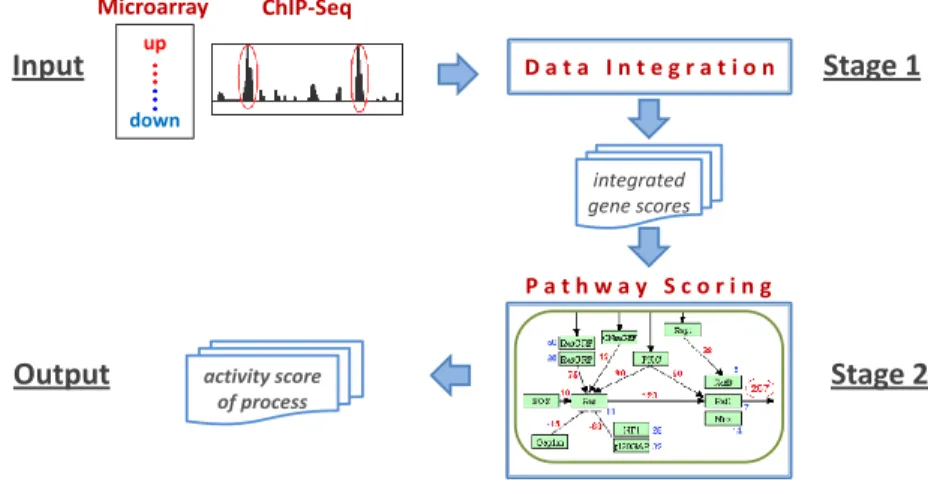
The proposed approach is made up of two main stages: data integration and path-way scoring (Figure 1).In the data integration stage, we perform the integration of large scale heterogeneous transcriptome data. For this purpose, ChIP-seq and microarray gene expression data both performed on HeLa cells under control and oxidative stress conditions were selected from public databases [5, 6]. Af-ter performing raw data analysis, we assign a rank measure for the genes both from ChIP-seq and microarray data. For this purpose, we ordered these genes by sorting their read counts and fold-change measurements in the ascending order. These individual ranking scores of genes were integrated by taking their rank products [7]. These scores are used as integrated gene scores in the rest of the analysis. Z. Isik et al. ChIP-Seq up down Microarray P a t h w a y S c o r i n g
Input
Stage 2
Stage 1
Output
D a t a I n t e g r a t i o n integrated gene scores activity score of processFig. 1. Process diagram of the developed system.
In the pathway scoring stage, several signaling cascades from KEGG PATH-WAY database are used as the models of our method. An activity score for a biological process in a pathway is computed by using flow mechanism of in-tegrated gene scores. For this purpose, a KEGG pathway is converted into a directed graph G = (V, E ) by using KGML files. A node in the graph repre-sents gene product, or target process linking current signal to another path-way. The edges represent the relations (i.e., activation or inhibition) between the nodes. In G, let outAdj(x) denote the out-adjacency list of node x, that is
outAdj(x) = {y : (x, y) ∈ E } and similarly inAdj(x) denotes the in-adjacency list of node x. The directed graph G is converted into a cascade form by applying Breadth-First Search (BFS)-like algorithm which effectively propagates visiting levels starting from nodes of zero indegree. Let V0, V1, V2, . . . , VL−1 denote the node levels of this cascade form of G, where V0denotes the set of nodes with zero indegree. This cascade form enables us to solve the score convergence problems of some cyclic graphs. Algorithm 1 describes the biological activity score compu-tation for each pathway. The for-loop in initialization part computes the sum of the self-scores of the nodes in out-adjacency of each node which is necessary in out-score computations. The score computation part works in iterative manner which updates the score of the nodes in a level-wise fashion. The statement in the third for-loop computes the out-score of node x by dividing among the nodes in outAdj(x) according to the self-scores of those nodes. Therefore, the nodes with small self-scores will get small share of outScore(x) compared to the nodes having large self-scores. The reason of the iterative approach is the existence of cyclic cascades in KEGG PATHWAY database, because the out-scores of the nodes in a cycle need to be computed many times. For this purpose, we execute the while loop until obtaining converged out-scores for all nodes in the graph. The error threshold for convergence criteria and set to 10−6. After convergence, the out-score (activity score) of each gene and process are returned as the output of the algorithm.
The BFS-like levelization algorithm run in linear-time (O(V + E )) in the size of the pathway graph G. The initialization for-loop also makes a single scan over all vertices and edges of G. The while-loop of Algorithm 1 processes each vertex once. Therefore, Algorithm 1 can be considered as a linear-time algorithm if constant number of iterations suffices for convergence.
Algorithm 1 : Computing Activity Score of Biological Pathway
Input:
Directed graph G stored in-adjacency and out-adjacency list format Score: indicates self-score of each node given by our method outScore: contains out-score of each node
sign : keeps edge types: activation (1) or inhibition (-1)
Levelization info V0, V1, V2, . . . , VL−1obtained by running BFS-like algorithm.
Initialization:
for each vertex x ∈ V do outScore(x) = Score(x) totOutSelf Score(x) = 0
for each vertex y ∈ outAdj(x) do
totOutSelf Score(x) = totOutSelf Score(x) + Score(y) Score Computation:
while not converged do
for each level ` = 0, 1, 2, . . . , L − 1 do for each vertex x ∈ V`do
for each vertex y ∈ outAdj(x) do
outScore(y) = outScore(y) + sign(x, y) ∗ Score(x) ∗totOutSelf Score(x)Score(y) return {outScore}
3
Results and Discussion
In our approach, identification of an activated process under experimental condi-tions is easily provided by mapping gene scores and flowing them over the path-ways. We applied our approach to several KEGG pathways: Pathways in cancer, Cell cycle, P53 signaling, Insulin signaling, Regulation of actin cytoskeleton, Jak-STAT, Apoptosis, TGF-β, and MAPK signaling pathways. These pathways have 3 - 7 target cellular processes and include several cycles. We compute score of the nodes in a cycle and transfer this score to the neighbouring nodes, then iterate over the entire graph until obtaining convergence of node scores. There-fore, the Algorithm 1 may run 10-50 times over entire the cyclic graph until the convergence.
The significant biological process are specific to biological function of a given pathway and this fact is more in correlation with the cellular machinery. The behaviour of Apoptosis target process is discriminative one, since it produced higher activity scores with oxidative stress data in most of the pathways. This results was an expected one, since the response of a cell to a condition either normal or stressed is expected to be differential; therefore as a result of our analysis some of the target processes are activated whereas others are down-regulated.
References
1. Dahlquist,K.D., Salomonis,N., Vranizan,K., Lawlor,S.C. and Conklin, B.R. (2002) GenMAPP, a new tool for viewing and analyzing microarray data on biological pathways. Nat. Genet., 31, 19–20
2. Mlecnik,B., Scheideler,M., Hackl,H., Hartler,J., Sanchez-Cabo,F. and Tra-janoski,Z. (2005) PathwayExplorer: web service for visualizing high-throughput expression data on biological pathways. Nucleic Acids Res., 33, W633–W637. 3. Goffard N. and Weiller G. (2007) PathExpress: a web-based tool to identify relevant
pathways in gene expression data. Nucleic Acids Res., 35, W176–W181.
4. Isik Z., Atalay V., and Cetin-Atalay R. (2010) Evaluation of Signaling Cascades Based on the Weights from Microarray and ChIP-seq Data. Journal of Machine Learning Research, Workshop and Conference Proceedings, 8, 44–54.
5. Kang J., Gemberling M., Nakamura M., Whitby F.G., Handa H., Fairbrother W.G., Tantin D. (2009) A general mechanism for transcription regulation by Oct1 and Oct4 in response to genotoxic and oxidative stress. Genes Dev., 23(2), 208–222. 6. Murray J.I., Whitfield M.L., Trinklein N.D., Myers R.M., Brown P.O., Botstein
D. (2004) Diverse and specific gene expression responses to stresses in cultured human cells. Mol Biol Cel, 15(5), 2361–2374.
7. Breitling R., Armengaud P., Amtmann A., Herzyk P. (2004) Rank products: a sim-ple, yet powerful, new method to detect differentially regulated genes in replicated microarray experiments. FEBS Letters, 573, 83-92.