Abstract— A very accurate equivalent circuit model for circular CMUT cell is recently proposed. As a consequence of this model, the operating characteristics of the cell is derived and presented as a biasing chart for CMUTs. We discuss these operating characteristics and show how the coupling coefficient can be derived from the model. We present an analysis of receiver performance of a CMUT cell. We also demonstrate how to design cells for fixed bias voltage but for different static depression.
I. INTRODUCTION
We presented a lumped element equivalent circuit for circular CMUT cells in [1]. We showed that this equivalent circuit models the CMUT cell at Finite Element Analysis (FEA) level accuracy. We also presented a chart for operating characteristics, which is derived from the static force equilibrium on the plate. We call this chart CMUT Biasing Chart (CBC).
CMUT has an inherent potential to be designed to have a pre-specified transduction properties. CBC describes the operational characteristics of CMUT and provides this option to the designer.
When an external static pressure is present, the static force equilibrium equation can be put into the normalized form given in (1),
(
)
(
P ge)
g b ge P r DCt
X
g
F
F
t
X
V
V
'
2
3
−
=
(1) with( )
( )
⎟⎟
⎠
⎞
⎜⎜
⎝
⎛
−
−
=
−u
u
u
u
u
g
1tanh
1
1
2
1
'
(2)where VDC is the bias voltage, Vr is the collapse (pull-in)
voltage in vacuum for a CMUT with full electrode, XP is the
displacement at the center of the plate, Fb is the external static
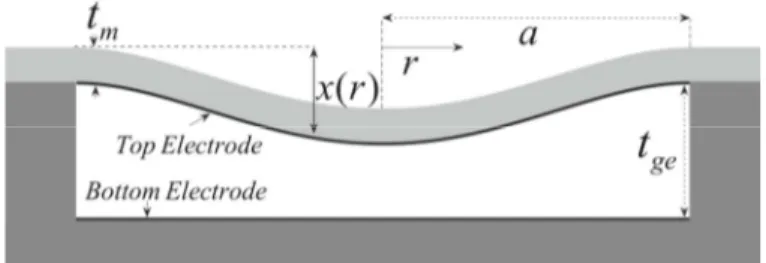
force, tge is the effective gap height, tg+ti/εr, given in Fig. 1,
and Fg is a uniformly distributed force required to depress the
plate such that XP = tge. Fg is not a physical force acting on
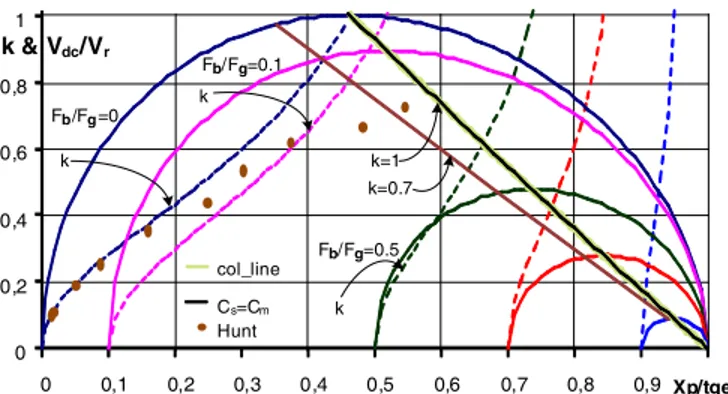
CMUT, but it is defined for normalization purposes only. CBC is a mapping of the variation of normalized bias voltage with respect to normalized center displacement, XP/tge, of the
plate while the mechanical equilibrium is maintained. All variables, the applied voltage, the active force and the displacement, are normalized to appropriate intrinsic values in CBC and therefore it is a general operating characteristic curve for CMUTs with circular membranes. CBC is plotted in Fig. 2 for different values of normalized static force, Fb/Fg.
For example, if we consider a CMUT in vacuum (Fb/Fg = 0),
XP/tge increases from zero as VDC is increased. A maximum is
reached at VDC= Vr and at XP ≈ 0.46tge, above which the
collapse occurs. In order to maintain the equilibrium after this point, we must decrease VDC. However, the equilibrium is
unstable for XP/tge >0.46.
Fig. 1 CMUT geometry
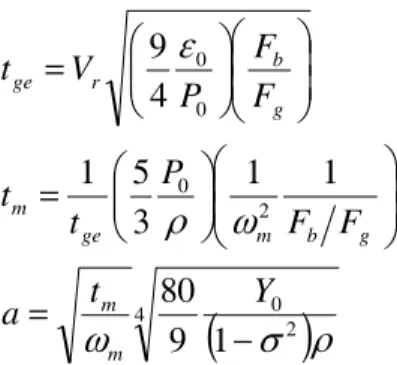
Vr is obtained from the static equilibrium equation as,
(
2)
0 0 2 / 1 2 / 3 227
1
8
σ
ε
−
=
t
t
Y
a
t
V
r m ge m (3)which is the same as the voltage reported in [2]. When an external static pressure, P0, is present, there is also a static
depressing force Fb acting on the plate. Fb/Fg is a measure of
relative effect of this force compared to the restoring force due to the compliance of the plate. The plate is pre-depressed by
Designing Circular CMUT Cells Using
CMUT Biasing Chart
H. Köymen, Senior Member, IEEE, Abdullah Atalar, Fellow, IEEE,
and H. Kağan Oğuz, Student Member IEEE
Bilkent University, Electrical and Electronics Engineering Department, Ankara, Turkey
e-mail: [email protected]
975
978-1-4673-4562-0/12/$31.00 ©2012 IEEE 2012 IEEE International Ultrasonics Symposium Proceedings 10.1109/ULTSYM.2012.0244
this force to XP/tge= Fb/Fg before any voltage is applied. When
we increase VDC, we observe a behavior similar to that in
vacuum. For example, the collapse occurs at XP/tge=0.74 when
Fb/Fg = 0.5, but at a lower VDC/Vr of 0.48. The variation of
normalized displacement at collapse and normalized collapse voltage versus Fb/Fg are all given in [1], (23) and (24)
respectively, and plotted in Fig. 2 as the “collapse line”.
k & Vdc/Vr 0 0,2 0,4 0,6 0,8 1 0 0,1 0,2 0,3 0,4 0,5 0,6 0,7 0,8 0,9 Xp/tge Fb/Fg=0 Fb/Fg=0.1 k k Fb/Fg=0.5 k k=0.7 k=1 col_line Cs=Cm Hunt
Fig. 2 CBC and coupling coefficient as a function of XP/tge.
VDC/Vr: solid lines; k: dashed lines
The collapse voltage is the limiting voltage for any bias in the uncollapsed mode of operation. CBC reveals that as the membrane is allowed to be depressed by static environmental pressure, the collapse voltage becomes a smaller fraction of the collapse voltage in vacuum. For example, it is only 0.09Vr
at Fb/Fg =0.9.
It is possible to show that the quality factor of a cell in air is roughly proportional to the square of the thickness-to-radius ratio, tm/a. It is desirable to have this ratio as small as possible
for a wider bandwidth. On the other hand, smaller this ratio is, more compliant is the plate and it is depressed more by the static pressure.
CBC allows us to include the static pressure into the design as a requirement. In [3], an airborne CMUT design is described for somewhat different driving conditions, where the required plate swing for maximum radiated power is determined first. Then, CMUT is designed such that Fb/Fg is
set to largest possible level which enables this swing level at the minimum drive voltage amplitude.
II. COUPLING COEFFICIENT
A. Coupling coefficient from equivalent circuit
The small signal model presented in [1] is given in Fig. 3.
Fig. 3 Small signal equivalent circuit for the rms model
A common definition for the electromechanical coupling coefficient is the square root of ratio of converted energy to the total stored energy,
tot c
W
W
k
≡
(4) If we consider only the dynamic energies involved in the transduction, the total and converted energies are,⎥
⎥
⎦
⎤
⎢
⎢
⎣
⎡
⎟⎟
⎠
⎞
⎜⎜
⎝
⎛
+
−
+
=
−1 2 0 2 _1
1
2
1
Rm RS R d dyn totC
C
n
C
V
W
(5) and 1 2 2 _1
1
2
1
−⎟⎟
⎠
⎞
⎜⎜
⎝
⎛
+
−
=
Rm RS R dyn cC
C
n
V
W
(6)respectively. Hence the coupling coefficient becomes:
RS Rm Rm RS R d
C
C
C
C
n
C
k
−
+
=
2 01
1
(7)In the presence of a parasitic capacitance, Cp, at the electrical
port, k becomes RS Rm Rm RS R p d
C
C
C
C
n
C
C
k
−
+
+
=
2 01
1
(8)The coupling coefficient is calculated when the membrane is in a mechanical equilibrium and plotted in Fig. 2 as a function of normalized peak displacement, together with CBC. Note that the coupling coefficient becomes unity (k = 1) at the collapse threshold regardless of static depression and the value of the parasitic capacitance.
The collapse threshold and the unity coupling coefficient locus for all static depression conditions are also plotted as collapse line and CRS = CRm lines in the same figure. These two
conditions are the same.
It is possible to calculate the bias level at a particular static pressure, required for a specific coupling coefficient value. Bias voltage levels required for coupling coefficient of 0.7 at a particular static external pressure is also depicted in Fig. 2. Note that k = 1 line is the collapse line. The bias level necessary for k = 0.7 (the coupling coefficient level of PZT-5), is 0.97Vr in vacuum. Although the displacement at this bias
level has some clearance from collapse threshold, this voltage
level is very close to collapse voltage. Hence there is potential for operating CMUT at a high coupling coefficient bias but there is a problem of keeping the CMUT safely in the stable region. Bias level for k = 0.7 becomes 0.984 of collapsing voltage at Fb/Fg = 0.9 (collapsing voltage is 0.0896Vr), which
is even closer to the collapse threshold.
The coupling coefficient in vacuum can be determined from CBC as 0.52 when the CMUT is biased at the commonly used level of VDC/Vr = 0.9. The center displacement becomes XP/tge
= 0.26 at this operating point. When there is static pressure depression of Fb/Fg = 0.9, coupling coefficient becomes 0.47
at VDC/Vr = 0.9.
B. Comparison with Hunt’s Measurements
The electrostatic transducer that Hunt studied in Chapter 6 of [4] is similar to a circular CMUT cell in structure, but made of different materials. Hunt modeled this transducer as a parallel-plate condenser, and made very accurate measurements to experimentally determine various transducer parameters including coupling coefficient. Hunt defined the depressed capacitance as ge H
t
x
C
C
0 0 01
+
=
(9) where x0 is the effective displacement representing thedisplacement in parallel-plate condenser. Experimental determination of x0 at different bias levels is done indirectly
by measuring C0H, and x0 is calculated as
H ge
C
C
t
x
0 0 01
+
=
(10) Measurements show that the collapse occurs when x0/tge is−0.22. Hunt found this level premature because the theoretical limit of expected displacement at collapse is tge/3 in parallel
plate condenser. He suspected that the measurements or the curvature of the membrane may be causing this result.
The transducer that Hunt considered had perforations on the rigid electrode and air can move in and out of the gap. Static operation of this transducer corresponds to operation in vacuum for the model in [1]. Using this model, (10) can be written as
(
P ge)
H get
X
g
C
C
C
C
t
x
0 0 0 0 01
+
=
=
(11) Since the collapse occurs at XP/tge ≈ 0.46 in vacuum, (11)predicts x0/tge ≈ −0.18instead of −1/3. Hunt, however, ended
up with −0.22 instead of −0.18 for x0/tge at collapse threshold.
The behavior of CMUT depends strongly on its electrical termination as it is discussed in the following section. The termination is not known for these measurements since the
method used for measuring the capacitance is not detailed in [4]. If the measurement set up incorporates very high impedance connections for the source, the performance of CMUT is affected. It is assumed that the source impedance of the measurement set up is low enough so that voltage drive conditions prevail. Also, the way C0H is measured in the
experiment introduces an effect of mechanical section and results in a larger value for C0H. This effect increases as the
biasing voltage is increased.
Measurement results are reported in Fig. 6.7 of [4] for coupling coefficient and x0/tge. This data is converted for XP/tge
(within reading accuracy) and plotted on Fig. 2. Measured k values follow model prediction for k and XP/tge less than 0.4
and 0.2, respectively. For larger values measurements become erroneous as discussed above.
III. RECEIVER OPERATION
The open circuit receiving voltage (OCRV) at very low frequencies (compared to resonance frequency) can also be readily obtained as the transfer function of an open circuit CMUT from Fig. 3 as
=
(12)
where p is incident pressure and Cp is the parasitic
capacitance. (12) can be written as
=
,
,
(13)in V/Pa, where all dimensions are in meters. (13) implies that the plate diameter must be as large as possible and it must be thin compared to both the diameter and the effective gap for highest sensitivity. When expressed in dB, (13) becomes
=
+ +
, ,
(14)For a CMUT of 1 cm diameter, the first term is −46.5 dB//(V/Pa), or −166.5 dB//(V/μPa) for Y0 ≈ 100 GPa.
This is a very high sensitivity compared to PZT based hydrophones. Second term depends on cell dimensions and is 10 dB or higher in typical designs of present practice.
The third term, , , , is a function of the normalized parasitic capacitance and the operational parameters, the normalized static displacement and force. This term is plotted in Fig. 4 for C p = 0 and Cp = C0. It can be clearly seen that
critical biasing improves the receiver sensitivity dramatically. However, it must be noticed that the maximum sensitivity
occurs at a static displacement above the collapse threshold for voltage drive operation, when the parasitic capacitance is negligible. For example, in vacuum the collapse occurs at a normalized displacement of about 0.63 compared to 0.46. The clamp capacitance is not shunted under open circuit operating conditions, and the collapse occurs when
=
+
(15)
instead of CRS = CRm, When Cp is significant, the static
displacement required for collapse decreases. If there is excessive parasitic capacitance such that Cp >> C0, however,
collapse displacement approaches to that of voltage drive condition.
Fig. 4 Receiver sensitivity multiplier , ,
IV. CMUT DIMENSIONS The mechanical resonance frequency is
Rm Rm m
L
C
1
2=
ω
(16)in terms of equivalent circuit parameters. Using (3) and (16) with Rm ge g b
C
t
P
a
F
F
5
3
0 2π
=
(17)we determine the CMUT dimensions uniquely as
(
)
4 2 0 2 0 0 01
9
80
1
1
3
5
1
4
9
ρ
σ
ω
ω
ρ
ε
−
=
⎟
⎟
⎠
⎞
⎜
⎜
⎝
⎛
⎟⎟
⎠
⎞
⎜⎜
⎝
⎛
=
⎟
⎟
⎠
⎞
⎜
⎜
⎝
⎛
⎟⎟
⎠
⎞
⎜⎜
⎝
⎛
=
Y
t
a
F
F
P
t
t
F
F
P
V
t
m m g b m ge m g b r ge (18)The bias voltage to be used must be within the available dc voltage level. Consider a plate of material with Y0 of 130 GPa,
Poisson’s ratio of 0.27 and density of 3.27g/cm3. If we wish to
operate the cell at a depression level of Fb/Fg= 0.1 and at a
collapse voltage of 35V, we find the required Vr as 39.2V
using (24) in [1]. At 1 atm environmental pressure, tge is 0.175
micrometer. If the required mechanical resonance frequency is 5 MHz, plate thickness, tm, becomes 2.95 micrometers and the
diameter, a, is 42.8 micrometers.
Should we wish to operate the cell at the same collapse voltage (35V) but at a higher depression of Fb/Fg= 0.3, Vr
becomes 51.3V. Again at the same environmental pressure and for the same mechanical resonance frequency, tge, tm and a
are 0.397, 0.434 and 16.4 micrometers, respectively. Note that when the depression level is increased, a/tm ratio also increases
from 14.5 to 37.8 and the cell’s bandwidth becomes wider. The above design exercise can similarly be done for a specific VDC/Vcol ratio for a fixed dc voltage, instead of
collapse voltage. Also actual operational resonance frequency can be used instead of ωm, by including other relevant
elements in the equivalent circuit into the frequency equation.
ACKNOWLEDGMENT
This work is supported in part by Turkish Scientific and Research Council (TUBITAK) under project grant 110E216.
REFERENCES
[1] Köymen, H., Atalar, A, Aydoğdu, E, Kocabaş, C, Oğuz, H.K., Olçum, S, Özgürlük, A., Ünlügedik, A., “An improved lumped element nonlinear circuit model for a circular CMUT cell,” IEEE Trans. Ultrason.
Ferroelectr. Freq. Control , vol. 59, no. 8, pp. 1791-1799, August 2012.
[2] S. Olcum, M. Senlik, and A. Atalar, “Optimization of the gain-bandwidth product of capacitive micromachined ultrasonic transducers,”
IEEE Trans. Ultrason. Ferroelectr. Freq. Control, vol. 52, no. 12,
pp.2211-2219, Dec. 2005.
[3] Ünlügedik, A., Atalar, E, Kocabaş, C, Oğuz, H.K, Köymen, H., “Electrically Unbiased Driven Airborne Capacitive Micromachined Ultrasonic Transducer Design,” in 2012 IEEE Ultrasonics Symposium, Dresden, October, 2012.
[4] F.V. Hunt, Electroacoustics, The Analysis of Transduction and its Historical Background, 1954, reprint American Institute of Physics, 1982.