DEVELOPMENT OF MULTIFUNCTIONAL NANOFIBROUS
MATERIALS VIA ELECTROSPINNING
A DISSERTATION SUBMITTED TO
MATERIALS SCIENCE AND NANOTECHNOLOGY PROGRAM
OF THE GRADUATE SCHOOL OF ENGINEERING AND SCIENCE
OF BILKENT UNIVERSITY
IN PARTIAL FULFILLMENT OF THE REQUIREMENTS
FOR THE DEGREE OF
DOCTOR OF PHILOSOPHY
By
FATMA KAYACI
ii
I certify that I have read this thesis and that in my opinion it is fully adequate, in scope and in quality, as a thesis of the degree of Doctor of Philosophy.
………. Assoc. Prof. Dr. Tamer Uyar (Advisor)
I certify that I have read this thesis and that in my opinion it is fully adequate, in scope and in quality, as a thesis of the degree of Doctor of Philosophy.
………. Assist. Prof. Dr. Necmi Bıyıklı
I certify that I have read this thesis and that in my opinion it is fully adequate, in scope and in quality, as a thesis of the degree of Doctor of Philosophy.
………. Assoc. Prof. Dr. Ali Çırpan
iii
I certify that I have read this thesis and that in my opinion it is fully adequate, in scope and in quality, as a thesis of the degree of Doctor of Philosophy.
………. Assoc. Prof. Dr. Fatih Büyükserin
I certify that I have read this thesis and that in my opinion it is fully adequate, in scope and in quality, as a thesis of the degree of Doctor of Philosophy.
………. Assist. Prof. Dr. Hasan Tarık Baytekin
Approved for the Graduate School of Engineering and Science:
………. Prof. Dr. Levent Onural
iv
ABSTRACT
DEVELOPMENT OF MULTIFUNCTIONAL NANOFIBROUS
MATERIALS VIA ELECTROSPINNING
Fatma Kayacı
PhD in Materials Science and Nanotechnology Supervisor: Assoc. Prof. Dr. Tamer Uyar
September, 2014
Electrospun nanofibers are very attractive for many applications including functional textile, biomedical, energy, sensor, biotechnology, food packaging and filtration due to their large surface area to volume ratio, pores in nano range, high encapsulation efficiency, low basis weight and design flexibility for physical/chemical modification. Cyclodextrins (CD) are applicable in several industries such as pharmaceutical, cosmetic, textile, functional food and filtration owing to their intriguing ability to form non-covalent host-guest inclusion complexes (IC) with a variety of molecules. Furhermore, atomic layer deposition (ALD) technique can be effectively used to deposit metal oxides onto temperature-sensitive polymeric substrates.
In this dissertation, initially, CD-IC of bioactive compounds (vanillin, eugenol, geraniol, triclosan) having antibacterial and/or antioxidant properties were incorporated into electrospun nanofibers via electrospinning. Higher thermal stability, controlled/sustained release, enhanced solubility and functionality of these compounds have been provided by CD-IC. These specific properties of CD-IC have been combined with high surface area and nanoporous structure of electrospun nanofibers. Thereby, the resulting functional nanofibrous materials can be quite applicable in active food packaging in order to prevent foodborne diseases by providing safety/quality of nutrition and extending shelf life of food. On the other hand, CD incorporated electrospun nanofibers have also been developed for efficient removal of unpleasant odors, hazardous organic waste molecules from air by taking advantages of not only high surface area and nanoporous structure of nanofibers but also IC capability of CD. Since CD are water soluble, CD polymer (CDP) coated onto nanofibers have been also obtained for molecular filtration of polyaromatic hydrocarbons from aqueous environment. Moreover, metal oxides (ZnO, TiO2) have
been deposited onto electrospun nanofibers via ALD in order to develop efficient and energy saving innovative nanofibrous membrane materials for water purification and waste treatment. Thus, organic pollutants in water have been effectively disintegrated by photocatalytic activity of these nanofibrous filtering materials having high surface area.
Overall, the multifunctional electrospun nanofibrous materials have been improved by incorporating CD-IC or CD into the fiber matrix; by coating either CDP or metal oxides (ZnO, TiO2) onto fiber surface to enhance possible applications of
nanofibers for filtration, food packaging, functional textiles, etc.
Keywords: electrospinning, nanofibers, cyclodextrin, inclusion complex, atomic
v
ÖZET
ELEKTROEĞİRME YÖNTEMİ İLE ÇOK FONKSİYONLU
NANOLİFLERDEN OLUŞAN MALZEMELERİN
GELİŞTİRİLMESİ
Fatma KayacıMalzeme Bilimi ve Nanoteknoloji, Doktora Tez Danışmanı: Doç. Dr. Tamer Uyar
Eylül, 2014
Elektroeğirme yöntemi ile elde edilen nanolifler yüksek yüzey alanı, nano boyutta gözenekleri, yüksek kapsülleme verimi, düşük ağırlığı ve fiziksel/kimyasal modifikasyon çeşitliliği sebebiyle fonksiyonel tekstil, biyomedikal, enerji, sensör, biyoteknoloji ve gıda paketlemesi alanlarında ilgi çekmektedir. Siklodekstrinler (CD) değişik moleküller ile kovalent olmayan misafir-ev sahibi inküzyon kompleks (IC) oluşturabilme yetenekleri sayesinde ilaç, kozmetik, tekstil, fonksiyonel gıda ve filtrasyon endüstrilerinde kullanılabilirler. Bunların yanı sıra, atomik katman kaplama (ALD) tekniği sıcaklık hassasiyesti olan organik maddelere metal oksit kaplanması için etkin bir biçimde kullanılabilir.
Bu tezde, ilk olarak, antibakteriyel ve/veya antioksidan özellikleri olan biyoaktif bileşimlerin (vanilya, öjenol, geraniol, triklosan) CD-IC’leri elektrospin yöntemi sırasında nanoliflerin içerisine katılmıştır. CD-IC’ler sayesinde bu bileşimlerin ısıl dayanımı, kontrollü/devamlı salımı, çözünürlükleri ve etkinlikleri geliştirilmiştir. CD-IC’lerin bu özellikleri ile nanoliflerin yüksek yüzey alanı ve nanoboyutta gözenekli yapısı birleştirilmiştir. Bu nedenle elde edilen fonksiyonel nanolifler gıdalarda güven/kalite sağlayıp gıdaların raf ömürlerini uzatarak, gıda kaynaklı hastalıkları engellemek amacıyla paketleme malzemesi olarak oldukça kullanışlı olabilirler. Diğer taraftan, hem nanoliflerin yüksek yüzey alanı ve nanoboyutta gözenekli yapılarının hem de CD’lerin IC oluşturma kabiliyetlerinin avantajları kullanılarak havadan istenmeyen kokuların ve zararlı atık moleküllerin etkin bir şekilde uzaklaştırılması için CD içeren nanolifler geliştirilmiştir. CD’ler suda çözündüğü için, sulu ortamda poliaromatik hidrokarbonların moleküler filtrasyonunu sağlamak amacıyla CD polimeri (CDP) kaplanmış nanolifler de elde edilmiştir. Ayrıca, su saflaştrılması ve atık arıtımında etkili ve enerji tasarrufu sağlayan yenilikçi membran malzemeleri geliştirmek için elektrospin ile elde edilen nanoliflerin üzerine ALD tekniği ile metal oksitler (ZnO, TiO2) kaplanmıştır.
Böylece, yüksek yüzey alanına sahip bu nanoliflerin fotokatalitik özellikleri sayesinde su içerisindeki organik kirliliklerin bozunması sağlanmıştır.
Sonuç olarak, filtrasyon, gıda paketlemesi ve fonksiyonel tekstil alanlarında nanoliflerin kullanım potansiyellerini arttırmak amacıyla nanoliflerin içerisine CD-IC veya CD katarak, ya da yüzeylerine CDP veya metal oksit (ZnO, TiO2) kaplayarak
çok fonsiyonlu nanolif tabanlı malzemeler geliştirilmiştir.
Anahtar kelimeler: elektroeğirme, nanolifler, siklodekstrin, inklüzyon kompleks,
vi
ACKNOWLEDGEMENTS
Initially, I would like to thanks and gratitude to my supervisor Assoc. Prof. Dr. Tamer Uyar for his invaluable guidance, continuos support, encouragement, confidence and patience during my graduate studies. I extended my knowledge and vision due to his motivation to me in diverse research projects. I am also indebted to Dr. Sesha Vempati for his valuable mentor on my research studies regarding photocatalytic activity about which I have learned many things from him. I feel extremely grateful especially for the mankind and friendship he provided me. The members of my thesis committee, Assist. Prof. Dr. Necmi Bıyıklı, Assoc. Prof. Dr. Ali Çırpan, Assoc. Prof. Dr. Fatih Büyükserin and Assist. Prof. Dr. Hasan Tarık Baytekin, are gratefully acknowledged for their insightful comments.
I would also like to express my deep appreciation to Aslı Çelebioğlu for her generous help and contributions in all time during these five years. I could not have imagined this period without her kind friendship. Gratitude extends to Yelda Ertaş and Zeynep Aytaç not only for their collaboration, but also their valuable friendship. I am pleased to have very kind lab-mates: Şefika Eroğlu Özcan, A. Ekrem Deniz, Dr. N. Oya San, Dr. Anitha Senthamizan, Dr. V. Jagadeesh Babu and Ö. Faruk Sarıoğlu. Ruslan Garifullin has also deserved many thanks for various assistance.
I am sincerely thankful to Assist. Prof. Dr. Necmi Bıyıklı, Dr. Çağla Özgit-Akgün and İnci Dönmez for their efforts in research projects where we combined electrospinning and ALD processes. I also thank Assist. Prof. Engin Durgun and Dr. H. Sener Sen who have performed the CD and CD-IC modeling studies. Many thanks to Assoc. Prof. Turgay Tekinay and Özgün C.O. Umu for antibacterial study.
I am very grateful for having the opportunity to work with UNAM facilities, thereby I would like to thank to everyone contributed to the founding and working of UNAM.
Foremost, I want to express my gratitude to my parents: Zehra Kayacı and Ali Kayacı for their love, endless support, understanding, patience and prayers. I owe them a lot which cannot be paid. Very special thanks to Kürşad Kayacı and Osman Kayacı for their lovely brotherhood. I’m especially grateful to my dearest friend İlkay Keneş Yılmaz who is like a sister for me.
Finally, TÜBİTAK-BİDEB 2211 Ph.D. fellowship programme and TÜBİTAK project # 110M612 and 111M459 deserve great portion of acknowledgements due to their financial support.
vii
Anneme ve Babama…
(Zehra & Ali Kayacı)
viii
CONTENTS
1. INTRODUCTION ... 1
1.1. Electrospinning ... 1
1.2. Cyclodextrins ... 7
1.3. Atomic Layer Deposition of Metal Oxides ... 11
1.4. Photocatalytic Activity of Metal Oxides ... 14
2. NANOFIBERS INCORPORATING CYCLODEXTRIN INCLUSION COMPLEXES ... 18
2.1. Summary ... 19
2.2. Formation of Solid Vanillin/Cyclodextrin-Inclusion Complexes and Nanofibers Incorporating These Complexes ... 23
2.2.1. Solid Inclusion Complexes of Vanillin with Cyclodextrins: Their Formation, Characterization and High Temperature Stability ... 23
2.2.1.1. Experimental ... 23
2.2.1.2. Results and Discussion ... 25
2.2.1.3. Conclusions ... 35
2.2.2. Encapsulation of Vanillin/Cyclodextrin Inclusion Complex in Electrospun Polyvinyl alcohol (PVA) Nanowebs: Prolonged Shelf-life and High Temperature Stability of Vanillin ... 36
2.2.2.1. Experimental ... 36
2.2.2.2. Results and Discussion ... 39
2.2.2.3. Conclusions ... 49
2.3. Enhanced Thermal Stability of Eugenol by Cyclodextrin Inclusion Complex Encapsulated in Electrospun Polymeric Nanofibers ... 50
2.3.1. Experimental ... 50
2.3.3. Results and Discussion ... 54
2.3.4. Conclusions ... 65
2.4. Functional Electrospun Polymeric Nanofibers Incorporating Geraniol-Cyclodextrin Inclusion Complexes: High Thermal Stability and Enhanced Durability of Geraniol ... 66
2.4.1. Experimental ... 66
2.4.2. Results and Discussion ... 68
2.4.3. Conclusions ... 78
2.5. Antibacterial Electrospun Polylactic acid (PLA) Nanofibrous Webs Incorporating Triclosan/Cyclodextrin Inclusion Complexes ... 80
ix
2.5.1. Experimental ... 80
2.5.2. Results and Discussion ... 83
2.5.3. Conclusions ... 93
3. CYCLODEXTRIN FUNCTIONALIZED ELECTROSPUN NANOFIBERS ... 94
3.1. Summary ... 95
3.2. Electrospinning of Zein Nanofibers Incorporating Cyclodextrins ... 99
3.2.1. Experimental ... 99
3.2.2. Results and Discussion ... 101
3.2.3. Conclusions ... 117
3.3. Electrospun Nylon 6,6 Nanofibers Functionalized with Cyclodextrins for Removal of Toluene Vapor ... 118
3.3.1. Experimental ... 118
3.3.2. Results and Discussion ... 121
3.3.3. Conclusions ... 134
3.4. Electrospun Polyester/Cyclodextrin Nanofibers for Entrapment of Volatile Organic Compounds ... 135
3.4.1. Experimental ... 135
3.4.2. Results and Discussion ... 138
3.4.3. Conclusions ... 149
3.5. Surface Modification of Electrospun Polyester Nanofibers with Cyclodextrin Polymer for the Removal of Phenanthrene from Aqueous Solution... 150
3.5.1. Experimental ... 150
3.5.2. Results and Discussion ... 153
3.5.3. Conclusions ... 164
4. FUNCTIONAL NANOFIBERS VIA ELECTROSPINNING AND ATOMIC LAYER DEPOSITION ... 166
4.1. Summary ... 167
4.2. Polymer-Inorganic Core-Shell Nanofibers by Electrospinning and Atomic Layer Deposition: Flexible Nylon-ZnO Core-Shell Nanofiber Mats and Their Photocatalytic Activity ... 172
4.2.1. Experimental ... 172
4.2.2. Results and Discussion ... 175
4.2.3. Conclusions ... 189
4.3. Surface-Decorated ZnO Nanoparticles and ZnO Nanocoating on Electrospun Polymeric Nanofibers by Atomic Layer Deposition for Flexible Photocatalytic Nanofibrous Membranes ... 191
x
4.3.1. Experimental ... 191
4.3.2. Results and Discussion ... 194
4.3.3. Conclusions ... 203
4.4. Enhanced Photocatalytic Activity of Homoassembled ZnO Nanostructures on Electrospun Polymeric Nanofibers: A Combination of Atomic Layer Deposition and Hydrothermal Growth ... 204
4.4.1. Experimental ... 204
4.4.2. Results and Discussion ... 207
4.4.3. Conclusions ... 225
4.5. Role of Zinc Interstitials and Oxygen Vacancies of ZnO in Photocatalysis: A Bottom-up Approach to Control the Defect Density ... 227
4.5.1. Experimental ... 227
4.5.2. Results and Discussion ... 230
4.5.3. Conclusions ... 251
4.6. Selective Isolation of Electron or Hole in Photocatalysis: ZnO-TiO2 and TiO2 -ZnO Core-Shell Structured Heterojunction Nanofibers via Electrospinning and Atomic Layer Deposition ... 253
4.6.1. Experimental ... 253
4.6.2. Results and Discussion ... 255
4.6.3. Conclusions ... 273
5. EPILOGUE ... 275
LIST OF PUBLICATIONS ... 285
BIBLIOGRAPHY ... 288
xi
LIST OF ABBREVIATIONS
CD : Cyclodextrins
IC : Inclusion complexes
CDP : Cyclodextrin polymer
ALD : Atomic layer deposition
PCA : Photocatalytic activity
AFD : Average fiber diameter
SEM : Scanning electron microscope
TEM : Transmission electron microscope
HRTEM : High resolution transmission electron microscope
SAED : Selected area electron diffraction
FFT : Fast Fourier transform
EDX : Energy dispersive X-ray
XRD : X-ray diffraction
FWHM : Full width at half maximum
1
H-NMR : Proton nuclear magnetic resonance
FTIR : Fourier transform infrared
ATR : Attenuated total reflectance
TGA : Thermogravimetric analyzer
DSC : Differential scanning calorimeter
GC-MS : Gas chromatography-mass spectrometry
BET : Brunauer– Emmett–Teller
DMA : Dynamic mechanical analyzer
xii PL : Photoluminescence
SE : Spectroscopic ellipsometry
PBT : Polybutylene terephthalate
PVA : Polyvinyl alcohol
PLA : Polylactic acid
PET : Polyester PAN : Poly(acrylonitrile) PSU : Polysulfone PVP : Poly (vinylpyrrolidone) EG : Eugenol TR : Triclosan
TFA : Ttrifluoroacetic acid
ACN : Acetonitrile
DMF : N,N-dimethylformamide
DCM : Dichloromethane
HFIP : 1,1,1,3,3,3-hexafluoro-2-propanol
DMSO-d6 : Deuterated dimethylsulfoxide
Rh-B : Rhodamine-B
MB : Methylene blue
DEZn : Diethylzinc
ZAD : Zinc acetate dihydrate
HMTA : Hexamethylene tetramine
DI : De-ionised
xiii
TDMAT : Tetrakis (dimethylamido) titanium
SHPI : Sodium hypophosphite hydrate
CTR : Citric acid
VOC : Volatile organic compounds
PAH : Polycyclic aromatic hydrocarbon
S. aureus : Staphylococcus aureus
E. coli : Escherichia coli
NP : Nanoparticles QDs : Quantum dots NC : Nanocoating CSHJ : Core-shell heterojunction VB : Valance band CB : Conduction band
BGR : Bulk grain region
DR : Depletion region
VO : Oxygen vacancy
Zni : Zinc interstitials
FX : Free exciton ˙OH : Hydroxyl radical ppm : Parts per million
DFT : Density functional theory
Ecomplex : Complexation energy
tan δ : Loss tangent
xiv
LIST OF FIGURES
Figure 1. Schematic view of electrospinning. (Copyright © 2012, American Chemical Society. Reprinted with permission from Ref.[11]) ... 2
Figure 2. Electrospinning unit at UNAM. ... 2
Figure 3. The SEM image of the nylon 6,6 nanofibers collected on a human hair. ... 3
Figure 4. SEM images with AFD of the electrospun nanofibers obtained from different concentration of PBT solutions in TFA (a) 5%, (b) 8% and (c) 12.5% (w/v). ... 4
Figure 5. SEM images of electrospun nanofibers obtained from different concentration of nylon 6,6 solutions in formic acid (a) 10% and (b) 15% (w/v). ... 5
Figure 6. (a) Chemical structures, (b) schematic representations with approximate dimensions of α-CD, β-CD, and γ-CD. ... 7 Figure 7. Schematic representation of CD-IC formation. ... 8
Figure 8. Industrial applications of CD. ... 10
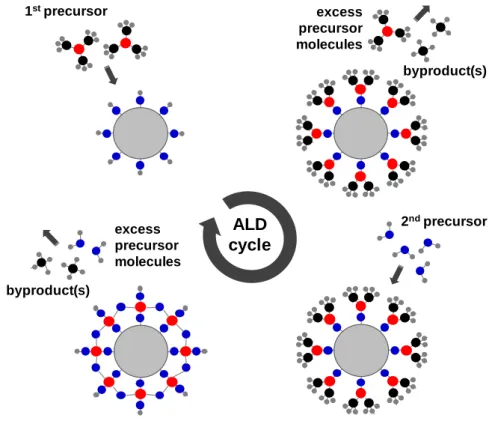
Figure 9. Schematic representation of the processing steps for one ALD cycle. (Copyright © 2012, American Chemical Society. Reprinted with permission from Ref.[11]) ... 12
Figure 10. Schematic diagram depicting the energetic locations of the various defects in the band gap of ZnO. (ecptr and hcptr: electron and hole capture). (Copyright ©
2014, Elsevier. Reprinted with permission from Ref.[157]) ... 17
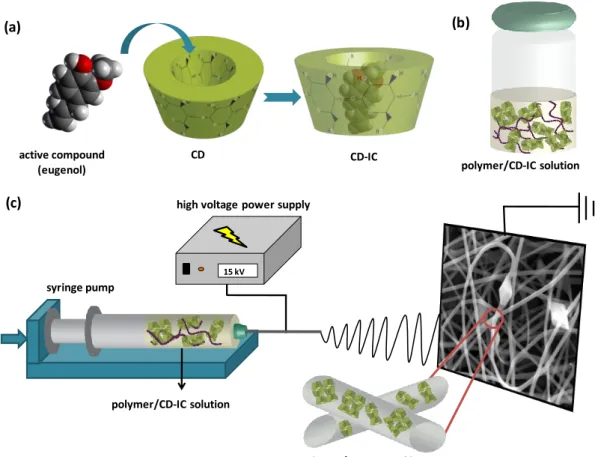
Figure 11. Schematic representations of (a) formation of CD-IC, (b) polymer/CD-IC solution and (c) electrospinning of nanofibers from polymer/CD-IC solution. (Copyright © 2013, American Chemical Society. Reproduced with permission from Ref.[199]) ... 20
Figure 12. FTIR spectra of (a) as-received (i) α-CD, (ii) β-CD, (iii) γ-CD and (b) (i) vanillin/α-CD-IC, (ii) vanillin/β-CD-IC, (iii) vanillin/γ-CD-IC, (iv) vanillin/γ-CD-IC
xv
(co-precipitation) and (v) vanillin. (Copyright © 2011, American Chemical Society. Reprinted with permission from Ref. [70]) ... 26
Figure 13. 1H-NMR spectra of (a) vanillin, (b) vanillin/α-CD-IC, (c) vanillin/β-CD-IC, (d) vanillin/γ-CD-vanillin/β-CD-IC, (e) vanillin/γ-CD-IC (co-precipitation). (Copyright © 2011, American Chemical Society. Reprinted with permission from Ref. [70]) ... 28
Figure 14. Schematic representations of packing structures of (a) cage-type and (b) channel-type CD crystals. (Copyright © 2013, American Chemical Society. Reprinted with permission from Ref.[199]) ... 29
Figure 15. XRD patterns of as-received (a) (i) α-CD, (ii) β-CD, and (iii) γ-CD; (b) (i) vanillin/α-CD-IC, (ii) vanillin/β-CD-IC, (iii) vanillin/γ-CD-IC, (iv) vanillin/γ-CD-IC (co-precipitation), and (v) vanillin. (Copyright © 2011, American Chemical Society. Reprinted with permission from Ref. [70]) ... 29 Figure 16. DSC thermograms of (a) (i) vanillin/α-CD-IC, (ii) vanillin/β-CD-IC, (iii) vanillin/γ-CD-IC, and (iv) vanillin/γ-CD-IC (co-precipitation) and (b) (i) vanillin/α-CD physical mixture (ii) vanillin/β-vanillin/α-CD physical mixture (iii) vanillin/γ-vanillin/α-CD physical mixture (iv) vanillin. (Copyright © 2011, American Chemical Society. Reprinted with permission from Ref. [70])... 31 Figure 17. TGA thermograms of (a) (i) α-CD (ii) CD-IC (iii) vanillin/α-CD physical mixture (iv) vanillin; (b) (i) β-vanillin/α-CD, (ii) vanillin/α-CD-IC, (iii) vanillin/β-CD physical mixture, and (iv) vanillin; and (c) (i) γ-vanillin/β-CD, (ii) vanillin/γ-vanillin/β-CD-IC, (iii) vanillin/γ-CD-IC (co-precipitation), (iv) vanillin/γ-CD physical mixture, and (v) vanillin. (Copyright © 2011, American Chemical Society. Reprinted with permission from Ref. [70]) ... 34
Figure 18. SEM images and fiber diameter distribution of the electrospun nanowebs obtained from solutions of (a) PVA, (b) PVA/vanillin, (c) PVA/vanillin/α-CD-IC (d) PVA/vanillin/β-CD-IC and (e) PVA/vanillin/γ-CD-IC. The insets show the high magnification images. (Copyright © 2012, Elsevier. Reprinted with permission from Ref.[202]) ... 41
xvi
Figure 19. XRD patterns of (a) as-received CD, (b) vanillin and the electrospun nanowebs, (c) DSC thermograms of vanillin and the electrospun nanowebs. (Copyright © 2012, Elsevier. Reprinted with permission from Ref.[202]) ... 42
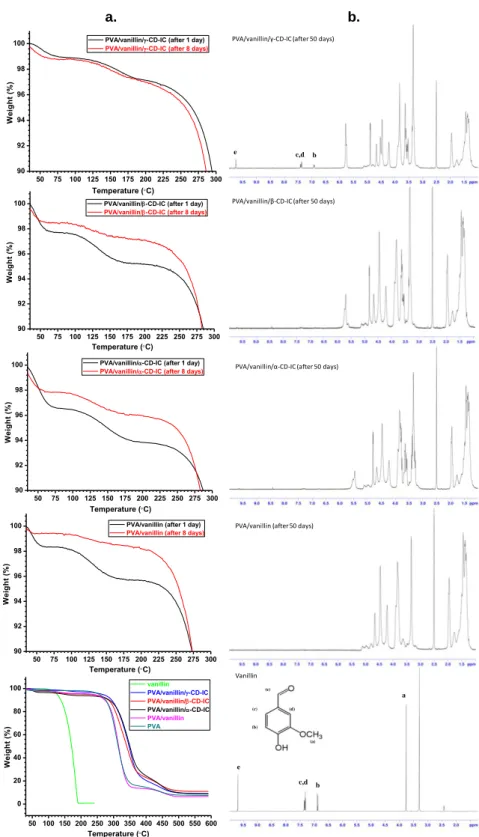
Figure 20. (a) TGA thermograms of the electrospun nanowebs after 1 and 8 days of storage period, (b) 1H-NMR solution spectra of vanillin and the electrospun nanoweb samples dissolved in DMSO-d6 after 50 days of storage. (Copyright © 2012,
Elsevier. Reprinted with permission from Ref.[202]) ... 46
Figure 21. The phographs of the solutions of (a) EG/α-CD, EG/β-CD-IC and EG/γ-CD-IC, (b) PVA, PVA/EG, PVA/EG/α-CD, PVA/EG/β-CD-IC and PVA/EG/γ-CD-IC. (Copyright © 2013, American Chemical Society. Reprinted with permission from Ref.[199]) ... 51
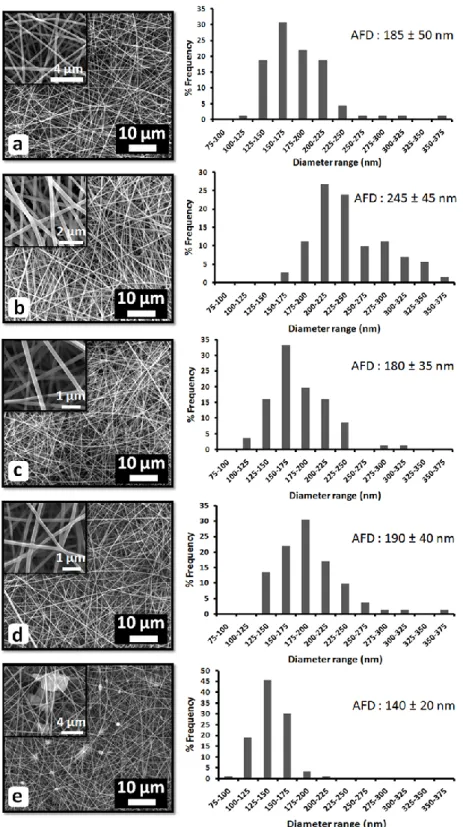
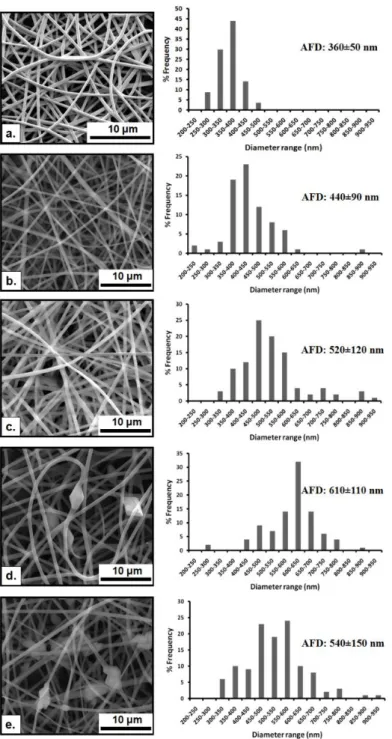
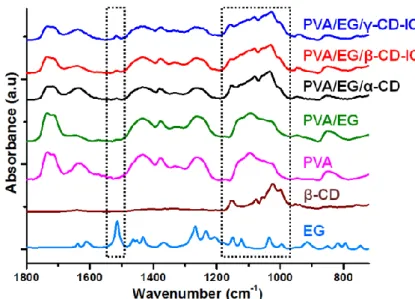
Figure 22. SEM images and fiber diameter distributions with average fiber diameters (AFD) of the electrospun nanofibers obtained from solutions of (a) PVA, (b) PVA/EG, (c) PVA/EG/α-CD, (d) PVA/EG/β-CD-IC and (e) PVA-EG/γ-CD-IC. (Copyright © 2013, American Chemical Society. Reprinted with permission from Ref.[199]) ... 56 Figure 23. FTIR spectra of EG, β-CD and the electrospun nanofibers. (Copyright © 2013, American Chemical Society. Reprinted with permission from Ref.[199]) ... 57
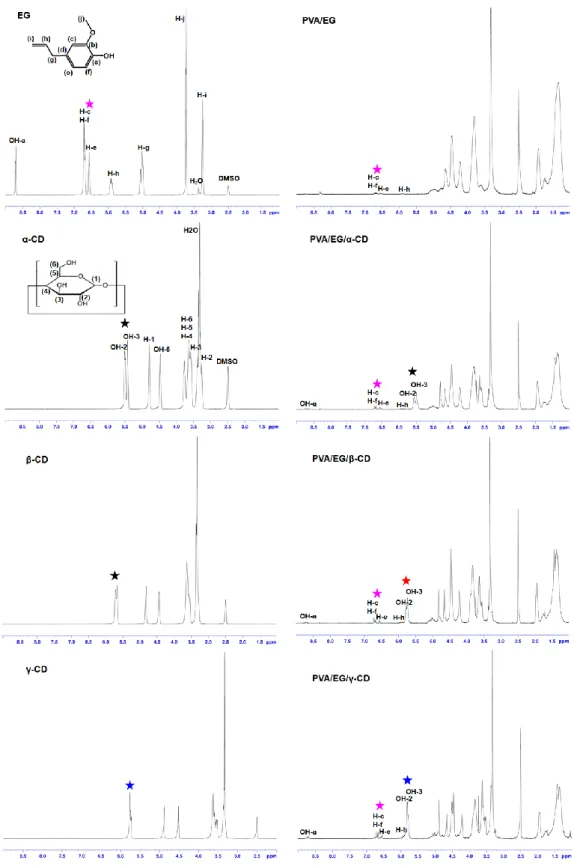
Figure 24. 1H-NMR spectra of EG, CD and the electrospun nanofibers. (Protons used for calculation of EG/CD ratio, are shown by star sign; pink: EG, black: α-CD, red: β-CD, blue: γ-CD). (Copyright © 2013, American Chemical Society. Reprinted with permission from Ref.[199]) ... 59
Figure 25. XRD patterns of (a) as-received CD and (b) the electrospun nanofibers. (Copyright © 2013, American Chemical Society. Reprinted with permission from Ref.[199]) ... 61
Figure 26. TGA thermograms of EG and the electrospun nanofibers. (Copyright © 2013, American Chemical Society. Reprinted with permission from Ref.[199]) ... 62
xvii
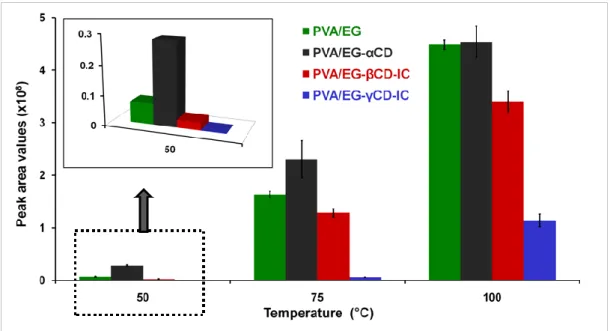
Figure 27. The peak areas of EG in headspace GC-MS chromatogram of electrospun nanofibers agitated at 50 °C, 75 °C and 100 °C for 30 min. (Copyright © 2013, American Chemical Society. Reprinted with permission from Ref.[199]) ... 64
Figure 28. XRD patterns of (a) as-received CD, (b) geraniol/CD-IC and (c) the electrospun nanofibers (NF). (Copyright © 2014, Elsevier. Reprinted with permission from Ref.[200]) ... 69
Figure 29. TGA thermograms of (a) geraniol, γ-CD, geraniol/CD-IC and (b) the electrospun nanofibers (NF). (Copyright © 2014, Elsevier. Reprinted with permission from Ref.[200]) ... 71
Figure 30. NMR spectrum of geraniol/γ-CD-IC and the electrospun nanofibers (NF). (Copyright © 2014, Elsevier. Reprinted with permission from Ref.[200]) ... 72
Figure 31. Side and top view of optimized structures of geraniol a) geraniol/α-CD-IC, b) geraniol/β-CD-geraniol/α-CD-IC, c) geraniol/γ-CD-IC. Extra hydrogen bonds are shown by dashed lines. Gray, red, and yellow spheres represent carbon, oxygen, and hydrogen atoms, respectively. (Copyright © 2014, Elsevier. Reprinted with permission from Ref.[200]) ... 74
Figure 32. Representative SEM images of (a) PVA, (b) PVA/geraniol and (c) PVA/geraniol/γ-CD-IC nanofibers. (Copyright © 2014, Elsevier. Reprinted with permission from Ref.[200]) ... 76
Figure 33. 1H NMR spectra of TR/CD-IC dissolved in DMSO-d6. (Copyright ©
2013, American Chemical Society. Reprinted with permission from Ref.[201]) ... 84
Figure 34. (a) FTIR spectra of as-received CD, pure TR and solid TR/CD-IC and (b) enlarged region of FTIR spectra between 1550 and 1400 cm-1 of pure TR and solid TR/CD-IC. (Copyright © 2013, American Chemical Society. Reprinted with permission from Ref.[201]) ... 86
Figure 35. XRD patterns of (a) as-received CD, pure TR and solid TR/CD-IC, (b) the resulting electrospun nanowebs. (Copyright © 2013, American Chemical Society. Reprinted with permission from Ref.[201]) ... 87
xviii
Figure 36. DSC thermograms of pure TR and solid TR/CD-IC. (Copyright © 2013, American Chemical Society. Reprinted with permission from Ref.[201]) ... 88
Figure 37. TGA thermograms of (a) as received CD and (b) pure TR and solid TR/CD-IC. (Copyright © 2013, American Chemical Society. Reprinted with permission from Ref.[201]) ... 89
Figure 38. Representative SEM images of the electrospun nanowebs obtained from solutions of (a) PLA, (b) PLA/TR, (c) PLA/TR/β-CD-IC and (d) PLA/TR/γ-CD-IC. (Copyright © 2013, American Chemical Society. Reprinted with permission from Ref.[201]) ... 91
Figure 39 The photographs of antibacterial test of the electrospun nanowebs after 24 h incubation at 37 °C. (Copyright © 2013, American Chemical Society. Reprinted with permission from Ref.[201])... 93
Figure 40. Schematic representatio of electrospinning of polymer/CD solution. (Copyright © 2014 Society of Plastics Engineers. Reproduced with permission from Ref.[271]) ... 95
Figure 41. Schematic representations of the formation of PET/CDP nanofibers and removal of phenanthrene from aqueous solution using these nanofibrous mat. (Copyright © 2013, Elsevier. Reprinted with permission from Ref.[299]) ... 99
Figure 42. Representative SEM images of electrospun zein nanofibers obtained from zein solutions in DMF at a concentration of (a) 40%, (b) 50% and (c) 60% (w/v). (Copyright © 2012, Elsevier. Reprinted with permission from Ref.[287]) ... 102 Figure 43. Representative SEM images of electrospun nanofibers of (a1) zein40/α-CD10, (a2) zein40/α-CD10, (a3) zein40/γ-zein40/α-CD10, (a4) zein40/α-CD25, (a5) zein40/β-CD25, (a6) zein40/γ-zein40/β-CD25, (a7) zein40/α-CD50, (a8) zein40/β-CD50 and (a9) zein40/γ-CD50; (b1) zein50/α-CD10, (b2) zein50/β-CD10, (b3) zein50/γ-CD10, (b4) zein50/α-CD25, (b5) zein50/β-CD25, (b6) zein50/γ-CD25, (b7) zein50/α-CD50, (b8) zein50/β-CD50 and (b9) zein50/γ-CD50; (c1) zein60/α-CD10, (c2) zein60/β-CD10, (c3) CD10, (c4) zein60/α-CD25, (c5) zein60/β-CD25 and (c6) zein60/γ-CD25. (Copyright © 2012, Elsevier. Reprinted with permission from Ref.[287]) . 105
xix
Figure 44. XRD patterns of (a) (i) zein50, (ii) zein50/α-CD10, (iii) zein50/α-CD25, (iv) zein50/α-CD50 and (v) α-CD ; (b) (i) zein50, (ii) CD10, (iii) zein50/β-CD25, (iv) zein50/β-CD50 and (v) β-CD ; (c) (i) zein50, (ii) zein50/γ-CD10, (iii) zein50/γ-CD25, (iv) zein50/γ-CD50 and (v) γ-CD. (Copyright © 2012, Elsevier. Reprinted with permission from Ref.[287]) ... 108
Figure 45. ATR-FTIR spectra of electrospun nanofibers of (a1) (i) zein50, (ii) zein50/α-CD10, (iii) zein50/α-CD25 and (iv) zein50/α-CD50, (a2) (i) zein50, (ii) zein50/β-CD10, (iii) zein50/β-CD25 and (iv) zein50/β-CD50, (a3) (i) zein50, (ii) zein50/γ-CD10, (iii) zein50/γ-CD25 and (iv) zein50/γ-CD50; (b) Overlay of XPS C1s spectra of the zein, zein/β-CD nanofibers and pure β-CD. (Copyright © 2012, Elsevier. Reprinted with permission from Ref.[287]) ... 112
Figure 46. (a1) DSC thermograms of electrospun nanofibers, and (a2) Magnified views of Tg values of (i) zein50, (ii) zein50/β-CD10, (iii) zein50/β-CD25 and (iv) zein50/CD50; (b) TGA thermograms of zein50, zein50/CD nanofibers and β-CD. (Copyright © 2012, Elsevier. Reprinted with permission from Ref.[287]) ... 116
Figure 47. Representative SEM images of electrospun nanofibers from the solutions of (a) nylon 6,6, (b) nylon 6,6/α-CD25, (c) nylon 6,6/β-CD25, (d) nylon 6,6/γ-CD25, (e) nylon 6,6/α-CD50, (f) nylon 6,6/β-CD50, (g) nylon 6,6/γ-CD50. ... 121 Figure 48. XRD patterns of (a) as-received CD and (b) the electrospun nanofibers. ... 123
Figure 49. TGA and derivative TGA thermograms of as-received α-CD and the electrospun nanofibers. ... 125
Figure 50. ATR-FTIR spectra of the as received CD, electrospun nylon 6,6 and nylon 6,6/CD nanofibers. Enlarged region of these spectra are given at left side (between 3700 and 3000 cm-1) and right side (between 1100 and 960 cm-1). ... 127
Figure 51. Core-level XPS spectra of O 1s from the nanofibers. ... 129
Figure 52. The amount of entrapped toluene (ppm) by the electrospun nanofibers. 130
Figure 53. Schematic representation of entrapment of toluene through complexation with fiber surface associated CD... 131
xx
Figure 54. Side and top view of optimized structures of single toluene and (a) α- (b) β- (c) γ- CD-IC (1:1). Gray, red, and yellow spheres represent carbon, oxygen, and hydrogen atoms, respectively. ... 133
Figure 55. Side and top view of optimized structures of two toluene molecules and (a) α- (b) β- (c) γ- CD-IC (2:1). Gray, red, and yellow spheres represent carbon, oxygen, and hydrogen atoms, respectively. ... 134
Figure 56. Representative SEM images and fiber diameter distributions of electrospun nanowebs from the solutions of (a and b) PET at concentrations of 20% and 22.5% (w/v), (c) PET/α-CD, (d) PET/β-CD, (e) PET/γ-CD. (Copyright © 2014 Society of Plastics Engineers. Reprinted with permission from Ref.[271]) ... 140
Figure 57. XRD patterns of as-received CD and the electrospun nanofibers. (Copyright © 2014 Society of Plastics Engineers. Reprinted with permission from Ref.[271]) ... 142
Figure 58. FTIR spectra of the electrospun nanofibers, and overlay of these spectra in the enlarged region (right side). (Copyright © 2014 Society of Plastics Engineers. Reprinted with permission from Ref.[271]) ... 143
Figure 59. TGA thermograms of the electrospun nanofibers. (Copyright © 2014 Society of Plastics Engineers. Reprinted with permission from Ref.[271]) ... 144
Figure 60. O 1s high resolution XPS scans of electrospun nanofibers of PET and PET/γ-CD. (Copyright © 2014 Society of Plastics Engineers. Reprinted with permission from Ref.[271]) ... 146
Figure 61. The amount of entrapped aniline (ppm) by the electrospun nanofibers. (Copyright © 2014 Society of Plastics Engineers. Reprinted with permission from Ref.[271]) ... 148
Figure 62. Schematic representations of formation of aniline/CD-IC on the surface of the nanofibers. (Copyright © 2014 Society of Plastics Engineers. Reprinted with permission from Ref.[271]) ... 149
Figure 63. Schematic representations of (a) electrospinning of PET nanofibers, (b) formation mechanism of CDP and; (c) the representative photograph of PET/CDP
xxi
nanofibrous mat and its SEM image and schematic representation of PET/CDP nanofibers. (Copyright © 2013, Elsevier. Reprinted with permission from Ref.[299]) ... 154
Figure 64. Representative SEM images and AFD of (a) PET, (b) PET/α-CDP, (c) PET/β-CDP, (d) PET/γ-CDP nanofibers. The insets show higher magnification images. (Copyright © 2013, Elsevier. Reprinted with permission from Ref.[299]) 155 Figure 65. High resolution O 1s XPS spectra of PET and PET/γ-CDP nanofibers. (Copyright © 2013, Elsevier. Reprinted with permission from Ref.[299]) ... 158 Figure 66. (a) TGA thermograms of CTR and three CD types (α-CD, β-CD and γ-CD), (b) TGA and derivative (inset) TGA thermograms of nanofibers. (Copyright © 2013, Elsevier. Reprinted with permission from Ref.[299]) ... 159 Figure 67. DMA thermograms of nanofibrous mats (a) storage modulus, (b) tan δ. (Copyright © 2013, Elsevier. Reprinted with permission from Ref.[299]) ... 160
Figure 68. Time-dependent decrease of phenanthrene concentration in the aqueous solution containing nanofibrous mats. (Copyright © 2013, Elsevier. Reprinted with permission from Ref.[299]) ... 162
Figure 69. Representative SEM images of (a) PET, (b) PET/α-CDP, (c) PET/β-CDP and (d) PET/γ-CDP nanofibers after the filtration test. The insets show higher magnification images. (Copyright © 2013, Elsevier. Reprinted with permission from Ref.[299]) ... 164
Figure 70. Schematic representations of the processing steps for the production of polymer-inorganic nanofibers: (a) electrospinning, (b) ALD.(Copyright © 2013, Royal Society of Chemistry. Reproduced with permission from Ref.[130]) ... 167
Figure 71. Schematic representation of the formation process of core-shell polymer-inorganic nanofibers: preparation of the polymeric nanofiber by electrospinning and conformal inorganic shell deposition on the electrospun nanofiber via ALD. (Copyright © 2012, American Chemical Society. Reproduced with permission from Ref.[11]) ... 175
xxii
Figure 72. Representative SEM images of (a1) 8%-nylon 6,6/FA, (a2) 5%-nylon 6,6/HFIP, (a3) 8%-nylon 6,6/HFIP nanofibers; and (b1) 8%-nylon 6,6/FA-ZnO, (b2) 5%-nylon 6,6/HFIP-ZnO, (b3) 8%-nylon 6,6/HFIP-ZnO core-shell nanofibers. The insets show higher magnification images. (Copyright © 2012, American Chemical Society. Reprinted with permission from Ref.[11]) ... 176
Figure 73. EDX spectrum of nylon 6,6-ZnO core-shell nanofibers (8%-nylon 6,6/HFIP-ZnO NF) and chemical maps of C, Zn and O. (Copyright © 2012, American Chemical Society. Reprinted with permission from Ref.[11]) ... 179
Figure 74. Representative TEM images of (a) 8%-nylon 6,6/FA-ZnO, (b) 5%-nylon 6,6/HFIP-ZnO, (c) 8%-nylon 6,6/HFIP-ZnO core-shell nanofibers; (d) represantative SAED pattern of the core-shell nylon6,6-ZnO nanofibers (8%-nylon 6,6/HFIP-ZnO NF). (Copyright © 2012, American Chemical Society. Reprinted with permission from Ref.[11]) ... 180
Figure 75. Zn 2p high resolution XPS scan of core-shell nylon 6,6-ZnO nanofibers (8%-nylon 6,6/FA-ZnO NF). (Copyright © 2012, American Chemical Society. Reprinted with permission from Ref.[11]) ... 182
Figure 76. TGA thermograms of pristine nylon 6,6 nanofibers (NF) and core-shell nylon 6,6-ZnO NF. (Copyright © 2012, American Chemical Society. Reprinted with permission from Ref.[11]) ... 183
Figure 77. XRD patterns of pristine nylon 6,6 nanofibers (NF) and core-shell nylon 6,6-ZnO NF. (Copyright © 2012, American Chemical Society. Reprinted with permission from Ref.[11]) ... 185
Figure 78. (a) UV–Vis spectra of the Rh-B solution with and without core-shell nylon 6,6-ZnO nanofibers (NF) as a function of the UV irradiation time for 1st cycle experiment, (b) the rate (C/C0) of Rh-B degradation of the Rh-B solution with and
without core-shell nylon 6,6-ZnO NF by exposing UV light with 365 nm wavelength for 1st and 2nd cycle experiments; (c) representative photographs of the flexible nylon 6,6-ZnO core-shell NF before UV treatment and after 2nd cycle of UV treatment. . 187 Figure 79. Representative SEM images of (a) nylon 6,6/FA-ZnO and (b) 8%-nylon 6,6/HFIP-ZnO core-shell nanofibers after 16 h of UV irradiation in Rh-B
xxiii
solution (1st cycle). (Copyright © 2012, American Chemical Society. Reprinted with permission from Ref.[11]) ... 188
Figure 80. Schematic representation of the formation process of polymer/ZnO nanofibers: electrospinning of the polymeric nanofiber and ZnO deposition with different morphologies on the electrospun nanofiber by using various ALD parameters. (Copyright © 2013, Royal Society of Chemistry. Reprinted with permission from Ref.[130]) ... 194
Figure 81. SEM images of nanofibers; (a) pristine nylon, (b) nylon/ZnO NP, (c) nylon/ZnO NP (highly dense), and (d) nylon/ZnO nanocoating. (Copyright © 2013, Royal Society of Chemistry. Reprinted with permission from Ref.[130]) ... 195
Figure 82. Representative TEM images of nanofibers; (a) nylon/ZnO NP, (b) nylon/ZnO NP (highly dense), and (c) nylon/ZnO nanocoating. (Copyright © 2013, Royal Society of Chemistry. Reprinted with permission from Ref.[130]) ... 196
Figure 83. SAED patterns of nanofibers; (a) nylon/ZnO NP, (b) nylon/ZnO NP (highly dense), and (c) nylon/ZnO nanocoating. (Copyright © 2013, Royal Society of Chemistry. Reprinted with permission from Ref.[130]) ... 198
Figure 84. XRD patterns of pristine nylon and nylon/ZnO nanofibers. (Copyright © 2013, Royal Society of Chemistry. Reprinted with permission from Ref.[130]) .... 198
Figure 85. Zn 2p high resolution XPS scan of nanofibers of nylon/ZnO nanocoating. (Copyright © 2013, Royal Society of Chemistry. Reprinted with permission from Ref.[130]) ... 200
Figure 86. TGA thermograms of nylon and nylon/ZnO nanofibers. (Copyright © 2013, Royal Society of Chemistry. Reprinted with permission from Ref.[130]) .... 200
Figure 87. The rate (C/C0) of Rh-B degradation with and without nylon/ZnO
nanofibers by exposing UV light with 365 nm wavelength; representative photographs of flexible nylon/ZnO NP (highly dense) nanofibrous membrane and change of color of the Rh-B solution with this membrane as a function of the UV irradiation time. (Copyright © 2013, Royal Society of Chemistry. Reprinted with permission from Ref.[130]) ... 202
xxiv
Figure 88. Schematic representations of the fabrication process of hierarchical PAN/ZnO needle nanofiber. (Copyright © 2014, Elsevier. Reproduced with permission from Ref.[157]) ... 207
Figure 89. Representative SEM images of (a1-2) pristine PAN, (b1-2) PAN/ZnO seed, and (c1-2) PAN/ZnO needle nanofibers at different magnifications. (Copyright © 2014, Elsevier. Reprinted with permission from Ref.[157]) ... 209
Figure 90. Representative (a1) TEM image and (a2) SAED pattern of PAN/ZnO seed nanofibers; (b1) HRTEM image and (b2) FFT image of ZnO needle. (Copyright © 2014, Elsevier. Reprinted with permission from Ref.[157]) ... 211
Figure 91. (Left panel) EDX spectrum of PAN/ZnO seed nanofibers, (right panel) quantification of the spectrum shown in the left panel. (Copyright © 2014, Elsevier. Reprinted with permission from Ref.[157]) ... 211
Figure 92. (a) XRD patterns of nanofibers of PAN, PAN/ZnO seed and PAN/ZnO needle, and (b) magnified XRD patterns in the range of 31-37.5°. (Copyright © 2014, Elsevier. Reprinted with permission from Ref.[157]) ... 214
Figure 93. Peak deconvolution of core-level XPS spectra of O1s from PAN/ZnO seed and PAN/ZnO needle samples. The spectral location of the peaks are annotated on the image. (Copyright © 2014, Elsevier. Reprinted with permission from Ref.[157]) ... 216
Figure 94. Valence band XPS spectra for PAN/ZnO seed and PAN/ZnO needle nanofibers. (Copyright © 2014, Elsevier. Reprinted with permission from Ref.[157]) ... 216
Figure 95. (a) PL spectra of PAN/ZnO seed and needle counterpart and (b) depicts various crystal defects and possible transitions. (Copyright © 2014, Elsevier. Reprinted with permission from Ref.[157]) ... 217
Figure 96. (a) Degradation rate of MB in aqueous environment tested for pristine, in the presence of PAN nanofibers, PAN/ZnO seed and PAN/ZnO needle (1st cycle) cases, (b) plausible mechanism of photocatalysis involving oxygen vacancies, where (i) and (ii) stand for processes acceptor → acceptor▬ and donor → donor+
xxv
respectively, and (c) PCA of PAN/ZnO needle nanofibers for 1st, 2nd and 3rd cycles. (Copyright © 2014, Elsevier. Reprinted with permission from Ref.[157]) ... 220
Figure 97. The photographs of the MB solutions with/without nanofibrous web in certain UV irradiation time (1st cycle). (Copyright © 2014, Elsevier. Reprinted with permission from Ref.[157]) ... 223
Figure 98. Representative SEM images of (a) PAN/ZnO seed and (b) PAN/ZnO needle nanofibers after the 1st cycle of UV irradiation in MB solutions; (c) PAN/ZnO needle nanofibers after the 3rd cycle of UV irradiation in MB solution. (Copyright © 2014, Elsevier. Reprinted with permission from Ref.[157]) ... 225
Figure 99. Representative photograph of the PAN-ZnO needle nanofibers showing the easiness in handling. (Copyright © 2014, Elsevier. Reprinted with permission from Ref.[157]) ... 227
Figure 100. Schematic of (a) electrospinnig, (b) ALD and (c) the resultant morphology of the samples obtained applying different ALD cycle numbers. (Copyright © 2014, Royal Society of Chemistry. Reprinted with permission from Ref.[365]) ... 231
Figure 101. SEM images of electrospun fibers of (a) pristine PSU, (b) PZ1 QD, (c) PZ2 NC, (d) PZ3 NC, (e) PZ4 NC and (f) average fiber diameters. (Copyright © 2014, Royal Society of Chemistry. Reprinted with permission from Ref.[365]) .... 232
Figure 102. TEM images of (a) PZ1 QD, (b) PZ2 NC, (c) PZ3 NC and (d) PZ4 NC; (e) high resolution images and electron diffraction pattern from PZ4 NC. (Copyright © 2014, Royal Society of Chemistry. Reprinted with permission from Ref.[365]) 233
Figure 103. Particle size analysis from TEM image for PZ1 QD. (Copyright © 2014, Royal Society of Chemistry. Reprinted with permission from Ref.[365]) ... 234
Figure 104. The thickness of ZnO as a function of ALD cycle numbers for two contexts, namely, PSU-ZnO fibers and ZnO coating on silicon wafer. (Copyright © 2014, Royal Society of Chemistry. Reprinted with permission from Ref.[365]) .... 234
xxvi
Figure 105. XRD patterns from PZ1 D, PZ2 NC, PZ3 NC, and PZ4 NC within (a) 30-38 and (b) 45-90 regions. (Copyright © 2014, Royal Society of Chemistry. Reprinted with permission from Ref.[365]) ... 236
Figure 106. XRD patterns for pristine and ZnO coated samples within the region of ~10-30 . (Copyright © 2014, Royal Society of Chemistry. Reprinted with permission from Ref.[365]) ... 237
Figure 107. Core-level XPS analysis for O 1s from PSU, PZ1 QD, PZ2 NC, PZ3 NC and PZ4 NC samples. The area under the shaded peak corresponding to chemisorbed oxygen (OCh) is annotated on the image in the units of eV·cps. (Copyright © 2014, Royal Society of Chemistry. Reprinted with permission from Ref.[365]) ... 238
Figure 108. Core-level XPS analysis for Zn 2p from PZ1 QD, PZ2 NC, PZ3 NC and PZ4 NC samples. (Copyright © 2014, Royal Society of Chemistry. Reprinted with permission from Ref.[365]) ... 240
Figure 109. (a) Luminescence spectra from electrospun fibers of PSU and PZ1 QD, PZ2 NC, PZ3 NC, and PZ4 NC. (b) Schematic diagram depicting the various defects and the ascribed transition. (Copyright © 2014, Royal Society of Chemistry. Reprinted with permission from Ref.[365]) ... 243
Figure 110. Emission spectra from pure polysulfone electrospun nanofibers for three different excitations. (Copyright © 2014, Royal Society of Chemistry. Reprinted with permission from Ref.[365])... 246
Figure 111. TGA of PSU-ZnO samples compared with pristine case. (Copyright © 2014, Royal Society of Chemistry. Reprinted with permission from Ref.[365]) .... 247
Figure 112. (a) PCA of various samples compared with pristine PSU and no catalyst cases, (b) densities of various defects and (c) improvement in decay constant are referenced with PZ1 QD case and shown in percentage. (Copyright © 2014, Royal Society of Chemistry. Reprinted with permission from Ref.[365]) ... 250
Figure 113. Digital photographs showing the convenience in handling the ZnO coated fiber mats. (Copyright © 2014, Royal Society of Chemistry. Reprinted with permission from Ref.[365]) ... 251
xxvii
Figure 114. PCA of the resulting nanofibers depend on their morphology and defect type. (Copyright © 2014, Royal Society of Chemistry. Reprinted with permission from Ref.[365]) ... 252
Figure 115. Schematic diagram depicting the fabrication of core-shell structured heterojunction nanofibers. Dy.Vac and St.Vac stand for dynamic and static vacuum conditions, respectively. (Copyright © 2014, Royal Society of Chemistry. Reprinted with permission from Ref.[153])... 256
Figure 116. Representative SEM images of (a) PVP-ZnAc-TiO2, (b) PVP-TTIP-ZnO,
(c) ZnO-TiO2 and (d) TiO2-ZnO core-shell heterojunction nanofibers. (Copyright ©
2014, Royal Society of Chemistry. Reprinted with permission from Ref.[153]) .... 257
Figure 117. SEM image of TiO2-ZnO core-shell heterojunction nanofibers depicting
the rough surface. (Copyright © 2014, Royal Society of Chemistry. Reprinted with permission from Ref.[153]) ... 258
Figure 118. Representative TEM images of core-shell heterojunction nanofibers (a) ZnO-TiO2, (b) TiO2-ZnO; (c) and (d) HRTEM images of the ‘shell’ regions of (a)
and (b), respectively. (Copyright © 2014, Royal Society of Chemistry. Reprinted with permission from Ref.[153])... 259
Figure 119. EDX spectra of core-shell heterojunction ZnO-TiO2 and TiO2-ZnO
nanofibers. (Copyright © 2014, Royal Society of Chemistry. Reprinted with permission from Ref.[153]) ... 259
Figure 120. XRD patterns of core-shell heterojunction nanofibers within the 2θ range of 20-100˚ (a) ZnO-TiO2 and (b) TiO2-ZnO. Standard reflections for TiO2 (anatase &
rutile) and ZnO are annotated. * represents the peaks from aluminium oxide. (Copyright © 2014, Royal Society of Chemistry. Reprinted with permission from Ref.[153]) ... 261
Figure 121. Core-level XPS spectra of core-shell heterojunction nanofibers (a) Ti 2p region for ZnO-TiO2 and (b) Zn 2p region for TiO2-ZnO. (Copyright © 2014, Royal
xxviii
Figure 122. Core-level XPS spectra of O 1s from ZnO-TiO2 and TiO2-ZnO core-shell
heterojunction nanofibers with peak deconvolution. The spectral locations of the peaks are annotated on the image, where the major peak corresponds to the oxygen in the shell material and the minor peak to chemisorbed oxygen. (Copyright © 2014, Royal Society of Chemistry. Reprinted with permission from Ref.[153]) ... 263
Figure 123. Valance band XPS spectra of core-shell heterojunction nanofibers (a) ZnO-TiO2 and (b) TiO2-ZnO. (Copyright © 2014, Royal Society of Chemistry.
Reprinted with permission from Ref.[153]) ... 264
Figure 124. Photoluminescence spectra of ZnO-TiO2 and TiO2-ZnO core-shell
heterojunction nanofibers. (Copyright © 2014, Royal Society of Chemistry. Reprinted with permission from Ref.[153]) ... 265
Figure 125. PCA of the ZnO-TiO2 and ZnO-TiO2 core-shell heterojunction
nanofibers. Exponential decay fits and constants are shown when compared with the pristine methylene blue (MB) without any catalyst. (Copyright © 2014, Royal Society of Chemistry. Reprinted with permission from Ref.[153]) ... 269
Figure 126. Proposed catalysis mechanism, where either electrons from the TiO2 or holes from the ZnO are engaged from the ZnO-TiO2 (left panel)and TiO2-ZnO (right
panel)core-shell heterojunction nanofibers. ecptr and hcptr stand for electron and hole
capture, respectively. (Copyright © 2014, Royal Society of Chemistry. Reprinted with permission from Ref.[153])... 271
Figure 127. PCA mechanism for CSHJ nanofibers. (Copyright © 2014, Royal Society of Chemistry. Reprinted with permission from Ref.[153]) ... 274
Figure 128. Outside Front Cover of Nanoscale belong to our paper. (Copyright © 2014, Royal Society of Chemistry. Reprinted with permission from Ref.[153]) .... 274
xxix
LIST OF TABLES
Table 1. Main properties of α-CD, β-CD, and γ-CD. ... 8
Table 2. Corrected peak areasa calculated at 8.76 min from headspace GC-MS chromatograms for vanillin/CD-IC and vanillin/CD physical mixtures agitated at different incubation temperatures. (Copyright © 2011, American Chemical Society. Reprinted with permission from Ref. [70]) ... 35
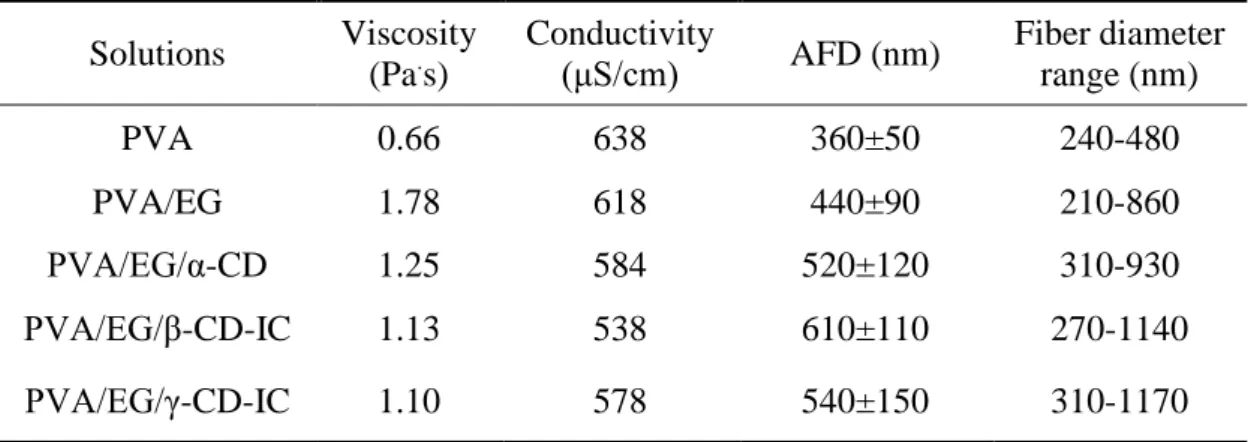
Table 3. The solution properties and AFD of the resulting electrospun nanofibers. (Copyright © 2012, Elsevier. Reprinted with permission from Ref.[202]) ... 40
Table 4. Initial amount of vanillin in the solutions and remaining amount of vanillin in the nanowebs after certain days obtained by TGA and NMR results. (Copyright © 2012, Elsevier. Reprinted with permission from Ref.[202]) ... 47
Table 5. The properties of the solutions used for electrospinning and morphological characteristics of the resulting electrospun nanofibers. ... 55
Table 6. The compositions and viscosity of the solutions used for electrospinning and morphological characteristics of the electrospun nanofibers. ... 76
Table 7. The solution viscosity, fiber diameter and inhibition zone results taken after 24 h incubation at 37 °C against E. coli and S. aureus bacteria for PLA/TR, PLA/TR/β-CD-IC and PLA/TR/γ-CD-IC. ... 91 Table 8. Properties of zein and zein/CD solutions and the resulting zein and zein/CD nanofibers. ... 103
Table 9. Atomic concentrations generated from XPS wide energy survey scans. (Copyright © 2012, Elsevier. Reprinted with permission from Ref.[287]) ... 115
Table 10. Properties of nylon 6,6 and nylon 6,6/CD solutions and the resulting nylon and nylon/CD nanofibers. ... 122
Table 11. Atomic concentrations generated from XPS wide energy survey scans. . 129
Table 12. Properties of PET and PET/CD solutions and the average fiber diameters and morphological characteristics of the resulting electrospun nanofibers. ... 141
xxx
Table 13. Atomic concentrations generated from XPS wide energy survey scans. (Copyright © 2014 Society of Plastics Engineers. Reprinted with permission from Ref.[271]) ... 145
Table 14. Summary of the mechanical properties of electrospun nanofibers. (Copyright © 2014 Society of Plastics Engineers. Reprinted with permission from Ref.[271]) ... 147
Table 15. Atomic concentrations generated from XPS wide energy survey scans. (Copyright © 2013, Elsevier. Reprinted with permission from Ref.[299]) ... 157 Table 16. Fitting parameters of the O 1s XPS spectra of PET and PET/γ-CDP nanofibers. (Copyright © 2013, Elsevier. Reprinted with permission from Ref.[299]) ... 158
Table 17. Surface area, pore size and volume data of the nanofibers. (Copyright © 2013, Elsevier. Reprinted with permission from Ref.[299]) ... 161
Table 18. Properties of nylon 6,6 solutions and the resulting electrospun nanofibers. (Copyright © 2012, American Chemical Society. Reproduced with permission from Ref.[11]) ... 177
Table 19. Atomic concentrations generated from XPS wide energy survey scans. (Copyright © 2012, American Chemical Society. Reprinted with permission from Ref.[11]) ... 182
Table 20. Atomic concentrations generated from XPS wide energy survey scans. (Copyright © 2013, Royal Society of Chemistry. Reprinted with permission from Ref.[130]) ... 199
Table 21. XRD characteristics of three selected peaks (Copyright © 2014, Royal Society of Chemistry. Reprinted with permission from Ref.[365]) ... 236
Table 22. Spectral locations of deconvoluted peaks and ascribed emission mechanism. The wavelength of the emission is given in nm, and eV for convenience. ... 245
1
CHAPTER 1
1. INTRODUCTION
1.1. Electrospinning
One-dimensional nanostructures such as nanofibers have distinctive properties which can offer good opportunities for developing advanced materials and devices [1-3]. Among the other nanofiber fabrication methods (drawing, template synthesis, phase separation, self-assembly), electrospinning has gained growing interest in the past decade, since this technique is quite versatile and cost-effective for producing functional nanofibers from variety of materials including synthetic or natural polymers, polymer blends, emulsions, suspensions, sol-gels, metal oxides, composite structures as well as non-polymeric systems, etc.[1-2, 4-10].
Basic electrospinning set-up has three main components; syringe pump, high voltage power supply and collector which is schematically shown in Figure 1. Electrospinning unit at UNAM is also given in Figure 2. In electrospinning process, the fluid (mostly polymer solution) in a syringe is pumped through a thin nozzle that serves as an electrode to which a high voltage is applied [1, 6-7]. A drop is formed on the tip of the nozzle due to surface tension of a fluid. When repulsive force induced by the charge distribution on the surface of the drop overcomes surface tension of the liquid, a fluid jet erupts from the droplet at the tip of the nozzle
2
resulting in the deformation of the liquid drop into a conical shape named as Taylor cone [1, 7]. During the movement of the liquid jet to the region of lower potential which in most cases, is a grounded collector, the solvent evaporates and solid fibers with diameter ranges from microns down to a few tens of nanometers are collected on the counter collector [1, 7].
Figure 1. Schematic view of electrospinning. (Copyright © 2012, American Chemical Society. Reprinted with permission from Ref.[11])
Figure 2. Electrospinning unit at UNAM. 15 kV
high voltage power supply
syringe pump
fluid
(polymer solution) collector
nanofibers
High voltage power supply
Collector Syringe pump
3
By electrospinning, we can produce nanofibers that are one thousand times thinner than a human hair (see scanning electron microscope (SEM) image in Figure 3). The parameters that influence the morphology of the resultant electrospun fibers with their diameters may be broadly classified into polymer/solution parameters, processing conditions (applied voltage, distance between tip of the nozzle and collector, internal diameter of the needle, feeding rate for the fluid, type of collector) and ambient conditions (humidity, temperature, type of atmosphere and pressure) [1, 7, 12]. Among these polymer/solution parameters which include type of polymer (molecular weight, conformation of polymer chain), viscosity, conductivity and surface tension of the solution, polarity and dielectric effect of solvent have the most significant influence. It is possible to fabricate nanofibers with various morphology (beaded fibers, bead-free fibers) and different fiber diameters by varying these parameters.
Figure 3. The SEM image of the nylon 6,6 nanofibers collected on a human hair.
We obtained polybutylene terephthalate (PBT) nanofibers from different concentration of PBT solutions using trifluoroacetic acid (TFA) as a solvent to find optimal concentration for bead-free fibers. In order to show the effect of concentration of polymer solution on the morphology and diameter of nanofibers the SEM images with average fiber diameter (AFD) of these electrospun PBT nanofibers are given in Figure 4. If the concentration is high enough, bead structures are eliminated and bead-free and uniform nanofibers can be obtained due to required
Hair
Nanofibers
4
level of viscosity. In general, thicker fibers are obtained from more concentrated solutions resulting in less stretching of the electrified jet.
Figure 4. SEM images with AFD of the electrospun nanofibers obtained from different concentration of PBT solutions in TFA (a) 5%, (b) 8% and (c) 12.5% (w/v).
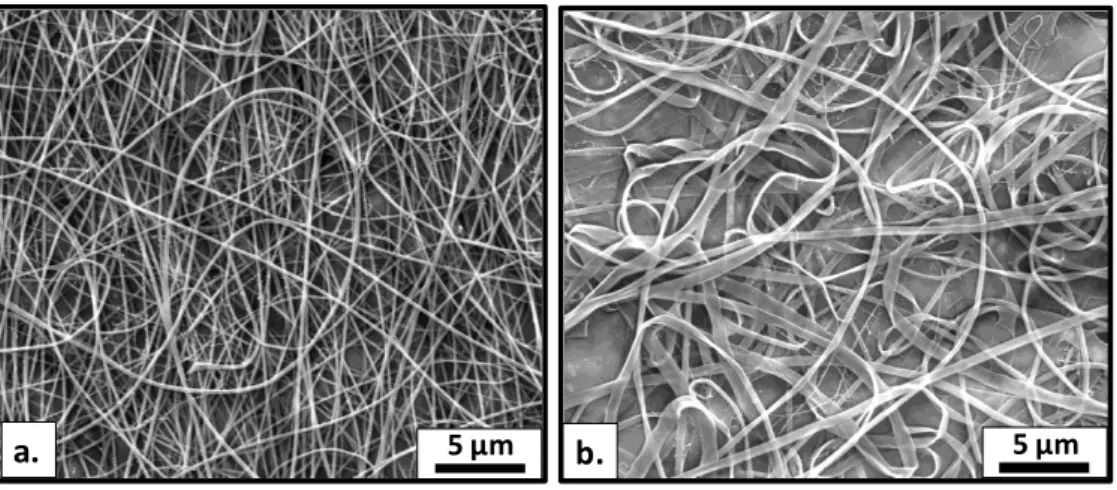
Although electrospun fibers are commonly circular in cross section, other shapes, in particular ribbon-like structures can be obtained [12]. We obtained nylon 6,6 nanofibers having both round and ribbon-like morphology by using different polymer concentration in formic acid (see Figure 5). Therefore, the formation ribbon-like morphology from the more concentrated solution is possibly due to collapse of the skin on the surface of liquid jet during rapid evaporation of solvent.
AFD: 40 20 nm
AFD: 70 55 nm
AFD: 160 85 nm
a.
5 μm
b.
5 μm
5
Figure 5. SEM images of electrospun nanofibers obtained from different concentration of nylon 6,6 solutions in formic acid (a) 10% and (b) 15% (w/v).
Electrospun nanofibers and their nanofibrous webs have remarkable characteristics including a very high specific surface area, pore sizes within the nanoscale and very light weight. Moreover, the control of the fiber surface morphology, fiber orientation and cross sectional configuration, and design flexibility for physical/chemical modification either during electrospinning or post-processing is quite feasible for obtaining multifunctional electrospun nanofibers. Therefore, the properties of electrospun nanofibers can be improved by incorporating functional additives and/or nanoparticles into the fiber matrix and/or onto fiber surface [6-7, 10, 12-20]. Due to their exceptional properties, it has been shown that electrospun nanofibers/nanowebs have potentials for various applications in the field of functional textiles [6], biomedical (wound dressing, tissue engineering, drug delivery) [1-2, 4, 6-7, 21], nanocomposites [1-2, 6-8, 22], energy (solar cells, fuel cells, supercapacitors, hydrogen storage, optoelectronics, transistors) [1-2, 6-7, 23], sensor [1-2, 6-7, 24], immobilization of catalysts/enzymes [6, 24] and environment [1-2, 6-7, 23, 25].
Electrospun nanofibers and their nanowebs have also shown some potential in biotechnology, controlled/sustained release systems and active food packaging due to their exceptionally large surface area and high encapsulation efficiency that can be effective for the stabilization of active agents. Electrospun nanofibers from biodegradable [26-28] or edible [29] polymers has received great attention in
6
functional food and active food packaging systems, recently. Moreover, food related applications and food packaging application were investigated for electrospun nanofibers based on food grade materials [30-31] and/or nanofibers incorporating active agents such as antibacterials [32-35], antioxidants [36-38], essential oils [33] or even probiotics [39]. Development of nanocomposite fabrics with the functional electrospun nanofibers that can supply antimicrobial protection or delivery of nutraceuticals to foods could improve the performance for bioactive packaging applications [40]. In Chapter 2, the development of electrospun nanofibers using cyclodextrin inclusion complexes (CD-IC) is reported in which these functional nanofibers can be applicable in the fields of biotechnology, controlled/sustained release systems and especially active food packaging. The resulting cyclodextrin functionalized electrospun zein nanofibers mentioned in the second part of Chapter 3 (3.2) may be also useful for food packaging application.
Moreover, It has been reported that functional electrospun nanofibrous materials can be easily obtained in the form of nonwoven membranes which can be readily used as a filtering material for particulate separation [25, 41], liquid filtration [25, 41-42], air filtration [23, 41, 43-53], waste vapor treatment [52, 54] as well as desalination [55] due to their high surface-to-volume ratio and nanoporous structure, high permeability, low basis weight. In addition, the design flexibility of electrospun nanofibers for specific surface functionality can yield better adsorptive capacity and selective separation performance [56-57]. More efficient and energy saving innovative membrane materials are very demanding for removal of volatile organic compounds, chemical and biological pollutants, warfare contaminants and toxic agents from air, water and surroundings [23, 44-45, 48, 50-53]. In Chapter 3, there is an overview of the researches in which we obtained multifunctional nanofibrous materials using cyclodextrins (CD; see the second part of Chapter 1 (1.2)) to promote their applicability in filtration. In the research studies mentioned in Chapter 4, the surface of the electrospun nanofibers was coated with nanostructures of metal oxides (ZnO, TiO2) to achieve the photo degradation of organic contaminants in the aqueous
solutions. Photocatalytic activity (PCA) of metal oxides is explained in detail in the third part of Chapter 1 (1.3).
7
1.2. Cyclodextrins
Cyclodextrins (CD) that are non-toxic cyclic oligosaccharides consisting of α(1,4)-linked glucopyranose units, are produced by the enzymatic (glocosyl transferase enzyme) degradation of starch [58-61]. There are three most commonly used native CD types; α-CD, β-CD, and γ-CD having 6, 7, and 8 glucopyranose units in their cyclic structure, respectively (Figure 6a) [58-60]. The depth of the cavity for these three CD having truncated cone shaped molecular structure is same which is ~8 Å, whereas the internal diameter of the cavity is different for α-CD, β-CD, and γ-CD, being ~6, 8 and 10 Å, respectively (Figure 6b) [58-60, 62].
Figure 6. (a) Chemical structures, (b) schematic representations with approximate dimensions of α-CD, β-CD, and γ-CD.
The main properties of α-CD, β-CD, and γ-CD are summarized in Table 1 [58]. The possible formation of hydrogen bond between C-2-OH group of one glucopyranose unit and C-3-OH group of the adjacent glucopyranose unit can affect the aqueous solubility of CD (see Table 1). β-CD has a rather rigid structure due to a
α-CD β-CD γ-CD
a.
b.
~0.95 nm ~0.57 nm ~0.78 nm ~ 0 .7 9 n m α-CD β-CD γ-CD8
complete secondary belt formed by these intramolecular hydrogen bonds; hence, it is the lowest water soluble among the three common CD [58]. On the other hand, the hydrogen belt is not complete in α-CD because of one glucopyranose unit having distorted position which resulting in only four fully established intramolecular hydrogen bonds instead of six; therefore, α-CD has a greater aqueous solubility compared to β-CD, but less than that of γ-CD having a non-coplanar and more flexible structure [58].
Table 1. Main properties of α-CD, β-CD, and γ-CD.
The primary hydroxyl groups of the glucose residues are located at the narrow edge of the cone, whereas the secondary hydroxyl groups are at the wider edge (see Figure 6b). While these hydroxyl groups are orientated to the cone exterior, skeletal carbons and ether oxygens of the glucose residues are situated in the central cavity [58-59]. CD have a relatively hydrophobic inner cavity and hydrophilic outer surface owing to this unique chemical structure [58-59]. The relatively hydrophobic cavities of CD have remarkable ability to form non-covalent host-guest inclusion complexes (IC) with a variety of molecules in appropriate polarity and dimension. Figure 7 illustrates schematic representation of formation of CD-IC with host CD and guest molecule.
Figure 7. Schematic representation of CD-IC formation.
guest molecule
CD CD-IC
Properties α-CD β-CD γ-CD
Number of glucopyranose units 6 7 8
Approximate cavity diameter (Å) 4.5-5.7 6.2-7.8 7.9-9.5 Approximate height of torus (Å) 7.9 7.9 7.9 Approximate cavity volume (Å3) 174 262 427
Molecular weight (g/mol) 972 1135 1297
9
The main driving force of the inclusion complexation is the replacement of enthalpy-rich water molecules inside the apolar CD cavity with hydrophobic guest molecule [59]. CD-IC can be formed in solution (water is the most commonly used solvent) efficiently compared to the formation in the crystalline state. While the repulsive interactions between the hydrophobic guest and the aqueous environment decrease, hydrophobic interactions (apolar- apolar association) increased as the guest inserts into the apolar CD cavity [59]. Thereby lower energy in system is achieved with the decrease of CD ring strain.
The soluble CD in the solvent are available for complexation. However, as the amount of water is further increased, the CD and the guest do not get in contact easily [59]. The most commonly used techniques to form CD-IC are dry mixing, paste, slurry, co-precipitation, low-temperature drying [59-60]. The quantities of water employed are different among these techniques. Dry mixing is not efficient method because of mixing times ranging from hours to days with no added water [59-60]. Using a minimum amount of water (20-30% w/w) resulting in high viscosity make paste method not useful in the laboratory [59-60]. In the slurry method, up to 50% w/w water is used. Because of large amount of water employed, the large scale formation of IC with co-precipitation method is not frequent. However, this method is widely used in the laboratory, since it demonstrates feasibility of complexation of a particular guest [59-60]. Precipitation is not possible for soluble complexes, so freeze-drying is especially useful for these samples [59-60].
CD are extensively used in many industries (see Figure 8) such as pharmaceutical and medical, agricultural, textile, cosmetic and home/personel care and mostly food, since CD can form IC with a variety of molecules including drugs [62], pesticides [63-64], textile auxiliaries [65-67] and volatile and/or unstable additives such as essential oils [61, 68], flavors [69-70], antioxidants [71-72], antibacterials [73-80]; and inclusion complexation can enhance stability (against to heat, light, oxygen), solubility, bioavailability, functionality and controlled/sustained release of these guest molecules. In Chapter 2, I reported our research studies on
10
functionalized electrospun nanofibers with CD-IC of different active agents, and thus development of CD applications in such areas.
Moreover CD can also be used in separations, purification and filtration purposes due to their unique property to selectively form IC with unpleasant odors, hazardous and polluting organic compounds [81-87]. CD functionalized electrospun nanofibers were developed to combine this capability of CD and high surface area and nanoporous structure of nanofibers, and these research studies were reported in Chapter 3.
Figure 8. Industrial applications of CD.
The formation and stability of the CD-IC depend on various factors including the size/shape fit, chemical surroundings, and binding forces (hydrophobic interactions, van der Waals attractions, hydrogen bonding, electrostatic interactions, etc.) between the host CD and guest molecules [88-90]. In our most studies in Chapter 2 and Chapter 3, the capability of different types of CD (α-CD, β-CD, and γ-CD) to form IC with the same guest molecule were comparable and the different stability have been found for some resulting CD-IC depending on CD type.