2018;20(1):11-15
Comparison of Pathological Indexes (Ki-67, p53), and Perfusion/Diffusion MR
Parameters in Glioma Staging
Gliom Evrelemesinde Patolojik İndekslerin (Ki-67, p53) ve Perfüzyon/Difüzyon MR
Parametrelerinin Karşılaştırılması
Gülhan ERTAN1*, Sıla ULUS2, Aslı ÇAKIR3
1Istanbul Medipol University Faculty of Medicine Department of Radiology, Istanbul 2Acibadem Mehmet Ali Aydınlar University School of Medicine Department of Radiology, Istanbul
3Istanbul Medipol University Faculty of Medicine Department of Pathology, Istanbul
ABSTRACT
Aim: In this study, we aim to determine the diffusion characteristics of grade II astrocytomas and glioblastomas (GBM), and to determine the ability of apparent diffusion coefficient (ADC), relative cerebral blood volume (rCBV), Ki-67, and p53 values for the preoperative stratification of these tumors.
Material and Methods: MRI scans of 24 patients who underwent surgery for brain tumors in our hospital between 2014 and 2017 with grade II diffuse astrocytoma or GBM were retrospectively reviewed. The ADC and rCBV values were measured from inside the tumor and from the normal white matter of symmetric contralateral hemisphere. Ki-67 and p53 values were recorded from the pathology reports. Perfusion weighted imaging, diffusion weighted imaging, Ki-67, and p53 values were analyzed for differences between low-grade and high-low-grade astrocytomas.
Results: In grade II astrocytomas, the ADC values significantly increased compared to contralateral normal hemisphere, while in GBMs they were slightly increased. The success of rCBV using a value of 2 in distinguishing high- and low-grade astrocytomas was statistically significant and 100% accurate. As the min ADC value declined in GBMs the p53 score increased. Similarly, the p53 score increased as the min ADC and the average ADC values of GBM in the contralateral normal white matter (WM) declined.
Conclusion: Utilizing an rCBV value of 2 to distinguish grade II from grade IV astrocytomas is superior to relying on ADC values to predict grade. The decline in the ADC values of GBM in the normal WM of contralateral hemisphere corroborates the notion of a diffuse neoplastic process.
Keywords: Astrocytoma; magnetic resonance imaging; perfusion weighted imaging; diffusion weighted imaging; p53 protein; Ki-67.
ÖZ
Amaç: Bu çalışmada amacımız, derece II astrositom ve glioblastomların (GBM) difüzyon karakteristiklerini belirlemek ve görünür difüzyon katsayısı (ADC), rölatif serebral kan hacmi (rCBV), Ki-67 ve p53 değerlerinin bu tümörlerin preoperatif sınıflanmasındaki yeterliklerini belirlemektir.
Gereç ve Yöntemler: 2014 ve 2017 yılları arasında derece II diffüz astrositom veya GBM nedeniyle hastanemizde ameliyat edilen 24 hastanın MRG bulguları retrospektif olarak incelendi. ADC ve rCBV değerleri tümörün içinden ve simetrik kontralateral normal beyaz hemisferden ölçüldü. Patoloji raporlarından Ki-67 ve p53 değerleri kaydedildi. Perfüzyon ağırlıklı görüntüleme, difüzyon ağırlıklı görüntüleme, Ki-67 ve p53 değerleri düşük dereceli ve yüksek dereceli astrositomlar arasındaki farklar açısından analiz edildi. Bulgular: Derece II astrositomlarda, ADC değerleri kontralateral normal hemisfer ile karşılaştırıldığında önemli ölçüde artmış, GBM'lerde ise hafif artmıştır. Yüksek ve düşük dereceli astrositomları ayırt etmek için eşik değerin 2 olarak kabul edildiği rCBV'nin başarısı istatistiksel olarak anlamlıdır ve %100 doğrudur. GBM'lerde min ADC değeri azaldıkça, p53 skoru artmıştır. Benzer şekilde, p53 skoru, kontralateral normal beyaz ak maddede minimum ADC ve GBM'nin ortalama ADC değerleri azaldıkça artmıştır.
Sonuç: Glioblastomları, derece II astrositomlardan ayırt etmek için rCBV değerini 2 kullanmak, dereceyi belirlemek için ADC değerlerine dayanmaktan daha üstündür. GBM'li hastalarda kontralateral hemisferin normal ak maddesindeki ADC değerlerinde görülen düşüş, yaygın bir neoplastik süreç düşüncesini desteklemektedir.
Anahtar kelimeler: Astrositom; manyetik rezonans görüntüleme; perfüzyon ağırlıklı görüntüleme; difüzyon ağırlıklı görüntüleme; p53 proteini; Ki-67.
Sorumlu Yazar / Corresponding Author: Gülhan Ertan, [email protected] Geliş Tarihi / Received: 16.08.2018 Kabul Tarihi / Accepted: 18.09.2018
INTRODUCTION
Gliomas are the most common primary neoplasms of the central nervous system. They have highly heterogeneous histopathology and disparate clinical progression. Grade I and II tumors are classified as low-grade; Grade III and IV tumors are classified as high-grade tumors in the World Health Organization (WHO) designations. Low-grade gliomas are a relatively poorly understood group. Some tumors of this group are diffusely infiltrative and can turn into high-grade gliomas, usually characterized as IDH wild type tumors. The conversion rate is quite variable, and it is often difficult to predict. The timing of surgery, radiotherapy and chemotherapy in the treatment of low-grade gliomas is variable and controversial due to many factors such as 1) the age of patient, 2) location of the tumor, 3) size of tumor, and 4) presence of symptoms. In high-grade tumors in appropriate locations, a more aggressive operation often combined with chemotherapy (CT) and radiation therapy (RT) treatment regimens is attempted. For this reason, it is important that histological grading of gliomas be correctly performed by non-invasive imaging techniques to plan an appropriate treatment strategy, and to be able to accurately predict prognosis (1,2). In addition to conventional MRI sequences, which give limited pathologic information, dynamic susceptibility contrast-enhanced (DSC) MR perfusion and diffusion-weighted MR imaging (DWI) are considered more useful in predicting histologic grade. DSC perfusion sequences assess regional cerebral hemodynamics by analyzing signal intensity changes during and after the first pass of the gadolinium contrast agent and DWI sequences provide apparent diffusion coefficient (ADC) values that can predict nuclear-cytoplasm ratios and cellularity in predicting tumor grade (3). Just like the tumor grade, tumor proliferation and genetic changes are also prognostic factors. Ki-67 is an indicator of proliferation. As the grade of astrocytomas increases, the percentage of Ki-67 expression in tissue increases (4,5). Changes in p53 pathway may occur in all astrocytic tumors. Studies show that p53 expression is also independently correlated with tumor grade and survival (6). Although there are studies in the literature comparing the perfusion and diffusion parameters of astrocytomas with Ki-67 or p53 values separately, there is no study evaluating all of these parameters together.
The aims of our study are to 1) determine diffusion characteristics of grade II astrocytomas and glioblastomas, and 2) determine the ability of apparent diffusion coefficient (ADC), cerebral blood volume (rCBV), Ki-67, and p53 values to preoperatively stratify low- and high-grade astrocytomas.
MATERIAL AND METHODS
The MRI scans of patients who underwent surgery for brain tumors in Istanbul Medipol University Hospital between January 2014 and June 2017 and who had grade II diffuse astrocytoma or grade IV GBM on pathology reports were retrospectively reviewed. Only those patients with diffusion-ADC and perfusion data were included in the study. The patients had not received any treatment before the surgery. Twenty four patients, 13 diagnosed with Grade II astrocytoma 53.8% (7/13) male, 46.2% (6/13) female; mean age 7.5±9.4 (8-37) and 11 diagnosed with GBM 72.7% (8/11) male, 27.3% (3/11) female; mean age 47.6±17.2 (16-68) who met the inclusion criteria were included in the study. The study was approved by the Istanbul Medipol University ethics committee (04.10.2017/388).
Imaging techniques
MR scans were acquired on 3T Achieva TX system (Philips Achieva TX, The Netherlands) with an 8 channel head coil. DWI sequence was performed using Single-shot SE echo-planar imaging with 3 gradient directions in the axial plane. Parameters were TR/TE: 3310/92 ms, section thickness: 5 mm, intersectional gap: 0 mm, FOV: 230x230 mm, and b-values: 0, 1000 s/mm2.
ADC mapping was generated automatically.
T2* DSC perfusion: The patients were given a contrast agent per 0.1 mmol/kg with an automatic syringe. T2* weighted multislice gradient echo (GRE), echo planar (EPI) sequence was used for
imaging. Sequence parameters for EPI were TR/TE: 2012/40 ms, FOV: 230x230 mm, section thickness: 5 mm, intersectional gap: 0 mm, matrix size: 152x105, and divergence angle: 75 degrees. Evaluation of Images
Conventional MRI scans, DWI, and perfusion MR images were retrospectively evaluated blinded to histopathological diagnosis. Tumor sizes, solid and cystic component presence, heterogeneity, peritumoral edema, contrast enhancement, hemorrhage, necrosis and mass effect were investigated on T1 and T2 weighted sections. Regions of interest (ROI) were manually drawn in ADC images and measurements were automatically made on workstations. The ROIs were placed on the lowest visual ADC location in the solid components of lesions. In all cases, the area of each ROI to measure was 30-50 mm (2). Cystic components, hemorrhages, and vascular structures were avoided. Three ROIs were taken at three consecutive sections. Minimum (min), maximum (max), and average ADC values were measured. The average values were recorded. ADC values were measured using the same method from white matter of the contralateral hemisphere in a similar location with normal appearance, symmetric in location to the tumor. T2* DSC perfusion images were evaluated at the workstation. A standardized ROI measuring approximately 30-50 mm2 was used. The rCBV was calculated by deconvolution of an arterial input function. White matter (WM) was taken as standard to measure the ratio of relative rCBV from solid tumor component and WM of contralateral hemisphere with normal appearance, symmetric to tumor. The highest rCBV value was measured from the solid portion of tumor on the axial plane. Similar to ADC, cystic components, hemorrhages, and vascular structures were avoided. Measurements were taken from an area (ROI) with the same magnitude in WM in an analogous location in the contralateral hemisphere.
Pathology (Ki-67 and p53)
Pathologic diagnosis was made according to WHO classification. The highest number of tumor cell nuclei stained positive for each case was recorded from pathology reports.
Statistical Analysis
Distribution of data was examined by Shapiro-Wilk test, and Independent samples t test was used to compare groups for data with normal distribution, while Mann-Whitney U test was used for data with non-normal distribution. Repeated Measures ANOVA test was applied to examine the changes of measurements taken from different hemispheres according to the groups. Spearman rho coefficients were calculated to analyze correlation between variables. Cut-off values to discriminate GBM were calculated by Receiver Operating Characteristic (ROC) Curve analysis. Statistical analyses were done with SPSS v.22 package and the level of significance was taken as 0.05. RESULTS
Patient demographics and conventional MRI findings are presented in Table 1.
Grade II Astrocytoma
All of the tumors were T2 hyperintense, homogeneous, and solidly infiltrating in appearance, of which 1/13 was accompanied by a cystic component, 4/13 by contrast enhancement, and 4/13 by peritumoral edema. There was a mass effect in 1/13 patient. Bleeding, necrosis, and calcification were not observed at all (Figure 1).
The three ADC values (minADC, maxADC, and average ADC) were significantly higher than the ADC values from the WM of the contralateral hemisphere (p=0.001 for each).
There was no significant correlation between Grade II tumor ADC values and tumor rCBV (p=0.348), Ki-67 (p=0.602), and p53 (p=0.840) values.
Glioblastoma
2/11 was accompanied by cystic component, 11/11 by contrast enhancement, 3/11 by bleeding, 10/11 by necrosis in tumor, and 11/11 by peritumoral edema. There was mass effect in 11/11 tumors. All of the tumors were heterogeneous. Calcification was not observed at all (Figure 2).
Table 1. Patient demographics and conventional MRI findings
No Pathology Age Gender Solid component
Cystic
component Hemorrhage Contrasting Edema Necrosis Heterogeneity Mass effect 1 D IF F U S E A S T R O C Y T O M A , W H O G R A D E : I I 30 M p n n n n n n n 2 30 M p n n n n n n n 3 30 F p n n p n n n n 4 36 F p n n n n n n n 5 37 M p n n n p n n n 6 31 F p n n n n n n n 7 28 F p n n n n n n n 8 23 M p n n n n n n n 9 8 F p n n p p n n n 10 8 M p n n p p n n n 11 29 M p n n n n n n n 12 35 F p p n p n n n n 13 30 M p n n n p n n p 14 G L IO B L A S T O M A 21 M p n p m m n p p 15 59 F p n n p p p p p 16 68 F p n n p p p p p 17 46 M p n n p p p p p 18 63 M p n p p m p p p 19 61 F p n n p p p p p 20 34 M p p p p p p p p 21 56 M p p n p p p p p 22 53 M p n n p p p p p 23 47 M p n n p p p p p 24 16 M p n n p p p p p
WHO=World Health Organization; M=male; F=female, p=present, n=none, m=minimal
Figure 1. Grade II diffuse astrocytoma.
A, Axial contrast-enhanced T1-W MR image shows a non-enhancing mass in the in the left frontal lobe. B-C, Apparent diffusion coefficient (ADC) and axial dynamic susceptibility contrast perfusion relative cerebral blood volume (rCBV) map-tissue signal-intensity time curve show hypocellularity and hypoperfusion on the solid portion. One ROI is in the tumor area for measurement of ADC and rCBV values, and another is at a corresponding site in the contralateral normal white matter
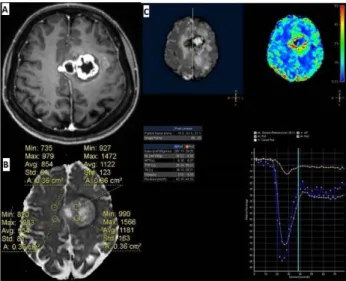
Figure 2. Glioblastoma.
A, Axial contrast-enhanced T1-W MR image shows an irregular rim enhancing mass with central necrosis in the in the left frontal lobe. B-C, Apparent diffusion coefficient (ADC) and axial dynamic susceptibility contrast perfusion relative cerebral blood volume (rCBV) map-tissue signal-intensity time curve show heterogeneous cellularity and hyperperfusion on the solid portion. One ROI is in the tumor area for measurement of ADC and rCBV values, and another is at a corresponding site in the contralateral normal white matter. The ROI is placed in the highest perfusing portion of the tumor, not including a dominant central vessel
When ADC values were compared with ADC values of normal WM in the contralateral hemisphere, the min, max, and average ADC values in GBMs were slightly higher than those of the contralateral hemisphere, but not statistically significant. No significant relationship was found between GBM ADC and rCBV values (p=0.894) and Ki-67 (p=0.132) values. There was a moderate negative correlation between p53 and GBM minADC (r=-0.683, p=0.042). There was a strong negative correlation between p53 and the minADC and average ADC of the WM of contralateral hemisphere (r=-0.850, p=0.004; r=-0.767, p=0.016 respectively).
Grade II Astrocytoma vs. Glioblastoma
In the comparison of the groups, the tumor average minADC (p=0.032) and tumor mean average ADC (p=0.049) were significantly lower in the GBM group. The tumor average maxADC values were also lower but not statistically significant (p=0.094). A significant negative correlation existed between min and average ADC between WHO Grade II astrocytoma and GBM. Grade II astrocytoma and GBM min, max, and average ADC, rCBV, Ki-67, and p53 values are summarized in Table 2. According to the ROC Analysis, the cutoff value of 767x10-6
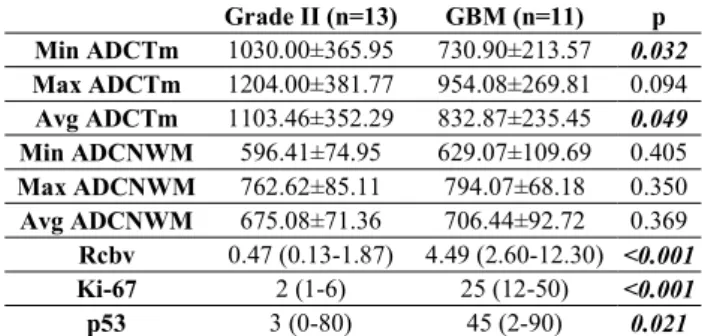
Table 2. Grade II astrocytoma and GBM min, max, and average ADC, rCBV, Ki-67, and p53 values
Grade II (n=13) GBM (n=11) p Min ADCTm 1030.00±365.95 730.90±213.57 0.032 Max ADCTm 1204.00±381.77 954.08±269.81 0.094 Avg ADCTm 1103.46±352.29 832.87±235.45 0.049 Min ADCNWM 596.41±74.95 629.07±109.69 0.405 Max ADCNWM 762.62±85.11 794.07±68.18 0.350 Avg ADCNWM 675.08±71.36 706.44±92.72 0.369 Rcbv 0.47 (0.13-1.87) 4.49 (2.60-12.30) <0.001 Ki-67 2 (1-6) 25 (12-50) <0.001 p53 3 (0-80) 45 (2-90) 0.021
GBM=glioblastoma; Min= minimum; Max=maximum; Avg=average; ADCTm=ADC value of tumor; ADCNWM=ADC value of normal brain contralateral to the tumor; rCBV=cerebral blood volume; rCBV, Ki-67 and p53 were given as median (min-max)
sensitivity (70%) and specificity (84.6%) with an accuracy rate of 78.3%. The difference in the grading between the 2 groups classified by using this cutoff value of the minADC was significant (AUC=0.731, p=0.036).
According to the ROC Analysis, the cutoff value of 876 x10-6
mm2/s for the average ADC generated the best combination of
sensitivity (70%) and specificity (84.6%) with an accuracy rate of 78.3%. The difference in the grading between the 2 groups classified by using this cutoff value of the average ADC was significant (AUC=0.731, p=0.036).
Tumor rCBV (p<0.001), Ki-67 (p<0.001), and p53 (p=0.021) values were all significantly higher in the GBM group than the Grade II astrocytoma group.
According to the ROC Analysis, the cutoff value of 2 for the rCBV generated the best combination of sensitivity (100%) and specificity (100%) with an accuracy rate of 100%. The difference in the grading between the 2 groups classified by using this cutoff value of the rCBV was significant (AUC=1, p<0.001).
According to the ROC Analysis, the cutoff value of 7 for the Ki-67 generated the best combination of sensitivity (100%) and specificity (100%) with an accuracy rate of 100%. The difference in the grading between the 2 groups classified by using this cutoff value of the Ki-67 was significant (AUC=1, p<0.001).
According to the ROC Analysis, the cutoff value of 13 for the p53 generated the best combination of sensitivity (100%) and specificity (100%). The difference in the grading between the 2 groups classified by using this cutoff value of the p53 was significant (AUC=0.792, p=0.021).
In both groups, when the difference between the normal (contralateral) hemisphere and the lesioned hemisphere in the ADC measurements was considered, the minADC value of the lesion was greater in the Grade II group than in the normal hemisphere. However, the values of the lesion and normal hemispheres were closer in the GBM group.
DISCUSSION
In our study, tumor ADC values in the both groups were increased compared to the white matter of contralateral hemisphere. However, in the GBM group, the ADC values of the lesion and analogous tissue in the normal hemisphere were closer to each other, while the Grade II astrocytoma minADC and average ADC values were much larger and statistically significant than normal hemisphere. This finding can be explained by the fact that most low-grade astrocytomas, without increased cellularity, disrupt normal tissue structure and allow more water diffusion via vasogenic edema compared to normal brain tissue. Our results showed that a significant negative correlation existed between min and average ADC of WHO Grade II astrocytoma and Grade IV GBM. We found a significant difference in the minADC and average ADC values for differentiating the low –and high-grade astrocytomas, though the minADC of each group overlapped (respectively p=0.032, p=0.049). Cutoff value of 767x10-6 mm2/s
for the minADC and cutoff value of 876x10-6 mm2/s for the
average ADC provided the best combination of sensitivity (84.6%) and specificity (70%) with an accuracy rate of 78.3% for differentiating tumor grades (p=0.036).
Yamasaki et al. (7) also found that ADC values in low-grade gliomas were higher than those in high-grade gliomas; average ADC values in diffuse astrocytoma were 1.530±0.148x10⁻³
mm2/s (range: 1.270-1.776x10⁻³ mm2/s), and average ADC
values in GBM were 1.079±0.154x10⁻³ mm2/s (range:
0.769-1.442x10⁻³ mm2/s). In this study, ADC values of diffuse
astrocytomas were found to be significantly higher than those of GBM, and an inverse relationship was found between the grade of astrocytic tumors and average ADC.
In some studies, there are findings that are contrary to expectations. For example, Sugahara et al. (8) found minADC values of high-grade gliomas were higher than those of low-grade gliomas. The declining relationship between increased tumor cellularity and ADC values may be complicated by other factors. Cystic changes in tumor and necrosis may potentially lead to an increase in ADC values. ADC values also increase with greater vasogenic edema. Increased edema is more common in high-grade tumors. We performed measurements of solid component of tumor, avoiding cystic and necrotic areas in our study. Perfusion parameters, which can evaluate tumor microvascularities, are a useful method to characterize gliomas. Many studies have shown that MR perfusion metrics have a relationship with tumor grade and histological findings (9-11). Some studies have successfully classified high-grade and low-grade gliomas by using perfusion MR. Hilaro et al. (12) found rCBV values to be significantly different between Grade II and IV tumors and between Grade III and IV tumors. In this study, ADC values were also significantly different for each of the 3 grades. In the literature, rCBV values in Grade II tumors were found to be 2.11 by Hilario et al. (12), between 1.01 and 1.21 by Aronen et al. (13), and as 1.69±0.5 by Hakyemez et al (14). In GBMs, Knopp et al. (15) found rCBV values to be 4.72±2.76 (range: 1.73 to 13.07). Sugahara et al. (8) determined the maximum rCBV value to be 7.32, and Hakyemez et al. (14) determined the average rCBV value as 6.99±4.68. In our study, the rCBV value in the Grade II tumor group was 0.47 and the lowest was 0.13. The highest was 1.87. The rCBV value in the GBM group was 4.49, with the lowest at 2.6 and highest at 12.3. rCBV values were significantly higher in the GBM group (p<0.001) than in the Grade II tumor group. The cutoff value of 2 for the rCBV ratio provided the best combination of sensitivity (100%) and specificity (100%) for differentiating tumor grades (p<0.001). However, in our study, there was no relationship between rCBV values and ADC values measured in the both groups. Hilario et al. (12) claimed that ADC measurements are better than rCBV values in glioma grade differentiation. In our study, Grade III astrocytic tumors were not evaluated; nevertheless, the accuracy of our cut-off values, especially for rCBV, in terms of Grade II and Grade IV discrimination was higher than that of other studies.
Ki-67 proliferation marker, which is an objective indicator of biological behavior, is a core antigen capable of marking proliferating cells in the phases G1, S, G2 and M (5,6). Several studies have demonstrated that the average Ki-67 value in high-grade tumors was significantly higher than those in low-high-grade tumors (16,17). In our study, the mean Ki-67 value for Grade II astrocytoma was 2% with a range of 1%-6%. The mean Ki-67 score for GBM was 25%, ranging from 12% to 50%. Ki-67 was significantly higher in the GBM group than in the Grade II tumor group (p<0.001). Our results showed Ki-67 obviously increased with increasing grade of astrocytoma. We found a significant difference in the Ki-67 value for differentiating the low–and high-grade astrocytomas (p<0.001).The cutoff value of 7 for the Ki-67 provided the best combination of sensitivity (100%) and specificity (100%) for differentiating tumor grades (p<0.001). In some studies, an inverse correlation was found between Ki-67, and ADC and perfusion parameters (18). In our study, however, there was no significant correlation between ADC and rCBV values and Ki-67 in either Grade II or Grade IV groups.
p53 gene mutations are the most frequent genetic alterations in astrocytic tumors. p53 is a nuclear phosphoprotein that functions as a negative regulator of cell growth. It can be seen in all low- and high-grade astrocytic tumors. It accumulates in cells after DNA damage. The number of p53 immunopositive cells may be indicative of p53 gene mutation. Although a correlation between the number of p53 immunopositive cells and the malignancy grade has been reported, it is not necessary that the p53 gene changes be correlated with immunohistochemically detected p53 protein. Higher levels of p53 protein can also be present without gene mutation (6). In previous studies, the percentage of p53 expression in GBMs was 38% (19), 49% (20), and 71% (21). Karamitopoulou et al. (22) found that p53 immunoreactivity was 55.6% for GBM and between 26% and 20% for Grade II astrocytoma. Conflicting results have also been reported for low-grade astrocytomas. Barbareschi et al. (23) found that p53 protein expression in low-grade glioma was 50%. Furthermore, Bruner et al. (24) did not detect p53 immunoreactivity in benign astrocytic tumors. In our patient group, the average p53 score in Grade II astrocytomas was 3%, with a broad range, (from 0% to 80%). Similarly, although p53 scores ranged between 2% and 90% in the GBM group, the average p53 score was 45% in the GBM group. p53 scores (p=0.021) were significantly higher in the GBM group. The cutoff value of 13 for the p53 provided the best combination of sensitivity (100%) and specificity (100%) for differentiating tumor grades (p<0.001). There was a moderate negative correlation between p53 and GBM min ADC (r=-0.683, p=0.042). As the min ADC value declined in GBMs, that is, as the cellularity increased, the p53 score increased. A strong negative correlation between p53 and the min ADC and average ADC values of GBM in normal white matter of contralateral hemisphere may support the hypothesis that the “normal” white matter is not really normal and that with GBMs a diffuse brain disease exists even in areas that appear normal by conventional imaging. No correlation was found between ADC and rCBV values for Grade II astrocytoma and p53.
Limitations
The areas where ADC and rCBV were measured were not exactly compatible with the areas where Ki-67 and p53 were measured because of the retrospective nature of our study. Our sample size was relatively low. We did not address IDH genetic status. In our sample, patients with Grade III anaplastic astrocytomas were not included in the study because of the lack of pre-op MR images and in some cases perfusion data. Our paper did not deal with patient survival and tumor prognosis because of the lack of a follow up study. When follow-up studies are added, the relationship between DWI and perfusion MRI parameters and patient survival or tumor prognosis will be better understood. CONCLUSION
Utilizing rCBV value of 2 to distinguish grade II astrocytomas from grade IV GBM is superior to relying on ADC values to predict grade and it was 100% accurate. Ki-67 and p53 values obviously increased with increasing grade of astrocytoma. As the min ADC value declined, the p53 score increased. Finally, the decline in the ADC values of GBM in the normal WM of the contralateral hemisphere corroborates the notion of a diffuse neoplastic process. REFERENCES
1. Brasil Caseiras G, Ciccarelli O, Altmann DR, Benton CE, Tozer DJ, Tofts PS, et al. Low-grade gliomas: six-month tumor growth predicts patient outcome better than admission tumor volume, relative cerebral blood volume, and apparent diffusion coefficient. Radiology. 2009;253(2):505-12. 2. Tozer DJ, Jäger HR, Danchaivijitr N, Benton CE, Tofts PS, Rees
JH, et al. Apparent diffusion coefficient histograms may predict low-grade glioma subtype. NMR Biomed. 2006;20(1):49-57. 3. Fudaba H, Shimomura T, Abe T, Matsuta H, Momii Y,
Sugita K, et al. Comparison of multiple parameters obtained on 3T pulsed arterial spin-labeling, diffusion tensor imaging, and MRS and the Ki-67 labeling index in evaluating glioma grading. AJNR Am J Neuroradiol. 2014;35(11):2091-8. 4. Johannessen AL, Torp SH. The clinical value of
Ki-67/MIB-1 labeling index in human astrocytomas. Pathol Oncol Res. 2006;12(3):143-7.
5. Torp SH. Diagnostic and prognostic role of Ki-67 immunostaining in human astrocytomas using four different antibodies. Clin Neuropathol. 2002;21(6):252-7.
6. Bouvier-Labit C, Chinot O, Ochi C, Gambarelli D, Dufour H, Figarella-Branger D. Prognostic significance of Ki-67, p53 and epidermal growth factor receptor immunostaining in human glioblastomas. Neuropathol Appl Neurobiol. 1998;24(5):381-8. 7. Yamasaki F, Kurisu K, Satoh K, Arita K, Sugiyama K, Ohtaki M, et al. Apparent diffusion coefficient of human brain tumors at MR imaging. Radiology. 2005;235(3):985-91.
8. Sugahara T, Korogi Y, Kochi M, Ikushima I, Shigematu Y, Hirai T, et al. Usefulness of diffusion-weighted MRI with echo-planar technique in the evaluation of cellularity in gliomas. J Magn Reson Imaging. 1999;9(1):53-60.
9. Rollin N, Guyotat J, Streichenberger N, Honnorat J, Tran Minh VA, Cotton F. Clinical relevance of diffusion and perfusion magnetic imaging in assessing intra-axial brain tumors. Neuroradiology. 2006;48(3):150-9.
10. Kao HW, Chiang SW, Chung HW, Tsai FY, Chen CY. Advanced MR Imaging of Gliomas: An Update. Biomed Res Int. 2013;2013:970586.
11. Kim HS, Kim SY. A prospective study on the added value of pulsed arterial spin-labeling and apparent diffusion coefficients in the grading of gliomas. AJNR Am J Neuroradiol. 2007;28(9):1693-9.
12. Hilario A, Ramos A, Perez-Nuñez A, Salvador E, Millan JM, Lagares A, et al. The added value of apparent diffusion coefficient to cerebral blood volume in the preoperative grading of diffuse gliomas. AJNR Am J Neuroradiol. 2012;33(4):701-7.
13. Aronen HJ, Gazit IE, Louis DN, Buchbinder BR, Pardo FS, Weisskoff RM, et al. Cerebral blood volume maps of gliomas: Comparison with tumor grade and histologic findings. Radiology. 1994;191(1):41-51.
14. Hakyemez B, Erdogan C, Ercan I, Ergin N, Uysal S, Atahan S. High-grade and low-grade gliomas: differentiation by using perfusion MR imaging. Clin Radiol. 2005;60(4):493-502. 15. Knopp EA, Cha S, Johnson G, Mazumdar A, Golfinos JG,
Zagzag D, et al. Glial neoplasms: dynamic contrast-enhanced T2*-weighted MR imaging. Radiology. 1999;211(3):791-8. 16. Shahmohammadi M, Fazeli MA, Janamiri Z, Gorji RA.
Correlation of ADC Map with the Ki-67 Index in Glial Tumor Prognosis in Patients of Stereotaxic Ward. ICNSJ. 2017;4(1):18-24.
17. Khalid H, Shibata S, Kishikawa M, Yasunaga A, Iseki M, Hiura T. Immunohistochemical analysis of progesterone receptor and Ki-67 labeling index in astrocytic tumors. Cancer. 1997;80(11):2133-40.
18. Yang L, Shi Z, Liu Z, Zhang J, Bi L, Han X, et al. MinADC values predict prognosis in patients with low-grade and high-grade gliomas by 3.0-T MRI. Int J Clin Exp Med. 2016;9(11):21490-7.
19. Rasheed BK, McLendon RE, Herndon JE, Friedman HS, Friedman AH, Bigner DD, et al. Alterations of the TP 53 gene in human gliomas. Cancer Res. 1994;54(5):1324-30. 20. Haapasalo H, Isola J, Sallinen P, Kalimo H, Helin H, Rantala
I. Aberrant p53 expression in astrocytic neoplasms of the brain: Association with proliferation. Am J Pathol. 1993;142(5):1347-51.
21. Ellison DW, Gatter KC, Steart PV, Lane DP, Weller RO. Expression of the p53 protein in a spectrum of astrocytic tumours. J Pathol. 1992;168(4):383-6.
22. Karamitopoulou E, Perentes E, Diamantis I. p53 protein expression in central nervous system tumors: An immunohistochemical study with CM1 polyvalent and DO-7 monoclonal antibodies. Acta Neuropathol. 1993;85(6):611-6. 23. Barbareschi M, Iuzzolino P, Pennella A, Allegranza A, Arrigoni G, Dalla Palma P, et al. p53 protein expression in central nervous system neoplasms. J Clin Pathol. 1992;45(7):583-6.
24. Bruner JM, Saya H, Moser RP. Immunocytochemical detection of p53 in human gliomas. Mod Pathol. 1991;4(5):671-4.