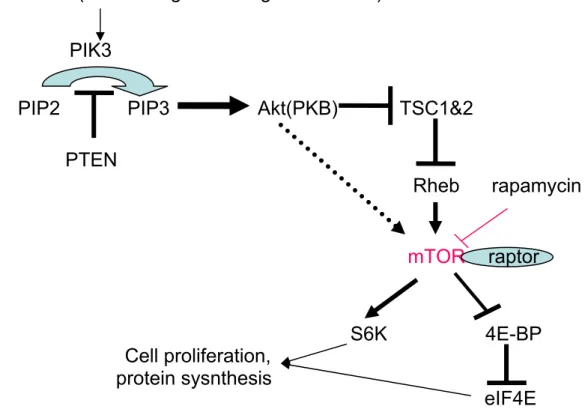
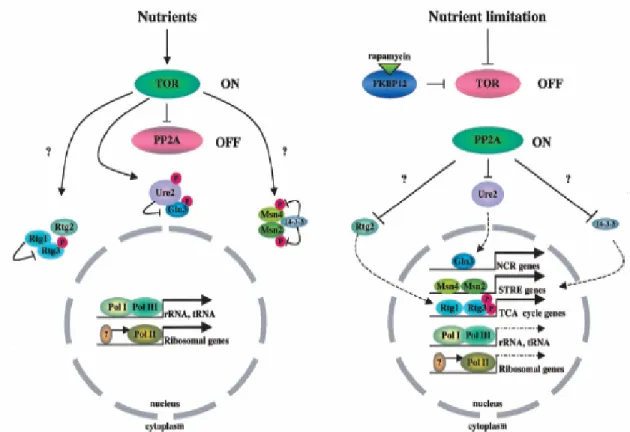
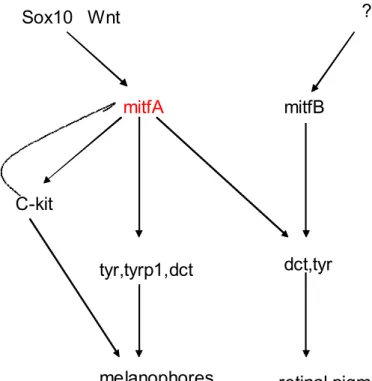
Effects of rapamycin on the early development of zebrafish (Danio rerio)
Tam metin
Şekil
Benzer Belgeler
For the vibration amplitude, turbine cycles and bearing temperature, a data acquisition and logger system arranged while the power output data gathered over internet.. The
We have proposed a multi-envelope precoding technique for use in massive MIMO systems, which employs only a few envelope levels (with both discrete and continuous phase shifters),
UPX protein extraction buffer (Expedeon) was used for protein extraction as per the manufacturer's.. Workflow describing experimental design. Samples from amputated tissues
For robust innovation in diagnostics and thera- peutics, we propose that the three alphabets of life, the DNA, protein, and sugar codes (Gabius and Roth, 2017; Gabius, 2018;
It characteristically involves secondary amyloidosis (with nephrotic syn- drome and renal failure), glomerulonephritis (with several different types of glomerular lesions),
Comparison of the PXRD patterns of the amphorae from other finding spots and the provenance studies by means of multivariate statistical analyses showed that the white clay
The coalitions like the RPP-NSP, the RPP-RRP-DemP-independents, the TPP- SDPP/RPP in 1995 the were the last remaining options. Their target was not carrying out common
In this study, we particularly focused on Robo2, a gene known to have a repulsive role during axon guidance yet also has been shown to be dysregulated in certain tumors
