related to arrhythmogenesis and may explain the relationship between smoking and the increased risk of cardiac mortality [5].
As Kors et al. noted, “Myocardial repolariza-tion can be evaluated with QT interval (QT), cor-rected QT interval (QTc), QT dispersion (QTd), and transmural dispersion of repolarization (TDR). [The] Tp-e interval, which is the interval between the peak and the end of the T-wave on an electrocardiogram (ECG), is accepted as an in-dex” of TDR [6]. The Tp-e/QT ratio and Tp-e/QTc Cigarette smoking is a major risk factor for
cardiovascular morbidity and mortality. The rela-tion between smoking and cardiovascular events is dose dependent [1]. Studies suggest that chron-ic cigarette smoking is associated with sympathet-ic hyperactivity [2, 3]. Plasma catecholamine levels increase with smoking and may be arrhythmogen-ic [4]. Smoking and its effect on the cardiovascular system represent a complex interaction between the autonomic nerve system and the heart. Im-paired autonomic function has been found to be
Tevfik F. İlgenli
1, A, E, F, Alptuğ Tokatlı
2, B–D, Onur Akpınar
3, E, F,
Fethi Kılıçaslan
4, FThe Effects of Cigarette Smoking
on the Tp-e Interval, Tp-e/QT Ratio
and Tp-e/QTc Ratio
1 Departmentof Cardiology, Özel Selçuklu Hospital, Konya, Turkey 2 Department of Cardiology, Golcuk Military Hospital, Kocaeli, Turkey 3 Department of Cardiology, Near East University, Nicosia, Cyprus 4 Department of Cardiology, Medipol University Hospital, Istanbul, Turkey
A – research concept and design; B – collection and/or assembly of data; C – data analysis and interpretation; D – writing the article; E – critical revision of the article; F – final approval of article
Abstract
Background. Cigarette smoking increases the risk of sudden cardiac death. Smoking may predispose individuals to
ventricular fibrillation and sudden cardiac death by altering ventricular repolarization and stimulating sympathetic nervous system activity.
Objectives. The aim of the study was to investigate the instantaneous effects of smoking on ventricular repolarization. Material and Methods. The study included 47 healthy subjects; 24 long-term heavy smokers (10 women, mean age:
40 ± 5 years) constituted the study group, and 23 non-smokers (10 women, mean age: 42 ± 10 years) constituted the control group. ECGs were performed on all the subjects. The Tp-e interval, Tp-e/QT ratio and Tp-e/QTc ratio were measured and compared between the groups.
Results. There were no significant differences between smokers and nonsmokers in the basic clinical and
echocar-diographic variables (p > 0.05). The QT interval and QTc interval were similar in both groups. The Tp-e interval (p = 0.02) and Tpe/QT ratio (p = 0.001) were higher in the heavy smokers than in the non-smokers. The Tpe/QTc ratio (p = 0.001) was also higher in the smokers. Other ECG parameters were similar between the smokers and nonsmokers.
Conclusions. The results show that chronic cigarette smoking is associated with a prolonged Tp-e interval,
increased Tp-e/QT ratio and Tp-e/QTc ratio. These observations may indicate that there may be a relationship between smoking and altered ventricular repolarization. Abnormal ventricular repolarization values on an ECG may explain the increased cardiovascular event risk in long-term heavy cigarette smokers (Adv Clin Exp Med
2015, 24, 6, 973–978).
Key words: smoking, Tp-e/QT ratio, Tp-e/QTc ratio, Tp-e interval.
ORIGINAL PAPERS
Adv Clin Exp Med 2015, 24, 6, 973–978
ratio are also used as an electrocardiographic index of ventricular arrhytmogenesis [7].
This case-control study was conducted to demonstrate the effects of smoking on ventricular repolarization by assessing the Tp-e interval, Tp-e/ /QT ratio and Tp-e/QTc ratio.
Material and Methods
Study Population
The study population consisted of 23 non-smokers (Group 1: 13 males and 10 females, mean age 42 ± 10 years) and 24 long-term heavy smok-ers (Group 2: 14 males and 10 females, mean age 40 ± 5 years). Long-term heavy cigarette smok-ing was defined as more than 20 cigarettes smoked per day for at least five years. The study popula-tion was enrolled between January 2012 and May 2012 at Gölcük Military Hospital (Kocaeli, Tur-key). Individuals with a history of coronary artery disease, diabetes mellitus, valvular heart disease, prior pacemaker implantation, a history of atri-al fibrillation, cardiomyopathy, an abnormatri-al thy-roid function test, abnormal electrolyte values or antiarrhythmic drug treatment were excluded. The study protocol was approved by Gölcük Military Hospital’s ethics committee and informed consent was obtained from each participant.
Physical and echocardiographic examinations were performed on all the participants. All the sub-jects were taken to the examination room after an overnight fasting period and a light breakfast. All the participants were asked to refrain from alco-holic and caffeinated beverages and from strenu-ous exercise for 24 h before the study. The smokers were also asked not to smoke cigarettes for eight hours before the study. Baseline ECG was obtained for all the participants. After taking the baseline ECG recordings, the Group 2 participants were asked to smoke a cigarette. Another ECG recording was performed after each had finished smoking.
Electrocardiography
For the analysis of the electrocardiograph-ic parameters, lead II was recorded at a sampling frequency of 512 Hz. A 10-second strip was used. The P-wave duration, RR interval, PR interval, QRS duration, QT interval and Tp-e interval were measured manually. The e/QT ratio and Tp-e/QTc ratio were calculated from these measure-ments. The onset of the P-wave was defined as the first visible upward departure from the base-line and the end of the P wave was defined as a re-turn to the baseline. The QT interval was defined
as the time from the onset of the QRS to the point at which the T-wave returned to the baseline. The QTc interval was calculated using Bazett’s formula. The Tp-e/QT ratio and Tp-e/QTc ratio were cal-culated. The Tp-e interval was measured from the peak of T-wave to the end of T-wave. The end of the T-wave was defined as the intersection of the isoelectric line with the tangent drawn through the down slope of T-wave. All the measurements were performed by two investigators. The intraobserv-er and intintraobserv-erobsintraobserv-ervintraobserv-er coefficients of variation (the SD of differences between two observations divid-ed by the mean value and expressdivid-ed as a percent-age) were found to be 1.2% and 2.3% respectively.
Statistical Analysis
The required sample size was calculated to be 40 with a 95% confidence interval and 80% study power. Continuous variables are expressed as mean ± standard deviation. Categorical variables were expressed as percentages. The independent-samples t-test and the c2 test were used for com-parisons of continuous and categorical variables. Spearman’s rank correlation test was used to ex-amine correlations between variables. A p-value of < 0.05 was considered significant. The statistical analysis was performed using a commercially avail-able statistical package (SPSS for Windows 10.0).
Results
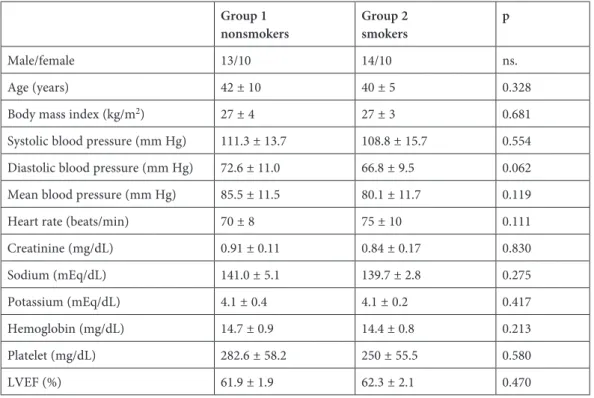
The baseline clinical characteristics of both groups are shown in Table 1. There were no sig-nificant differences between the groups in terms of age, blood pressure and body mass index. The physical examinations revealed no clinically signif-icant disorders in any of the study subjects. The echocardiographic examinations were normal. All the subjects were in sinus rhythm. Heart rate val-ues were higher in the smokers than in the non-smokers, but the difference was not statistically significant.
The baseline PR, QT and QTc values were not significantly different in the two groups. Although the QT and QTc intervals were similar, the base-line Tp-e interval was significantly prolonged in the smokers’ group compared to the control group (85.3 ± 10.7 msn and 78.9 ± 7.3 msn respectively; p = 0.02). The baseline Tp-e/QT ratio was also sig-nificantly higher in the smokers’ group compared to the control group (0.25 ± 0.03 and 0.21 ± 0.02 re-spectively; p = 0.001). The baseline Tp-e/QTc ratio was also higher in the smokers’ group compared to the nonsmokers (0.23 ± 0.03 and 0.20 ± 0.02 re-spectively; p = 0.001) (Table 2).
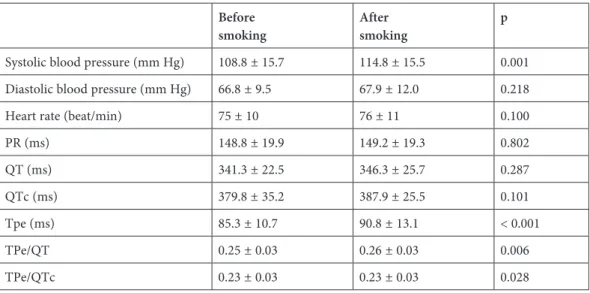
In Group 2, the Tp-e interval was found to be sig-nificantly prolonged after smoking a cigarette com-pared with the baseline (90.8 ± 13.1 and 85.3 ± 10.7 respectively; p < 0.001). The Tp-e/QT ratio and Tp-e/QTc ratio were also significantly higher af-ter smoking a cigarette compared with the baseline. Other ECG parameters were similar after smoking a cigarette compared with baseline (Table 3).
Discussion
The main finding of the present study is that the mean Tp-e interval, Tp-e/QT ratio and Tp- -e/QTc ratio are prolonged in long-term heavy smokers. The study also investigated the immedi-ate effect of smoking a cigarette, and found that the
Tp-e interval, Tp-e/QT ratio and Tp-e/QTc ratio are also prolonged after smoking a cigarette. The study provides evidence that smoking is associat-ed with ventricular repolarization alteration. The finding that the Tp-e interval, Tp-e/QT ratio and Tp-e/QTc ratio are increased in smokers is very important. This study is the first to report on the Tp-e interval, Tp-e/QT ratio and Tp-e/QTc ratio in smokers. The results may contribute to explaing the pathophysiological mechanisms of the in-creased prevalence of ventricular arrhythmias among smokers by revealing increased ventricular repolarization heterogeneity in smokers.
Many studies have reported that increased dispersion of repolarization might predispose in-dividuals to ventricular arrhythmias [8, 9]. Ant-zelevich et al. [10] reported an association between
Table 1. Baseline characteristics of the study population Group 1
nonsmokers Group 2smokers p
Male/female 13/10 14/10 ns.
Age (years) 42 ± 10 40 ± 5 0.328 Body mass index (kg/m2) 27 ± 4 27 ± 3 0.681
Systolic blood pressure (mm Hg) 111.3 ± 13.7 108.8 ± 15.7 0.554 Diastolic blood pressure (mm Hg) 72.6 ± 11.0 66.8 ± 9.5 0.062 Mean blood pressure (mm Hg) 85.5 ± 11.5 80.1 ± 11.7 0.119 Heart rate (beats/min) 70 ± 8 75 ± 10 0.111 Creatinine (mg/dL) 0.91 ± 0.11 0.84 ± 0.17 0.830 Sodium (mEq/dL) 141.0 ± 5.1 139.7 ± 2.8 0.275 Potassium (mEq/dL) 4.1 ± 0.4 4.1 ± 0.2 0.417 Hemoglobin (mg/dL) 14.7 ± 0.9 14.4 ± 0.8 0.213 Platelet (mg/dL) 282.6 ± 58.2 250 ± 55.5 0.580 LVEF (%) 61.9 ± 1.9 62.3 ± 2.1 0.470 LVEF – left ventricular ejection fraction, values are presented as mean ± SD.
Table 2. Electrocardiographic measurements of the groups Group 1
nonsmokers Group 2smokers p
PR (ms) 157.8 ± 21.1 148.8 ± 19.9 0.136 QT (ms) 381.6 ± 24.1 341.3 ± 22.5 0.554 QTc (ms) 389.8 ± 22.3 379.8 ± 35.2 0.535 Tpe (ms) 78.9 ± 7.3 85.3 ± 10.7 0.020 TPe/QT 0.21 ± 0.02 0.25 ± 0.03 0.001 TPe/QTc 0.20 ± 0.02 0.23 ± 0.03 0.001 Values are presented as mean ± SD.
ventricular arrhythmogenesis and Tp-e interval prolongation. The duration of action potential is longer in midmyocardial M-cells than in other myocardial cells. The earliest completion of repo-larization occurs in the epicardial cells. The peak of the T-wave represents the end of the epicardial action potential, and the end of the T wave repre-sents the end of the midmyocardial action poten-tial. Therefore, the Tp-e interval is a reflection of transmural dispersion of repolarization [11]. Pre-vious studies have reported on prolongation of the Tp-e interval in Brugada syndrome, in long QT syndrome, in hypertrophic cardiomyopathy, in pa-tients undergoing primary percutaneous coronary intervention for myocardial infarction and in pa-tients with obstructive sleep apnea [8–12]. How-ever, to the best of the current authors’ knowledge, the Tp-e interval has not previously been evaluat-ed in smokers. It has been reportevaluat-ed that prolonga-tion of the Tp-e interval is associated with sudden cardiac death (SCD) [13]. Thus, the results of the present study may explain this increased SCD risk by showing that dispersion of ventricular repolar-ization is increased in smokers.
Cigarette smoking is a strong and independent risk factor for SCD. Cigarette smoking is associat-ed with increasassociat-ed sympathetic tone and rassociat-educassociat-ed vagal modulation [14, 15]. Acute exposure to cig-arette smoking has a sympathetic excitatory effect on smokers [16]. An acute increase in heart rate shortly after smoking is well documented. The ef-fects of smoking on cardiovascular modulation are ascribed to nicotine, the main constituent of ciga-rette smoke. Nicotine transiently raises blood pres-sure by 10 to 20 mm Hg, and in habitual smokers elevates the average daytime blood pressure [17]. It has been shown that smoking increases plasma
catecholamine levels and effects heart rate variabil-ity [4]. Smoking also has various effects on ECGs, increasing conduction velocities and decreasing re-fractory periods [18]. Ramakrishnan et al. showed that heart rate and ectopic beats increase acutely following smoking, although spectral analysis of heart rate variability remain in normal ranges [19]. Dilaveris et al. evaluated the effects of smoking on ventricular repolarization and found that QT pa-rameters were significantly lower in smokers but rate-corrected QT maximum and QT median dif-ferences were not significant [20]. Singh investi-gated chronic smokers and showed that the R-R interval, QTc and QT dispersion were increased in smokers [21]. The present study findings showed no difference between groups in terms of QT or QTc. The acute effect of smoking on autonomic modulation, characterized by sympathetic overac-tivity and parasympathetic withdrawal, is well de-fined [22]. But there are also some conflicting re-sults about the effect of smoking on autonomic modulation. The SDNN, RMSDD and HF indices of heart rate variability (HRV) have been shown to be decreased shortly after smoking [23], although some investigators failed to find any relation be-tween smoking and HRV indices [24, 25]. Kupa-ri et al. found that HRV was lower among indi-viduals who smoke more than ten cigarettes per day [26]. The present study population included participants who smoke more than twenty ciga-rettes per day.
In the present study, the QT and QTc intervals were not different in the smoking and non-smok-ing groups. However, it was found that the other indices of ventricular repolarization (namely the Tp-e interval, Tp-e/QT ratio and Tp-e/QTc ratio) are increased in long-term heavy smokers.
Table 3. Clinical and electrocardiographic variables of Group 2 participants before and after smoking Before
smoking Aftersmoking p
Systolic blood pressure (mm Hg) 108.8 ± 15.7 114.8 ± 15.5 0.001 Diastolic blood pressure (mm Hg) 66.8 ± 9.5 67.9 ± 12.0 0.218 Heart rate (beat/min) 75 ± 10 76 ± 11 0.100 PR (ms) 148.8 ± 19.9 149.2 ± 19.3 0.802 QT (ms) 341.3 ± 22.5 346.3 ± 25.7 0.287 QTc (ms) 379.8 ± 35.2 387.9 ± 25.5 0.101 Tpe (ms) 85.3 ± 10.7 90.8 ± 13.1 < 0.001 TPe/QT 0.25 ± 0.03 0.26 ± 0.03 0.006 TPe/QTc 0.23 ± 0.03 0.23 ± 0.03 0.028 Values are presented as mean ± SD.
Limitations
The present study has some limitations. As-sociations between ventricular arrhythmias and the Tp-e interval were not evaluated. Therefore, the prognostic importance of Tp-e interval pro-longation and increased Tp-e/QT ratio in the par-ticipants remains uncertain. However, the Tp-e interval and Tp-e/QT ratio are accepted as impor-tant prognostic markers in many different patient groups. The number of participants in this study
was relatively small. A larger study population would provide more precise results.
The results of this study show that chronic cigarette smoking is associated with a prolonged Tp-e interval, increased Tp-e/QT ratio and Tp-e/ /QTc ratio. These observations may indicate that there may be a relationship between smoking and altered ventricular repolarization. Abnormal ven-tricular repolarization values on ECG may explain the increased cardiovascular event risk in long- -term heavy cigarette smokers.
References
[1] Hallstrom AP, Cobb LA, Ray R: Smoking as a risk factor for recurrence of sudden cardiac arrest. N Engl J Med
1986, 314, 271–275.
[2] Gidding SS, Xie X, Liu K, Manolio T, Flack JM, Gardin JM: Cardiac function in smokers and non-smokers: the
CARDIA study. J Am Coll Cardiol 1995, 26, 211–216.
[3] Hill P, Wynder EL: Smoking and cardiovascular disease: effect of nicotine on the serum epinephrine and
corti-coids. Am Heart J 1974, 87, 491–496.
[4] Narkiewicz K, van de Borne PJ, Hausberg M, Cooley RL, Winniford MD, Davison DE: Cigarette smoking
increases sympathetic outflow in humans. Circulation 1998, 98, 528–534.
[5] Goldenberg I, Moss AJ, McNitt S, Zareba W, Daubert JP, Hall WJ: Cigarette smoking and the risk of
supraven-tricular and vensupraven-tricular tachyarrhythmias in high-risk cardiac patients with implantable cardioverter defibrillators. J Cardiovasc Electrophysiol 2006, 17, 931–936.
[6] Kors JA, Ritsema van Eck HJ, van Herpen G: The meaning of the Tp-Te interval and its diagnostic value.
J Electrocardiol 2008, 41, 575–580.
[7] Gupta P, Patel C, Patel H, Narayanaswamy S, Malhotra B, Green JT: T(p-e)/QT ratio as an index of
arrhythmo-genesis. J Electrocardiol 2008, 41, 567–574.
[8] Topilski I, Rogowski O, Rosso R, Justo D, Copperman Y, Glikson M: The morphology of the QT interval
pre-dicts torsade de pointes during acquired bradyarrhythmias. J Am Coll Cardiol 2007, 49, 320–328.
[9] Shimizu M, Ino H, Okeie K, Yamaguchi M, Nagata M, Hayashi K: T-peak to T-end interval may be a better
predictor of high-risk patients with hypertrophic cardiomyopathy associated with a cardiac troponin I mutation than QT dispersion. Clin Cardiol 2002, 25, 335–359.
[10] Sicouri S, Antzelevitch C: A subpopulation of cells with unique electrophysiological properties in the deep
sub-epicardium of the canine ventricle. The M cell. Circ Res 1991, 68, 1729–1741.
[11] Yan GX, Antzelevitch C: Cellular basis for the normal T wave and the electrocardiographic manifestations of the
long-QT syndrome. Circulation 1998, 98, 1928–1936.
[12] Kilicaslan F, Tokatli A, Ozdag F, Uzun M, Uz O, Isilak Z: Tp-e interval, Tp-e/QT ratio, and Tp-e/QTc ratio
are prolonged in patients with moderate and severe obstructive sleep apnea. Pacing Clin Electrophysiol 2012, 35, 966–972.
[13] Panikkath R, Reinier K, Uy-Evanado A, Teodorescu C, Hattenhauer J, Mariani R: Prolonged Tpeak-to-tend
interval on the resting ECG is associated with increased risk of sudden cardiac death. Circ Arrhythm Electrophysiol 2011, 4, 441–447.
[14] Hayano J, Yamada M, Sakakibara Y, Fujinami T, Yokoyama K, Watanabe Y: Short- and long-term effects of
cigarette smoking on heart rate variability. Am J Cardiol 1990, 65, 84–88.
[15] Niedermaier ON, Smith ML, Beightol LA, Zukowska-Grojec Z, Goldstein DS, Eckberg DL: Influence of
ciga-rette smoking on human autonomic function. Circulation 1993, 88, 562–571.
[16] Narkiewicz K, van de Borne PJ, Hausberg M, Cooley RL, Winniford MD, Davison DE: Cigarette smoking
increases sympathetic outflow in humans. Circulation 1998, 98, 528–534.
[17] Gaziona Jm, Ridker DM, Libby P: Primary and secondary prevention of coronary heart disease. In Bonow R,
Mann D, Zipes D, Libby P. Braunwald’s heart disease: A textbook of cardiovascular medicine. WB Saunders, Philadelphia 2012, 9th ed., 1010–1033.
[18] D’Alessandro A, Boeckelmann I, Hammwhöner M, Goette A: Nicotine, cigarette smoking and cardiac
arrhyth-mia: an overview. Eur J Prev Cardiol 2012, 19, 297–305.
[19] Ramakrishnan S, Bhatt K, Dubey AK, Roy A, Singh S, Naik N: Acute electrocardiographic changes during
smok-ing: an observational study. BMJ Open 2013, 3, e002486.
[20] Dilaveris P, Pantazis A, Gialafos E, Triposkiadis F, Gialafos J: The effects of cigarette smoking on the
heteroge-neity of ventricular repolarization. Am Heart J 2001, 142, 833–837.
[21] Singh K: Effect of smoking on QT interval, QT dispersion and rate pressure product. Indian Heart J 2004, 56,
140–142.
[22] Manzano BM, Vanderlei LC, Ramos EM, Ramos D: Acute effects of smoking on autonomic modulation: analysis
[23] Karakaya O, Barutcu I, Kaya D, Esen AM, Saglam M, Melek M: Acute effect of cigarette smoking on heart rate
variability. Angiology 2007, 58, 620–624.
[24] Murata K, Landrigen PJ, Araki S. Effects of heart rate, gender, tobacco and alcohol ingestion on R–R interval
vari-ability in human ECG. J Auton Nerv Syst 1991, 37, 199–206.
[25] Kageyama T, Nishikido N, Honda Y, Kurokawa Y, Imai H, Kobayashi T: Effects of obesity, current smoking
status, and alcohol consumption on heart rate variability in male white-collar workers. Int Arch Occup Environ Healthy 1997, 69, 447–454.
[26] Kupari M, Virolainen J, Koskinen P, Tikkanen MJ: Short-term heart rate variability and factors modifying the
risk of coronary artery disease in a population sample. Am J Cardiol 1993, 72, 897–903.
Address for correspondence:
Onur Akpınar
Department of Cardiology Near East University Nicosia
Cyprus
E-mail: [email protected] Conflict of interest: None declared Received: 22.03.2014
Revised: 23.04.2014 Accepted: 10.07.2014