Predictive value of the tuberculin skin
test and QuantiFERON‑tuberculosis
Gold In‑Tube test for development of
active tuberculosis in hemodialysis
patients
Ekrem Cengiz Seyhan, Gulşah Gunluoglu
1, Mehmet Zeki Gunluoglu, Seda Tural
1,
Sinem Sökücü
1Abstract:
BACKGROUND: Hemodialysis (HD) patients are at increased risk of reactivation of latent tuberculosis
infection (LTBI) compared with the general population. QuantiFERON-TB Gold (QFT-G) for LTBI detection is more promising than tuberculin skin test (TST) in HD patients.
AIM: In our study, we evaluated the value of the TST and QFT-G In-Tube (QFG-IT) test in the development of
active tuberculosis (TB), in the HD patients, and in healthy controls.
METHODS: The study enrolled 95 HD patients and ninety age-matched, healthy controls. The TST and QFG-IT
were performed. All the subjects were followed up 5 years for active TB disease.
RESULTS: Compared to the healthy controls, a high prevalence of LTBI was found in the HD patients by
QFG-IT (41% vs. 25%). However, no significant diffetrence was detected by TST (32% vs. 31%). Four HD patients and one healthy control progressed to active TB disease within the 5-year follow-up. For active TB discovered subjects, QFG-IT was positive in all, but TST was positive in two (one patient and one healthy control). In HD patients; sensitivity, specificity, positive and negative predictive values of QFG-IT, and TST for active TB was 100% and 25%, 62% and 67%, 10%, and 3%, and 100% and 95%, respectively. Receiver operating curve analysis revealed that the results are significantly different (P = 0.04).
CONCLUSION: QFG-IT test is a more useful diagnostic method than TST for detecting those who will progress
to active TB in HD patients. Key words:
Active tuberculosis, healthy controls, hemodialysis patients, QuantiFERON-tuberculosis Gold In-Tube, tuberculin skin test
T
uberculosis (TB) is caused by infection with Mycobacterium tuberculosis (MTB) a n d i s a s s o c i a t e d w i t h c o n s i d e r a b l e morbidity and mortality, especially among immunocompromised individuals.[1] Fortunately,in most patients, the infection is controlled by the immune system and a latent TB infection (LTBI) does not progress to active disease. However, immunocompromised individuals such as hemodialysis (HD) patients are at an increased risk of LTBI activation because their cellular immunity is compromised.[2] Compared with
the general population, the risk of developing active TB is 7.8–25.0‑fold greater in HD patients.[3]
Therefore, early diagnosis of LTBI and treatment of HD patients infected with MTB are important to reducing the incidence of TB.
Prevention of active TB development is critically dependent on the sensitivities of tests used to identify patients with LTBI. The classic diagnostic
method is the tuberculin skin test (TST), which unfortunately has many well‑known limitations. In addition, TST sensitivity is low in immunocompromised patients.[4]
Specificity is limited by the cross‑reactivity Address for
correspondence: Dr. Ekrem Cengiz Seyhan, Turgut Özal Boulevard, Atakent Street, Soyak Park Apartments, A-8, Istanbul, Turkey. E-mail: drekremcs@ yahoo.com Submission: 11-11-2015 Accepted: 14-01-2016 Department of Chest Diseases, Medical Faculty, Medipol University, 1Department of Chest Diseases, Yedikule Teaching Hospital for Chest Diseases and Thoracic Surgery, Istanbul, Turkey
Original Article
How to cite this article: Seyhan EC, Gunluoglu G,
Gunluoglu MZ, Tural S, Sokucu S. Predictive value of the tuberculin skin test and QuantiFERON-tuberculosis Gold In-Tube test for development of active tuberculosis in hemodialysis patients. Ann Thorac Med 2016;11:114-20.
This is an open access article distributed under the terms of the Creative Commons Attribution‑NonCommercial‑ShareAlike 3.0 License, which allows others to remix, tweak, and build upon the work non‑commercially, as long as the author is credited and the new creations are licensed under the identical terms.
For reprints contact: [email protected]
Access this article online
Quick Response Code:
Website:
www.thoracicmedicine.org
DOI:
of the purified protein derivative (PPD) with the Bacillus Calmette–Guerin (BCG) vaccine and most nontuberculous mycobacteria (NTM).[4] Therefore, the TST cannot be used to
reliably rule out either active TB or LTBI.
A major development in TB diagnosis during the past decade was the development of new generation tests termed interferon‑gamma (IFN‑γ) release assays (IGRAs), which measure in vitro T‑cell responses to MTB‑specific antigens.[5]
The QuantiFERON‑TB Gold In‑Tube test (QFG‑IT), one of the two commercial IGRAs, measures antigen‑specific IFN‑γ secretion by peripheral blood CD4+ T lymphocytes in response
to in vitro stimulation with the ESAT‑6, CFP‑10.[6] These
antigens are absent from Mycobacterium bovis BCG and most NTM and replace the PPD of the TST.[5,6] As a result of studies,
IGRAs are superior to the TST in terms of detecting TB or LTBI in HD patients.[7‑10]
The most important risk associated with LTBI is the development of active disease. This occurs in 5–10% of LTBI patients, usually within 2 years after infection.[11] However, the
risk is higher in patients with compromised immune systems than in immunocompetent patients (10% annually).[12] Active
TB can develop in as many as 28% of HD patients in countries where TB is endemic such as Turkey.[13,14] Thus, it is vital
to detect and prophylactically treat HD patients with LTBI and to schedule a close follow‑up in terms of active disease development. This would both reduce the mortality and prevent possible patient‑to‑patient transmission. However, only a study has explored the ability of the TST and IGRA to predict the development of active disease in HD patients.[9] The
aim of this study was to determine the prevalence of LTBI in HD patients and assess the predictive utility of the QFG‑IT and TST over a 5‑year period in terms of the development of active TB.
Methods
The study group included 95 chronic renal failure (CRF) patients who underwent regular HD and ninety age‑matched healthy controls between April 2010 and May 2010. Baseline characteristics of the study subjects are shown in Table 1. Exclusion criteria for subjects were suspicion of active TB infection, use of immunosuppressive drugs, and other known immunodeficiency status (human immunodeficiency virus [HIV] infection, malignancy, or liver diseases, etc.). The study was approved by the ethics committee of our hospital. The research was carried out in accordance with the Declaration of Helsinki of the World Medical Association.
Assessing previous exposure and tuberculosis risk factors
Information about other illnesses, history of TB infection, and known exposure to TB patients was collected via interviews. BCG vaccination status was ascertained from a self‑reported vaccination history or the detection of a BCG vaccination scar on visual inspection.
Radiological assessment
Chest X‑rays were reviewed by one radiologist. All radiograph reports were reviewed for findings consistent with previous TB infection, including upper lobe fibronodular disease, granulomata, calcified mediastinal lymph nodes, pleural thickening, and any other changes consistent with “prior
granulomatous disease” or “prior tuberculosis,” as stated in the radiologist’s final report.
Tuberculin skin testing
TST was performed using the Mantoux method intradermally on the volar surface of the forearm with 0.1 mL (5 TU) of PPD (Intervax Biologicals, Markham, Ontario, Canada). Responses were read on the subjects’ next 48–72 h after TST. A positive TST was defined as an induration of >10 mm for HD patients and BCG‑unvaccinated healthy controls and a duration of >15 mm for BCG‑vaccinated, healthy controls.[15] Subjects
with <10 mm of induration on initial testing were administered a second TST 1 week later to elicit a potential booster response.
Whole blood stimulation
For the test, 1 mL of whole blood was drawn in each of three Vacutainer tubes provided with QFG‑IT system (Cellestis, Carnegie, Australia), a new generation QuantiFERON‑TB (QFT) test. These tubes are already precoated with saline (negative control), the ESAT‑6 and CFP‑10 peptides and TB 7.7 antigen (antigen‑stimulated), and phytohemagglutinin (positive mitogen control). The tubes were mixed and incubated at 37°C for 20–24 h when the plasma was harvested and frozen until further analysis. This plasma provided the unstimulated, antigen‑stimulated, and mitogen‑stimulated supernatant samples.
Interferon‑gamma quantification
IFN‑γ was measured by an enzyme‑linked immunosorbent assay using the QFG‑IT test, according to the manufacturer’s instructions.[16] A result of ≥0.35 IU/mL IFN‑γ in the TB
Table 1: Demographic characteristics, laboratory findings and results of tuberculin skin test, and QuantiFERON-Tuberculosis Gold In-Tube test of the study participants Characteristics HD patients (n=95) Healthy controls (n=90) P Age (years)a 58±1.49 51±7.3 NS Gender (male), n (%) 44 (48) 39 (43) NS
Dialysis or working duration, yearsb 2 (1‑4) ‑ NA
Risk factors for TB, n (%)
Contact with patient with TB 6 (6) 4 (4) NS
Chest X‑ray with changesc 9 (9) 6 (7) NS
Previous TB infections 3 (3) 2 (2) NS BCG vaccination, n (%) 69 (72) 70 (77) NS BMI (kg/m2) 24.1±4.2 25±3.9 NS Lymphocyte count (/mm3)a 1759±651 1935±734 NS Albumin (g/dL)a 3.9±0.3 4.01±2.1 NS TST test, n (%) NS Positive 31 (32) 28 (31) Negative 64 (68) 62 (69) QFG-IT, n (%) 0.04 Positive 39 (41) 23 (25) Negative 56 (59) 67 (75)
aResults given as mean±SD, bResults given as median (quarter intervals); cChest
radiograph changes consistent with old TB. BMI = Body mass index; BCG = Bacillus Calmette–Guerin; TB = Tuberculosis; n = Number of cases; NS = Statistically
nonsignifcant; NA = Nonavailable; QFG-IT = QuantiFERON-Tuberculosis Gold‑In‑Tube test; TST = Tuberculin skin test; HD = Hemodialysis; SD = Standard deviation
antigen tube minus the negative control tube was considered a positive result. If the level was less than this and the mitogen control was positive (≥0.5 IU/mL), a negative result was recorded. If the level in both the TB antigen and mitogen tubes was less than the threshold for positive or the level in the nil tube was >8.0 IU/mL, then an indeterminate result was recorded.
Follow‑up
Subjects were followed up over a period of 5 years for the development of active TB disease. The diagnosis of active TB was based on the following criteria: (1) Positive cultures of MTB from specimens and/or (2) positive result of TB polymerase chain reaction and/or (3) clinical, radiological, and pathological findings.
Statistical analysis
All statistical analyses were performed using SPSS for Windows (version 16.0) SPSS Inc., Chicago, IL. Variables are presented as the mean or median with the standard deviation. Student’s t‑test was used to compare mean values and the Mann–Whitney U‑test was used to compare median values. The Chi‑square test and Fisher’s exact test were used to compare frequencies. Independent variables with P < 0.15 from the univariate analyses were reanalyzed using multivariate logistic regression analysis. All tests were two‑tailed, and P < 0.05 was considered significant.
Results
Tuberculin skin test resultsThe TST was positive in 32% of HD patients and 31% of healthy controls (P = 0.41) [Table 1]. In univariate analysis, a positive TST result was most closely associated with a history of BCG vaccination in HD patients (P = 0.03). On multivariate analysis, patients with a positive TST result was significant with a history of BCG vaccination (P = 0.032) [Table 2].
QuantiFERON‑tuberculosis In‑Tube results
Positive QFG‑IT test results were significantly more common in HD patients (41%) than healthy controls (25%) (P = 0.04) [Table 1]. In univariate analysis, a positive QFG‑IT result was most closely associated with a history of prior TB (P = 0.03)
and chest X‑ray changes consistent with old TB (P = 0.01). On multivariate analysis, patients with a positive QFG‑IT result were significantly more likely to have had chest X‑ray changes consistent with old TB (P = 0.013) [Table 3].
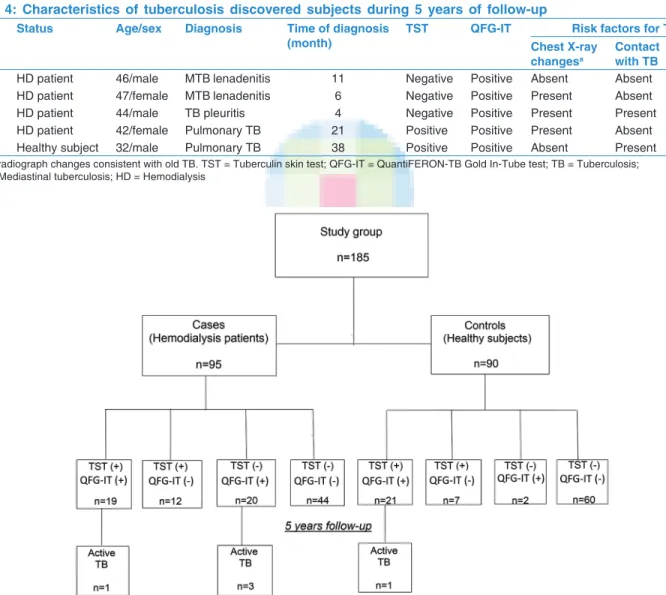
Follow‑up and progression to active tuberculosis
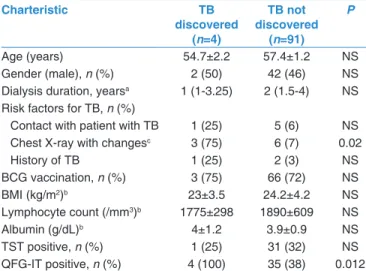
In total, 185 patients were followed up for 906.6 person‑years (pys); the mean follow‑up time was 4.9 years (58.8 months). Four HD patients and one healthy control developed active TB [Table 4 and Figure 1]. The overall rate of development of active TB disease in this study cohort was 0.55 cases/100 pys (95% confidence interval 0.34–5.06). This rate was higher in HD patients than healthy control (0.87/100 pys vs. 0.22/100 pys), but the difference was not statistically significant (P = 0.43). For active TB discovered subjects, QFG‑IT was positive in all, but TST was positive in two (one HD patient and one healthy control). Extrapulmonary presentations of TB were noted in 3 of 4 (75%) HD patients; these were pleuritis (n = 1) and mediastinal lymphadenitis (n = 2). One HD patients and one healthy control progressed to cavitary pulmonary TB [Table 5].
Among HD patients, the ratio of QFG‑IT positivity (P = 0.012) and chest X‑ray changes consistent with old TB (P = 0.02) were significantly high in active TB developed patients [Table 5]. In HD patients, the sensitivity, specificity, and positive and negative predictive values of the QFT and TST for detection of active TB were 100% and 25%, 62% and 67%, 10% and 3%, and 100% and 95%, respectively. Receiver operating curve analysis revealed that the results of the two tests differed significantly (area under the curve: 0.86 and 0.50, respectively,
P = 0.04) [Figure 2].
Discussion
Accurate diagnosis of LTBI in HD patients is important to prevent acute MTB infection, particularly because HD units
per se contribute significantly to the spread of infectious TB.[17]
The sensitivity and specificity of the TST routinely used to diagnose LTBI are low in HD patients.[4] Recent studies have
shown that the QuantiFERON‑TB‑Gold (QFT‑G) is superior to the TST in such patients.[7‑10] We explored the utilities of the TST
and QFG‑IT in terms of predicting the development of active
Table 2: Univariate and multivariate analysis of risk factors for a positive tuberculin skin test
TST positive
(n=31) TST negative (n=64) analyisis (P)Univariate Multivariate analysis (P) OR (95% CI)
Age (years)a 54±1.2 57±1.5 NS
Gender (male) (%) 16 (51) 28 (43) NS
History of BCG vaccination (%) 27 (87) 42 (65) 0.02 0.032 4.5 (0.08-0.84)
Time on dialysis (years)b 2 (1.5‑5) 2 (1.1‑4) NS NA
Risk factors for TB (%)
Previous contact with TB 2 (6) 4 (7) NS
History of TB 1 (3) 2 (3) NS
Chest X‑ray with changesc 4 (12) 5 (8) NS
BMIa 25±4.3 24±4.1 NS
Albumin (g/dL)a 4±0.7 3.9±0.3 NS
Lymphocyte count (/mm3)a 1890±600 1695±660 0.14 0.19 0.6 (0.3-3.1)
aResults given as mean±SD, bResults given as median (quarter intervals), cChest radiograph changes consistent with old TB; n = Number of cases; OR = Odds ratio;
CI = Confidence interval; BCG = Bacillus Calmette–Guerin; TB = Tuberculosis; TST = Tuberculin skin test; BMI = Body mass index; NS = Statistically nonsignificant; NA = Nonavailable; SD = Standard deviation
TB over a 5‑year period in healthy controls and HD patients.
We found that QFG‑IT positivity was significantly higher than TST positivity and that the QFG‑IT was better than the TST in terms of predicting TB development in HD patients.
Figure 1: Patients and controls recruited into the study, their TST, QFG‑IT results and TB developed subjects. TB: Tuberculosis, QFG‑IT: QuantiFERON‑TB Gold In‑Tube test,
TST: Tuberculin skin test
Table 3: Univariate and multivariate analysis of risk factors for a positive QuantiFERON-Tuberculosis Gold In-Tube test
QFG-IT
positive (n=39) negative (n=56)QFG-IT analysis (P)Univariate Multivariate analysis (P) OR (95% CI)
Age (years)a 57±1.4 56±1.2 NS
Gender (male) (%) 19 (48) 25 (44) NS
History of BCG vaccination (%) 32 (82) 37 (66) 0.10 0.17 1.8 (0.16-1.3)
Time on dialysis (years)b 2 (1‑5) 3 (1‑4) NS
Risk factors for TB (%)
Previous contact with TB 3 (8) 3 (5) 0.15 0.2 1.6 (0.7-1.7)
History of TB 2 (5) 1 (2) 0.03 0.26 1.2 (0.05-2.1)
Chest X‑ray with changesc 6 (15) 3 (5) 0.01 0.013 6.1 (0.05-0.7)
BMIa 23.9±4.0 24.3±4.2 NS
Albumin (g/dL)a 3.9±0.3 4.09±0.3 NS
Lymphocyte count (/mm3)a 1728±587 1805±693 NS
aResults given as mean±SD, bResults given as median (quarter intervals), cChest radiograph changes consistent with old TB. BMI = Body mass index; n = Number
of cases; OR = Odds ratio; CI = Confidence interval; BCG = Bacillus Calmette–Guerin; TB = Tuberculosis; QFG-IT = QuantiFERON-TB Gold In-Tube test; SD = Standard deviation; NS = Statistically nonsignificant
Table 4: Characteristics of tuberculosis discovered subjects during 5 years of follow-up
Cases Status Age/sex Diagnosis Time of diagnosis
(month) TST QFG-IT Chest X-ray Risk factors for TB changesa Contact with TB History of TB
1 HD patient 46/male MTB lenadenitis 11 Negative Positive Absent Absent Present
2 HD patient 47/female MTB lenadenitis 6 Negative Positive Present Absent Absent
3 HD patient 44/male TB pleuritis 4 Negative Positive Present Present Absent
4 HD patient 42/female Pulmonary TB 21 Positive Positive Present Absent Absent
5 Healthy subject 32/male Pulmonary TB 38 Positive Positive Absent Present Absent
aChest radiograph changes consistent with old TB. TST = Tuberculin skin test; QFG-IT = QuantiFERON-TB Gold In-Tube test; TB = Tuberculosis;
The TST is very sensitive in immunocompetent individuals. However, in immunocompromised populations, sensitivity declines in parallel with the decrease in cellular immune system function.[18] TST sensitivity is low in HD patients;
uremia is a well‑known risk factor for impairment of the cellular immune response, explaining the lack of sensitivity.[4,19] One disadvantage of using the TST to
diagnose TB or LTBI is false‑positivity caused by BCG vaccination.[4] The high prevalence of such vaccination
in Turkey has significantly reduced the utility of the TST because the PPD cross‑reacts with the BCG vaccine. In this study, the LTBI prevalence in HD patients detected using the TST was significantly lower than that detected using the QFG‑IT (32% vs. 41%). Moreover, as previously reported, we found that the most significant factor affecting TST positivity in HD patients was a history of BCG vaccination. Thus, as
previously found, the diagnostic utility of the TST in terms of LTBI was low in HD patients.
A new in vitro IGRA test, the QFT‑G (Cellestis Limited, Carnegie, Australia) has received final US Food and Drug Administration approval for use in LTBI diagnosis.[6] Because this IFN‑γ‑elicitation
test is highly specific, the ESAT‑6/CFP‑10‑based QFT‑G better discriminates between true infection and cross‑reactivity, eliminating the (unpredictable) influence of BCG and NTM on TST findings. IGRAs have been used to study various types of immunocompromised patients, including those with HIV infection undergoing HD and those with silicosis or cancer.[7‑10,20‑22] Although IGRA responses are slightly lower
in immunosuppressed than immunocompetent individuals, the IGRA positivity rate is substantially higher than the TST positivity rate.[21] The QFT‑G has been shown to be superior
to the TST in the evaluation of HD patients.[7‑10] Some studies
found that IGRA data correlated better with LTBI risk factors than did TST results.[9,10] In univariate analysis, the risk factor
for LTBI diagnosis in HD patients was QFG‑IT positivity, suggesting that the QFG‑IT better detects TB risk factors. In addition, the QFG‑IT was more accurate than the TST in terms of LTBI diagnosis in HD patients (41% vs. 32%, respectively). Thus, the QFG‑IT detected and diagnosed LTBI more effectively than did the TST.
TB remains a significant problem in patients undergoing long‑term HD. Such patients are at a 6–16‑fold higher risk of development of active TB than the general population, especially in developing countries.[3,23] This risk is attributable
to an increased likelihood of progression from LTBI to active disease, probably because cell‑mediated immunity is impaired in those with end‑stage renal disease (ESRD).[2] Only one
prior study used both the TST and the QFT‑G to predict the development of active TB in HD patients.[9] In the cited work,
64 subjects (32 in a healthy group and 32 in an HD patients group) were followed up for 2 years after testing in terms of the development of active TB. The TST was positive in 62.5% of patients and 46.9% of healthy subjects, and the QFT‑G was positive in 40.0% of patients and 12.0% of healthy subjects. Active TB developed in only two patients. The sensitivity, specificity, and positive and negative predictive values of the QFT‑G were 100.0%, 62.1%, 8.3%, and 100.0%, respectively. However, it was concluded that the QFT‑G was not notably superior to the TST when used to predict active TB. In this study, the TST positivity rate in HD patients and healthy controls was 32% and 31%, respectively, while the QFG‑IT positivity rate was 41% and 25%, respectively. The sensitivity, specificity, and positive and negative predictive values of the QFG‑IT were 100%, 62%, 10%, and 100%, respectively. Four patients developed active TB; the QFG‑IT result of all four was positive, whereas the TST was positive for only one patient. In addition, in three HD patients developed active TB, TST was negative, whereas among QFG‑IT result was negative patients, active TB was not developed in any. In addition, the QFG‑IT was superior to the TST when used to predict the development of active TB in HD patients. Our findings suggest that, in HD patients, QFG‑IT did better than TST in detecting LTBI and predicting active TB.
Active TB in HD patients is often extrapulmonary (50–85% of patients) and difficult to diagnose. Initiation of curative
Table 5: Comparison of the characteristics of tuberculosis discovered and not discovered hemodialysis patients Charteristic TB discovered (n=4) TB not discovered (n=91) P Age (years) 54.7±2.2 57.4±1.2 NS Gender (male), n (%) 2 (50) 42 (46) NS
Dialysis duration, yearsa 1 (1‑3.25) 2 (1.5‑4) NS
Risk factors for TB, n (%)
Contact with patient with TB 1 (25) 5 (6) NS Chest X‑ray with changesc 3 (75) 6 (7) 0.02
History of TB 1 (25) 2 (3) NS BCG vaccination, n (%) 3 (75) 66 (72) NS BMI (kg/m2)b 23±3.5 24.2±4.2 NS Lymphocyte count (/mm3)b 1775±298 1890±609 NS Albumin (g/dL)b 4±1.2 3.9±0.9 NS TST positive, n (%) 1 (25) 31 (32) NS QFG-IT positive, n (%) 4 (100) 35 (38) 0.012
aResults given as median (quarter intervals), bResults given as mean±SD, cChest radiograph changes consistent with old TB. n = Number of cases;
BCG = Bacillus Calmette–Guerin; TB = Tuberculosis; BMI = Body mass index; QFG-IT = QuantiFERON-TB Gold In-Tube test; TST = Tuberculin skin test; NS = Statistically nonsignificant; SD = Standard deviation
Figure 2: Receiver operating curve curves showing predictive value of TST and
QFG‑IT in active tuberculosis development in HD patients. QFG‑IT: QuantiFERON‑ tuberculosis Gold In‑Tube test, TST: Tuberculin skin test
treatment may be delayed, the period of potential transmission from pulmonary cases can be prolonged, nonspecific symptoms mimicking uremia may develop, and mortality may increase.[24]
Several studies have found that nonspecific symptoms at presentation in patients with extrapulmonary TB can delay diagnosis.[23,25] Extrapulmonary TB usually presents as
lymphadenitis and peritonitis.[23] In our study, three of our four
patients diagnosed with active TB during the 5‑year follow‑up period had extrapulmonary manifestations (mediastinal TB lymphadenitis, two cases; pleuritis, one case). Because extrapulmonary TB is common in HD patients, and because presentation may be nonspecific, a high index of suspicion is required when screening for TB; invasive interventions may be required.
Many active TB cases develop during the 1st year of dialysis,[3,23]
probably because of the poor general health status of some patients at the commencement of HD, when immunity may be most profoundly depressed. The pathogenesis of TB in longer‑term (>1 year) HD patients differs from that in uremic patients. Although a uremic status improves on maintenance HD, the progression of comorbidities is associated with a risk of active TB development.[24] Poorly controlled
diabetes, the progression of malignancies, and the use of immunosuppressive agents have been recorded in patients with longer HD durations.[24] These results are consistent
with the current findings.[23,25] Of the patients with active TB,
75% developed TB during the 1st year of dialysis.
Among patients with LTBI, groups at high risk for the development of active TB include those with advanced HIV infection, those with lesions suggesting old healed TB on chest radiographs, those with CRF, those with poorly controlled diabetes, those with silicosis, those who are underweight (>10% below normal), and those who have undergone gastrectomies.[26] Among these, the presence of
radiographic lesions consistent with old healed TB is one of the strongest risk factors for the development of active TB.[26]
Our study confirmed that the presence of radiographic lesions consistent with old healed TB is significant risk factors for the development of active TB in HD patients.
Our study has some limitations. First, as an inevitable limitation, there is no gold standard for LTBI. Second, in our study, TB risk factors, such as a history of TB or contact with TB cases at home or work, were evaluated from the history. History data of the subjects may have been affected by limitations in the patient recall. Finally, the treatment of LTBI in ESRD patients is not currently a part of the TB control program in Turkey. Hence, we did not treat LTBI detected HD patients prophylactically.
Conclusion
We suggest that QFG‑IT positivity is more sensitive than TST in the prediction of the development of active TB in HD patients. Hence, LTBI diagnosis using QFG‑IT in HD patients and prophylactic treatment of QFG‑IT positive ones is recommended.
Acknowledgment
The English in this document has been checked by at least two professional editors, both native speakers of English.
For a certificate, please see: http://www.textcheck.com/ certificate/8aNHac.
Financial support and sponsorship
Nil.
Conflicts of interest
There are no conflicts of interest.
References
1. Dye C, Scheele S, Dolin P, Pathania V, Raviglione MC. Consensus statement. Global burden of tuberculosis: Estimated incidence, prevalence, and mortality by country. WHO Global Surveillance and Monitoring Project. JAMA 1999;282:677‑86.
2. Christopoulos AI, Diamantopoulos AA, Dimopoulos PA, Gumenos DS, Barbalias GA. Risk of tuberculosis in dialysis patients: Association of tuberculin and 2, 4‑dinitrochlorobenzene reactivity with risk of tuberculosis. Int Urol Nephrol 2006;38:745‑51.
3. Dobler CC, McDonald SP, Marks GB. Risk of tuberculosis in dialysis patients: A nationwide cohort study. PLoS One 2011;6:e29563.
4. Lee E, Holzman RS. Evolution and current use of the tuberculin test. Clin Infect Dis 2002;34:365‑70.
5. Andersen P, Munk ME, Pollock JM, Doherty TM. Specific immune‑based diagnosis of tuberculosis. Lancet 2000;356:1099‑104. 6. Mazurek GH, Villarino ME; CDC. Guidelines for using the
QuantiFERON‑TB test for diagnosing latent Mycobacterium tuberculosis infection. Centers for Disease Control and Prevention. MMWR Recomm Rep 2003;52:15‑8.
7. Grant J, Jastrzebski J, Johnston J, Stefanovic A, Jastrabesky J, Elwood K, et al. Interferon‑gamma release assays are a better tuberculosis screening test for hemodialysis patients: A study and review of the literature. Can J Infect Dis Med Microbiol 2012;23:114‑6.
8. Ferguson TW, Tangri N, Macdonald K, Hiebert B, Rigatto C, Sood MM, et al. The diagnostic accuracy of tests for latent tuberculosis infection in hemodialysis patients: A systematic review and meta‑analysis. Transplantation 2015;99:1084‑91. 9. Lee SS, Chou KJ, Su IJ, Chen YS, Fang HC, Huang TS, et al.
High prevalence of latent tuberculosis infection in patients in end‑stage renal disease on hemodialysis: Comparison of QuantiFERON‑TB GOLD, ELISPOT, and tuberculin skin test. Infection 2009;37:96‑102.
10. Winthrop KL, Nyendak M, Calvet H, Oh P, Lo M, Swarbrick G, et al. Interferon‑gamma release assays for diagnosing Mycobacterium tuberculosis infection in renal dialysis patients. Clin J Am Soc Nephrol 2008;3:1357‑63.
11. Centers for Disease Control (CDC). Use of BCG vaccines in the control of tuberculosis: A joint statement by the ACIP and the Advisory Committee for Elimination of Tuberculosis. MMWR Morb Mortal Wkly Rep 1988;37:663‑75.
12. Canadian Tuberculosis Committee (CTC). Updated recommendations on interferon gamma release assays for latent tuberculosis infection. An Advisory Committee Statement (ACS). Can Commun Dis Rep 2008;34:1‑13.
13. Andrew OT, Schoenfeld PY, Hopewell PC, Humphreys MH. Tuberculosis in patients with end‑stage renal disease. Am J Med 1980;68:59‑65.
14. Tuberculosis in Turkey. In: Ozkara S, Aktas Z, Ozkan S, Ecevit H, editors. The Book of Tuberculosis Control in Turkey. Ankara: Rekmay; 2003. p. 9‑10.
15. Menzies D. Interpretation of repeated tuberculin tests. Boosting, conversion, and reversion. Am J Respir Crit Care Med 1999;159:15‑21.
120 Annals of Thoracic Medicine - Vol 11, Issue 2, April-June 2016 16. Cellestis. QuantiFERON s‑TB Gold Package Insert. Available
from: http://www.cellestis.com/IRM/content/PI/QFT/2PK/ AU.pdf. [Last cited on 2013 Dec 20].
17. Hickstein L, McPherson C, Kwalick D. Tuberculosis transmission in a renal dialysis center, Nevada, 2003. MMWR Morb Mortal Wkly Rep 2004;53:873‑5.
18. Huebner RE, Schein MF, Bass JB Jr. The tuberculin skin test. Clin Infect Dis 1993;17:968‑75.
19. Lonnemann G, Novick D, Rubinstein M, Dinarello CA. Interleukin‑18, interleukin‑18 binding protein and impaired production of interferon‑gamma in chronic renal failure. Clin Nephrol 2003;60:327‑34.
20. Ringshausen FC, Nienhaus A, Schablon A, Torres Costa J, Knoop H, Hoffmeyer F, et al. Frequent detection of latent tuberculosis infection among aged underground hard coal miners in the absence of recent tuberculosis exposure. PLoS One 2013;8:e82005. 21. Redelman‑Sidi G, Sepkowitz KA. IFN‑γ release assays
in the diagnosis of latent tuberculosis infection among
immunocompromised adults. Am J Respir Crit Care Med 2013;188:422‑31.
22. Wyndham‑Thomas C, Dirix V, Schepers K, Martin C, Hildebrand M, Goffard JC, et al. Contribution of a heparin‑binding haemagglutinin interferon‑gamma release assay to the detection of Mycobacterium tuberculosis infection in HIV‑infected patients: Comparison with the tuberculin skin test and the QuantiFERON‑TB Gold In‑tube. BMC Infect Dis 2015;15:59. 23. Chou KJ, Fang HC, Bai KJ, Hwang SJ, Yang WC, Chung HM.
Tuberculosis in maintenance dialysis patients. Nephron 2001;88:138‑43.
24. Venkata RK, Kumar S, Krishna RP, Kumar SB, Padmanabhan S, Kumar S. Tuberculosis in chronic kidney disease. Clin Nephrol 2007;67:217‑20.
25. Segall L, Covic A. Diagnosis of tuberculosis in dialysis patients: Current strategy. Clin J Am Soc Nephrol 2010;5:1114‑22. 26. Horsburgh CR Jr. Priorities for the treatment of latent tuberculosis