-H6
■
5 ^ 0 6 - S
• 1 6 8 A 3 5 . ?I 3 3 i
'W i.imim
iWrW^^^t·
«■•UBMITTSB T O T
33
S ?AC'.0
'LTY €¿6
' M.AM.A0
SM.11
'ITGSADUA7Y· SCMOCC OF BtiS-iMSS® AIMIMiSTiLlTIOiC
OB 'MLKJSJ^
Um'^^lLSSTY31·^ PARTIAL FOLFILİJ£S^ΓΓ OF THE RBQULSLSMSKTS
F031 T M E D E G i l B S C F
MASTER OF BUSINESS ADMXMSSTSATION
,r-;i :;^,/ ;j:·
i
PRICING
OF
INITIAL PUBLIC OFFERINGS
A THESIS
SUBMITTED TO THE FACULTY OF MANAGEMENT
AND
GDADUATE SCHOOL OF BUSINESS ADMINISTRATION
OF BiLKENT UNIVERSITY
IN PARTIAL FULFILLMENT OF THE REQUIREMENTS
FOR THE DEGREE OF
MASTER OF BUSINESS ADMINISTRATION
.
BY
VUSLAT AKKA§OGLU
FEBRUARY 1992
А Ъ 5 3
1 c e r t i f y t h a t I h a v e r e a d t h i s t h e s i s a n d in m y o p i n i o n it
is f u l l y a d e q u a t e , in s c o p e a n d q u a l i t y , as a t h e s i s fo r t h e
d e g r e e of M a s t e r of B u s i n e s s A d m i n i s t r a t i o n .
As^iist.
pjcoi.
, 3üi,nur S e n g ü lI c e r t i f y t h a t I h a v e r e a d t h i s t h e s i s a n d in m y o p i n i o n it is f u l l y a d e q u a t e , in s c o p e a n d q u a l i t y , as a t h e s i s f o r t h e d e g r e e of M a s t e r of B u s i n e s s A d m i n i s t r a t i o n . A s s o c . P r o f . K ü r s a t A y d o § a n I c e r t i f y t h a t I h a v e r e a d t h i s t h e s i s a n d in m y o p i n i o n it( 1 is f u l l y a d e q u a t e , in s c o p e a n d q u a l i t y , as a t h e s i s f o r t h e d e g r e e of M a s t e r of B u s i n e s s A d m i n i s t r a t i o n . A s s o c . P r o f . G ö k h a n C a p o g l u A p p r o v e d f o r t h e G r a d u a t e S c h o o l of B u s i n e s s A d m i n i s t r a t i o n P r o f . D r . S u b i d e y T o g a n y
OZET ABSTRACT ACKNOWLEDGEMENTS 1.INTRODUCTION 2. LITERATURE SURVEY 3. RESEARCH METHODOLOGY
3.1 THE PURPOSE OF THE STUDY 3.2 ASSUMPTIONS OF THE STUDY 3.3 THE METHODOLOGY OF THE STUDY 3.4 TIME PERIOD OF THE STUDY 3.5 SOURCES OF DATA
3.6 LIMITATIONS OF THE STUDY 3.7 HYPOTHESES
3.7.1 TIME PERIODS
3.8 ADJUSTMENTS TO CAPITAL INCREASES 3.9 TESTING THE FIRST HYPOTHESIS 3.10 TESTING THE SECOND HYPOTHESIS 3.11 THE SAMPLE TABLE OF CONTENTS ii i i i 1 5 13 13 14 15 17 18 18 19
20
2122
26 28i
4.FINDINGS AND DISCUSSION 30
4.1 FINDINGS RELATED TO TESTING OF THE FIRST HYPOTHESIS 31 4.1.1 IPO PERFORMANCE FROM OFFERING TO FIFTH DAY IN THE SECONDARY
MARKET 31
4.1.2 IPO PERFORMANCE FROM OFFERING TO FIFTH FRIDAY IN THE SECONDARY
4.1.3 IPO PERFORMANCE FROM OFFERING TO SIXTH MONTH IN THE SECONDARY
MARKET 37
4.2 FINDINGS RELATED TO TESTING OF THE SECOND HYPOTHESIS 40
5.CONCLUSION 45
APPENDIX REFERENCES
ÖZET
i l k h a l k a ARZIN PIYATLAHASI
VUSLAT AKKAS05LU
Yüksek Lisans Tezi, isletme Enstitüsü
Tez Yöneticisi : Yardımcı Doç. Dr. GüLNUR SENGüL
Şubat 1991
Bu çalışmanın amacı İstanbul Menkul Kıymetler Borsasında Ocak 1990- Nisan
1991 döneminde halka arz edilen hisse senetlerine yatırım yapanların
piyasaya kıyasla kısa ve orta vadede ne oranda getiri sağladıklarını
incelemektir. Buna ek olarak, piyasanin değerinden farklı fiyatlamaya
ayarlama hızı da araştırılmıştır.
Bulunan verilerin ışığında, halka arz edilen hisse senetlerinin düşük
fiyatlandırıldığı ve bu hisse senetlerine yatırım yapanların kısa
dönemli, piyasanin üstünde getiriler elde edebileceği saptanmistir.
Piyasanın .değerinden farklı fiyatlamaya fiyat ayarlamasının,hisse senedi
halka arz edildikten sonra ilk iki gün içinde gerçekleştiği, ayarlamanın
A B S T R A C T
PRICING OF INITIAL PUBLIC OFFERINGS BY
V U S L A T A K K A S O S L U
SUPERVISOR: ASSOC. PROF. G u L N U R S E N G u L F E B R U A R Y 1991
The p u r p o s e of this study is to examine how investors in n ew s t ock issues have fared relative to the rest of the stock mar k e t both in short and in medium term in Istanbul Stock E x c h a n g e during the period J a n u a r y 1990-April 1991. Furthermore, the sp e e d of market adjustment to mispricing is also examined.
In light of the findings, initial public offerings are found to be underpriced and investors in initial public offerings could enjoy short term r e t urns relative the rest of the stock market. T he m a r k e t adjustment to mispricing is o b s e r v e d to be accomplished during the first two d£iys of public trading with the bulk of the adjustment being in the first day.
ACKNOWLEDGEMENTS
I a m g r a t e f u l to A s s i s t . P r o f . G ü l n u r S e n g ü l f o r h e r s u p e r v i s i o n a n d c o n s t r u c t i v e c o m m e n t s t h r o u g h o u t t h e s t u d y . I w o u l d a l s o l i k e to e x p r e s s m y t h a n k s to A s s o c . P r o f . K ü r s a t A y d o ğ a n a n d A s s o c . P r o f . G ö k h a n C a p o ğ l u f o r t h e i r c o n t r i b u t i o n . I a l s o t h a n k to m y f a m i l y f o r t h e i r c o n t i n o u s s u p p o r t a n d p a t i e n c e d u r i n g t h e p r e p a r a t i o n of t h i s t h e s i s a n d t h r o u g h o u t m y life.1
i1
1. INTRODUCTION:
The capital market is a mechanism enabling those who want to borrow to
issue claims which can then be taken up by those with -funds to lend. The
mechanism which involves the issue o-f -financial liabilities by de-ficit
units gives rise to what is now called the primary market.
One o-f the important aspect o-f the work o-f the primary market is to
ensure that savings are directed towards the most productive or
profitable use, that is the market should be allocatively efficient. For
the issuer of shares this means posing the question as to what price
should be fixed for the offer. As with the sale of any new product there
is a case for offering the shares at a discount to the prices of existing
securities in order to stimulate demand.
An understanding of the market for initial public offerings (IPOs) is
important for investors and underwriters as well as for financial
managers. The investor in the IPO either is "informed" ex ante about the
after market equilibrium price or is "uninformed". If an IPO is
underpriced, informed traders will enter orders for the issue, causing
the issue to most likely be oversubscribed and thereby requiring an
allocation or rationing of the issue. Uninformed investors will thus
receive some rationed amount in response to their orders. On the other
0- f-fering, leaving only uninformed traders to absorb the overpricing.
Underwriters, also should understand the IPO market in order to reduce
their risks and costs of underwriting. Ending up with an unsuccessful
new issue will cause bad reputation on the side of the underwriters ,as
well as cause huge losses.
In addition, financial managers of non public firms may need IPO market
in the future. They may attempt to fulfill some of their planned capital
needs by public offering. Firms are more willing to spin off divisions to
their current stockholders or allow managers to put together a leveraged
buy-out that may eventually go public.
So, the understanding of the pricing of new stock issues are important
for the three interest groups mentioned above. A priori expectations are
for a downward bias in the pricing of new stock issues. The reasons are
as follows:
1- Etecause of the unseasoned nature of the issue, the underwriter is
uncertain about the public evaluation of the firms past earnings stream
as well as the corporation outlook.
E- The probability that the issue will be "successful" is much higher if
it is somewhat underpriced. In this context "successful" is defined as an
some increase in price soon after the ottering. Such an ottering results
in satisfied customers tor the underwriter as well as satisfied corporate
stockholders.
3- A successful issue is one that sells quickly. In addition to satisfied
customers, quick sale is important to the underwriter from reasons of
rapid turnover of their capital.
The only constraint to the underpricing of an issue is the possible
complaint by the issuing corporation that it could have received more
capital from the issue. Such concern is minimized by the following:
a- The new stockholders are satisfied with their purchase of the
"successful" issue.
b- Corporations do not attempt to fulfill all of their planned capital
needs in the initial offering. They know that they can float future stock
issues at a higher price to a satisfied stockholder group and possibly an
eager public.
Focusing our view on Türkiye, increasing interest on the Istanbul Stock
Exchange (ISE) gave rise to an improvement in the primary markets. The
most striking phenomena among all the developments is the increasing
tendency of the corporations to make new issue public offerings as well
implications since it brought about a new dimension to the supply side of
the market, namely the issuance of shares as underpriced or overpriced
a.
LITERATURE SURVEY:Several studies examining the price behavior o-f initial public o-f-ferings
(IPOs ) have been done. They have set different hypothesis and used
different methodologies. The most relevant research for the present study
will be listed below.
J .6.McDonald and A.K.Fisher (1978) investigated the price behavior of
unseasoned new issues of common stock immediately following the offering
and over the subsequent year during the period 1969-1970. They suggested
that the short run price adjustment after the offering should be
continued through the long run as the market continues to recognize and
adjusts for underpricing.
As a market measure the return on the over the counter measure of the
National (3uotation Bureau was used.
An excess return, Ujt, is computed for each stock in each period,
ujt = R^t - R ,t
where Rjt =Return on stock j in period t.
R|t =Return on OTC average in same period.
Same modeling is used to find excess return on each offering in this
The general problem of adjusting for market-wide movements in security
prices on individual common stock returns has received considerable
attention. One useful procedure is to estimate the parameters of the
Sharpe -Lintner -Mossin Capital Asset Pricing Model for each security and
to interpret the residgal in each period, eit ,as an "abnormal return" on
stock j ;
Rjt = aj + bj Rmt + ejt (1)
Rjt = the return on security i
Rmt = return on a general market index
aj , b j = intercept and slope of linear function.
ejt = the error term.
As the data files in McDonald and Fisher's study contained few
observations of price for each unseasoned new issue, estimation of
coefficients aj and bj for each security was not applicable. As a useful
adhoc adjustment for market effects on new issue returns, the difference
between security and market returns is computed in equation stated above,
where the O.T.C. average represents the market index most representative
of the O.T.C. population from which new issues are drawn. If for each new
issue stock aj equals zero and bj equals one in the equation above, that
is non-diversifiable risk of each new issue is the same as that of the
O.T.C. average, then equation (1) is consistent with the capital asset
pricing model. One would expect, however, that intei— firm differences in
exceeds one, i.e., that most new issues are riskier than the thirty -five
stocks in the O.T.C. average.
The result, then, is that the transformation of stock returns to excess
returns in equation (1) serves to adjust roughly for market effects on
new issue returns to investors. Market effects on IPOs in ISE is assumed
to be contained in excess return u H just like McDonald and Fisher's
study.
The findings indicated significantly large returns for the initial
subscribers, adjusted for market effects, in the first week following the
offering. The evidence supports the efficient market notion of rapid
adjustment of prices to available information, so that subsequent returns
from the first week to end of first year were not different for issues
with large initial price increases as compared with returns on new issues
as a whole.
Frank K.Reilly and Kenneth Kalfield (1%9) examined how investors in new
issues have fared relative to the rest of the stock market. It is
hypothesised that underwriters will have a downward bias in their pricing
of new stock issues and therefore, investors in new stock issues should
enjoy superior short and long term returns relative to the rest of the
market.
percentage price changes for the new issues during the periods specified
relative to percentage price changes in various stock, market price
indicators, which is in line with the formulation used in this thesis.
The total period covered by the study extended from December 3, 1963 to
June 14, 1966. The sample comprised of 53 new stock issues sold during
December 1963 to August 1964 and January 1965 to June 1965.
All tests done by Reilly and Hatfield showed superior short run and long
run results for the investor in new stock issues. Although the number of
new issues experiencing superior price changes was not significant, the
relative size of the gains was always substantially higher than the size
of relative losses. Therefore research results consistently supported
their hypothesis that investors in new stock issues should enjoy superior
short and long term returns relative to the market.
This present study is smiliar to the studies done by Frank K. Reilly and
Kenneth Hatfield in terms of hypothesis and methodology, but different
from them in terms of time period covered and the firms studied. The
former examined 53 new stock issues in New York Stock Exchange (NYSE)
with period covered from December 3, 1963 to June 14, 1966. This study
examines the 35 stocks that are initially offered in Istanbul Stock
Robert E. Miller and Frank K. Reilly (1937) re_examine the speed
oi
market adjustment to mispricing and -further explore the relationship o-funderpricing to uncertainty. They considered initial public o-f-ferings
with an initial price o-f 1$ or more, for 510 stocks traded in New York
Stock Exchange during the period 19SS-19S3.
The return results for the first five days of trading for the entire
group of stocks are examined. The results revealed that the adjustment to
both types of mispricing takes place during the first trading day, with
no significant returns occurring on any of the subsequent days.
In this study the methodology applied to test the speed of market
adjustment to mispricing is smiliar to studies done by Robert E. Miller
and Frank K. Reilly (1987) while the time period covered and the
firms studied are different.
Seha M. Tinic (1988) presents a brief review of theories that have been
suggested to explain underpricing of initial public offerings.
A .Risk-Averse-Underwriter Hypothesis
A popular explanation for underpricing of unseasoned equity is based on
risk aversion of underwriters: investment bankers purposely underprice
new common stocks to reduce their risks and costs of underwritinq. In
ending up with an unsuccessful issue and the associated losses. Although
it may have some superficial appeal, this explanation is not very
satisfactory. It fails to address why issuers do not insist on investment
bankers to adjust their underwriting spreads to compensate for the risks
of the offering.
B.Monopsony-Power Hypothesis
Some researchers-Ritter (1984) for example- have suggested that gross
underpricing may be a result of the monopsony power of the investment
bankers in underwriting common stocks of small speculative firms. Their
conclusions were based on the observation that large ,reputable
investment banking firms generally do not accept to underwrite common
stocks of small speculative start up firms. The IPOs of small firms are
underwritten by investment bankers who, for some unexplained reason, can
exercise greater bargaining power over the issuers. These investment
bankers intentionally underprice the securities and ration them to their
large customers who regularly buy a variety of investment services from
them. That is, underpriced issues would be allocated only to the favored
customers of the firm who regularly do business with the investment bank
and pay commissions or fees far in excess of the competitive rates. In
short the monopsony hypothesis maintains that the underwriters of IPOs
intentionally price the securities at a discount from their expected
values in the aftermarket because they can capture at least a fraction of
the rents indirectly.
C. Speculative -Bubble Hypothesis
Under this hypothesis, large excess returns o-f the IPOs are attributed to
the speculative appetites o-f investors who could not get allocations o-f
the oversubscribed new issues from the underwriters at the ottering
prices. That is, the ottering prices ot the issues were consistent with
their underlying economic values. However, the speculation in the atter-
market pushed their prices well above their intrinsic worth temporarily.
The speculative-bubble hypothesis would imply that the initial positive
excess returns ot the IPOs should be tollowed by negative excess returns
as the bubble bursts sometimes later. There is no evidence that supports
such a pattern.
D. Asymmetric-Intormation Hypotheses
In Rock's (1936) model the asymmetry ot intormation is between two groups
ot potential investors in the market:
a; the so called intormed investors, who invest in intormation production
and subscribe to IPOs only when they expect the attermarket price to
exceed the ottering price and
b; unintormed buyers who subscribe to every IPO indiscriminately. Since
there is always some uncertainty about the market prices at IPOs, it the
issuers and their investment bankers attempted to otter the securities at
their expected market clearing prices, the unin-formed investors would end
up purchasing disproportionately large shares o-f the overpriced issues.
In order to keep the uninformed investors in the IPO market, the
investment bankers have to offer the securities at discounts from their
expected after market prices. With systematic underpricing, the
uninformed buyers would earn a normal expected rate of return on the IPOs
allocated to them. That is their losses from the overpriced allocations
would be compensated by the excess returns on the underpriced issues that
3. RESEARCH METHODOLOGY:
3.1 THE PURPOSE OF THE STUDY:
On the basis of several strong arguments for underpricing and no
substantial constraints, it is hypothesized that underwrites will have a
downward bias in their pricing of new stock issues; and, therefore,
investors in new stock issues should enjoy superior short and long term
returns relative to the market. While a portion of the better than
average performance should be attained in the short run, it should be
continued through the long term as the market continues to recognize and
adjust for underpricing.
The purpose of this study is to examine how investors in new stock issues
have fared relative to the rest of the stock market both in short term
and in medium term, in the Turkish Stock Market. Long term results could
not be examined since for the S3 per cent of the sample at most up to six
months data was available. This paper provides insights to underpricing
mystery of IPOs but does not solve it. For purposes of completeness a
variety of conjectures that purport to explain the observed underpricing
in IPOs of common stocks is also mentioned in the Literature Survey
sect ion.
registered with the Capital Market Board (CMB) and o-f-fered to the public
for the first time during the period January 1990 to April 1991.
One objective is to measure the initial performance from the offering
date until the date when a public market (after market) is first
established and the stocks' performance in the secondary market is
observed.
The second objective is to examine the speed of market adjustment to
mispricing of IPOs.
3.2
ASSUMPTIONS OF THE STUDY:Assumptions of this study are listed below :
-In analysing whether the IPO performed well relative to the rest of the
stock market, Istanbul Stock Exchange Index(ISEI) is assumed to be an
indicator of the rest of the market. Although it is not possible for a
typical investor to form a portfolio consisting of stocks represented in
ISEI, as an alternative for an IPO, theoretically it is the most
resembling proxy for the performance of the market.
-The sample of IPOs studied consists of 35 stocks offered in the period
January 1990 -April 1991. Information about the population mean and
variance of the short and medium term net returns of IPOs would be
contained in the sample mean and variance. There-fore, the sample
information, which is summarized in the values of statistics computed
from the sample measurements, would be used to make inferences about the
sampled population in terms of its parameters.
-Examining the speed of adjustment to mispricing. Miller and Reilly
(1937) took the return results for the first five trading days in the
secondary market for each stock. Taking into account the inefficiencies
existing in Istanbul Stock Exchange, adjustment to mispricing is assumed
to take longer for the Turkish Setting. For purposes of accuracy, the
first seven trading days for each new public offering are examined.
3.3 THE METHODOLOGY OF THE STUDY:
The present study is an empirical investigation into the short term and
medium term performance of initial public offerings, relative to the
stock ma r k e t .
Timing effect on IPOs are not explored in this study as the model is
assumed to approximate market wide movements, but only the offerings are
classified in four periods (Appendix £) according to their offer date :
First period - 0 1 .January.1990 to OS.August.1990 when the Exchange was
in an up trend.
in a down trend.
Third period - S&.December.1990 to EG.February.1991 when the Exchange was
in an up trend.
Fourth period - after EG.February.1991 when the Exchange was in a down
trend.
ISEI starts first period with SEIS, second period with 5G15, third period
with S95S and fourth period with 5871 down to 3877 on 1 .August.91
Offerings also are classified in two sections; private issues and issues
by the public participation, with corresponding returns on fifth day from
offering, fifth friday and twenty fifth friday (Appendix 3).
The following hypothesis as provided by the literature is tested.
- underwriters will have a downward bias in their pricing of new stock
issues; and, therefore, investors in new stock issues should enjoy
superior short and medium term returns relative to the market.
This hypothesis is tested by the examination of percentage price changes
(adjusted for capital increases ) for the new issues during the period
specified relative to percentage price changes in stock market price
indicator, Istanbul Stock Exchange Index.
The significance of the results were tested by the Chi-Square test as
will be explained, in Research Methodology section.
The study also examines the speed of market adjustment to mispricing.
This is done by observing the net return^ results for the first seven
days of trading for the entire group of IPOs. The significance of the
results were tested by using t-test.
3.4 THE TIME PERIOD OF THE STUDY :
A sample of 35 initial public offerings registered to Capital Market
Board during the period January, 1990- April 1991 are taken. Twenty
seven of the offerings were made in 1990 where as S of them were made in
1991. The sample comprise of all the initial public offerings sold in
1990 and the ones sold till May 1991. (Last issue was sold on April 24,
1991 ). Issues offered in May and later months of 1991 could not be
included because of the time limitations of the study.
The total period covered by the study extended from January 3,1990 (when
the first new issue was sold) to June 16,1990 (when the last data was
available). The bulk of this period was a fluctuating market. Istanbul
Stock Exchange Index (ISEI) began the period at about 2318, reached a
peak of about 5750( on August 2,1990), and ended the period at about
3479. The effects of Gulf War was felt tremendously in this period.
‘F<:eturn cm IF'D minus return on I BE I for same time pericjcl.
3.5 SOURCES OF DATA ;
The sample o-f new public of-ferings is taken -from Capital Market Board
sources.
The daily stock prices, the ISEI, the data related to the rights oifering
D-f corporations are provided in a LOTUS 1S3 Spreadsheet -file by the CMB.
Missing daily stock prices in the Data File are completed from leading
financial newspapers.
3.6 LIMITATIONS OF THE STUDY :
- The present study comprises the period of 1990 - April 1991. The period
when the unfortunate Gulf War was experienced with all of it's dramatic
consequences on Türkiye. Observed market wide movements, as a result of
this war, should not be hold out of consideration. Although the model
use d ‘s in this study is shown to approximate the market wide movements, by
McDonald and Fisher (197E ), it may bring certain limitations to the
results of the present study.
“ Return results tor the initial public offerings are analyzed for the
short term and the medium term. Medium term results can be taken as a
proxy for the long term as long term results could not be studied due to
Li,t = RJ - R^t
data limitations.
- The time involved -for the -fitth -friday case varied -from twenty nine to
thirty three trading days depending on when the new issue was sold in its
•first week. Same variation is also true tor the twenty titth triday
period. While this means there was a variable time period between sample
observations, the comparisons between each new stock and the market
indicator ISEI are comparable relative to time.
-The stock market indicator used in this study was the composite index.
The industrial and the tinancial indices were not used.
- The purpose ot this study was to investigate whether IPOs are
underpriced or not, the reasons -for underpricing were not explored.
3.7 HYPOTHESES :
1.Initial Public 0-f-ferings are underpriced, so investors in new stock
issues should enjoy superior short and long term returns relative to the
market.
This hypothesis is also consistent with economic theory. Because o-f the
greater uncertainty involved in the new stocks, investors should look -for
a higher rate of return than -from other issues (Reilly and Hat-field,
1969)
S. Consistent with the Efficient Market Hypothesis market adjusts to
mispricing within a week after the initial offering. Seven days of
trading is accepted as a week in testing this hypothesis.
Determining the speed of market adjustment to mispricing is important as
it shows the right time period for the investors to benefit from
underpricing.
3.7.1 Time Periodsi
Daily return data for the first seven trading days in the secondary
market, the fifth trading day, the fifth friday and twenty fifth friday
(six month) returns from the first day in the secondary market are
analyzed.
The fifth trading day returns are examined, because they show the first
week performance of the stock in the aftermarket.
Fifth friday returns are examined, because they show the first month
performance of the stock in the aftermarket. It is assumed to show short
term performance of the IPOs.
One year return results are cited to show long term, in the
literature (McDonald and Fisher (197S),Reilly and Hatfield (1969)). One
year data for most of the stocks in the sample was not available. So, six
month's returns are calculated for the purpose of making medium term
estimations.
Since the IPOs are sold in the primary market at fixed prices, the time
periods are measured with respect to the stocks' first appearance in the
secondary market. As 69
%
of the stocks offering date and firstappearance in the secondary market are same, this brings no considerable
limitation to the study.
As a market measure the return on the ISEI was used. All reported returns
are net returns equal to the percent price change for the IPO minus the
percent price change in ISEI during the same time period. First day IPO
returns are calculated from the offering price to first day ending bid
price, with subsequent daily returns from bid to bid prices.
3.8 ADJUSTMENTS TO CAPITAL INCREASES
Daily return data of IPOs are obtained from CMB sources. The data file
contained daily ending bid prices of securities trading in Istanbul Stock
Exchange and ISEI for each day, for the years 1990 to May 1991.
Daily ending bid prices of securities needed to be adjusted for the
capital increases that might have occurred in the studied time periods
This was necessary for the healthy determination of return between any
two time period.
Data file containing the capital increases of the firms trading in ISE,
with corresponding date and related ratio figures are also obtained from
CMB.
The adjustments to capital increases are made as follows:
c =[ P (r + s ) - r (N) ] / P
where
r = "rights offering" ratio
5 = "stock dividend" ratio
N = nominal value of the stock
P = market price of the stock just before capital increase
The " c " value found is used to calculate the adjusted price of the
stock after the capital increase. All the effected prices of the stock
day by day, after the capital increases, are multiplied by this
coefficient " c
3.9 TESTING THE FIRST HYPOTHESIS:
Hypothesis:
Initial public offerings are underpriced, =,o investors in new slock
issues should enjoy superior short and long term returns relative to the
market.
The hypothesis to be tested stated in operational -form is set as
Ho : pi =pS =0.5
against
Ha : pi > 0.5
where
pi =the probability that a stock will outperform the market.
pE =the probability that a stock will not outperform the market.
Testing the Hypothesis:
The significance of the results was tested by chi-square test
X ^ = ( ni - npi / npi
where
ni = observed frequency for cell i (i=l,E)
npi = expected frequency
n = number of issues in sample
pi = 0.5 (since under purely random circumstances half of the issues
would outperform the market )
The chi-square test statistic for this case possesses 1 degrees of
freedom since the only linear restriction on the cell frequencies is;
nl + nE = 35
In addition to examining the number of new issues that gained or lost,
the extent of gains and losses experienced during the periods was also
considered.
An excess return, Ujt, is computed for each stock in each peri od I
Ujt =Rjt -R
JL
Rjt = the return on stock j in period t.
Rjt = the return on the ISEI in period t.
R jt is computed as;
[pjt - pj (t-l)3 / Pj (t-1)
Pj(t-l) = price of stock j on time t-1
p jt = price of stock j on time t
R |t is computed as;
[ mt - m(t-l) 3 / m(t-l)
m(t-l) = ISEI on time t-1
mt = ISEI on time t
As a market measure the return on the ISEI was used. All reported returns
are net returns equal to the percent price change for the IPO minus the
percent price change in ISEI during the same time period. First day IF'D
returns are calculated -from the o-f-fering price to -first day ending bid
price, with subsequent daily returns -from bid to bid prices.
IPOs that gained more or lost less than the stock market indicator were
considered to have outper-formed the market.
Time periods measured:
The comparison o-f new issue results compared to the overall
market are considered in three subsections consistent with the three time
periods. From o-f-fering to :
-Fi-fth day a-fter the stock first appeared in the secondary market. (One
week period as a representative of very short term).
-Fifth friday after the stock first appeared in the secondary market.
(One month period as a représentâtive of short term).
-Twenty-fifth friday after the stock first appeared in the secondary
market.(Six months period, as a representative of medium term)
For each of these time periods the following frequencies are calculated!
-number of new issues showing increases from offering price
-number of new issues showing decreases from offering price
-number of new issues showing no change from offering price
3.10 TESTING THE SECOND HYPOTHESIS:
The Hypothesis:
Consistent with the Et-ficient Market Hypothesis market adjusts to
mispricing within a week.
The null and alternative hypothesis set in operational -form -for total
sample :
Ho : ut = 0 against Ha : ut > 0
where
ut = average net return -for total sample
oi
stocks on day t (t = l to 7 days)For sample stocks that experienced negative returns on day one
Ho : ut = 0 against Ha : ut < 0
where
ut = average net return Tor sample
returns on day t (t =1..7)
stocks that experience negative
For sample stocks that experienced positive returns on day one
Ho : ut = 0 against Ha : ut > 0
where
ut = average net return tor sample stocks that experience positive
returns on day t (t =1..7)
For sample stocks that experience no change on day one
Ho : ut = 0 against Ha : ut <> 0
where
ut = average net return for sample stocks that experience no change on
day t (t =1..7)
Testing The Hypothesis:
To test these hypotheses a Student's t statistic is computed;
t = ut / < s / n
where
s = standard deviation of sample tested
n = sample size
Studied Time Periods:
Percent average net returns are calculated in four subsections:
-daily excess returns for total sample.
-daily excess returns for sample stocks that experienced positive returns
on day one.
-daily excess returns for sample stocks that experienced negative returns
on day one.
-daily excess returns for sample stocks that experienced no change on day
o n e .
H underpricing of new issues exists, one would expect a significantly
positive value of the initial rate of return; the average percent change
in price from the offering to the first published market price, adjusted
tor market effects.
3.11 THE SAMPLE :
Appendix 1 lists the companies included in the sample, the date of the
original offering, and the offering price as well as the ISEI on the day
of the offering.
The total sample consists of 35 initial public offerings taken from the
period 1990 - 1991. The offerings data are taken from the Capital Market
Board and the sample to be studied is formed on the following criteria.
1- Each offering, included in the sample, should be pure common stock
offering, being not offered previously.
2- Firms included in the sample should be alive and be presently traded
in the stock market.
3- Six months of security price data after the stock is offered needed
for medium term analysis. Some of the firms lack six months data but
included in the sample for reasons of not narrowing the sample too much.
This was necessary in order to drive healthy statistics from the sample.
about population.
4- Included o-fterings must have registered to the Capital Market Board.
Unregistered initial public o-f-ferings like Finansbank, Tekstilbank,
Garantibank and Demirbank are not included.
5- Of-fering price limitations tor -firms as a criteria was not brought.
This should again narrow the sample to be studied.
Following data records are extracted -from the data -files obtained from
CMB to construct the final data set.
- offering date and price of each initial public offering
- each stock's first trading day price in the secondary market
- each stock's prices for six days following the first trading day in the
secondary market.
- each stock's prices for the fifth and the twenty fifth friday after its
first appearance in the secondary market.
- ISEI for all the dates stock prices are recorded.
All prices are daily ending bid prices
These data are constructed into a LOTUS 183 spreadsheet file, and
further, necessary data adjustments are made.
4.FINDIN6S AND DISCUSSION :
Appendix
S
shows the return results of the stocks ottered during tourtime periods classitied. Although not tested statistically, the return
results tor the tour time periods were not observed to have a consistent
trend in line with the market trends descriptively. This can also be seen
in Table A.
Appendix 3 classities the return results ot the stocks in terms ot
public and private issues. Again we could not observe any consistency in
return results tor the two ditterent classitications.
•T A B L E A G F F E R I N G B D U R I N G 5 T H D A Y R E T U R N 5 T H F R I D A Y R E T U R N E 5 T H F R I D A Y R E T U R N F I R S T # O F ( + ) R E T U R N 4 6
Cj
P E R IOD # OF (- ) R E T U R N 7 5 ou.· ETECOND # OF ( + ) R E T U R N 11IE
11 P E R I O D # O F (-) R E T U R N 5 4 5 T H I R D # O F ( + ) R E T U R N OS
— P E R IDD # OF (-·) R E T U R N C)1
-F O U R T H □F (+) R E T U R N 35
P E R I O D # O F (-·■) R E T U R NE
0
—30
4.1.FINDINGS RELATED TO TESTING OF THE FIRST HYPOTHESIS:
In the -following three subsections, the new issue results compared to the
overall market are considered according to the time period studied.
4.1.1 IPO Per-formance From 0-ffering to Fi-fth Day in the Secondary Market
Table I contains the summary statistics derived -from a detailed analysis
o-f the data -from o-f-fering to -fi-fth trading day (very short term) in the
secondary market.
Table I shows the number o-f new issues showing increases from o-f-fering
price, number o-f new issues showing decreases from offering price, number
of new issues showing no change from offer price and more importantly,
how many of the stocks outperformed the market from the day of the
offering to the following fifth trading day in the secondary market. A
new issue stock was considered to have outperformed the market if it
gained more or lost less than the stock market indicator during the
period.
Table I shows that 57.14 percent of the issues experienced some immediate
premium. The premiums ranged from about 2 percent to 203.03 percent. In
contrast 22.35 percent of issues suffered immediate losses ranging from -
£7.777 percent to -20 per cent. The remaining 14 percent of issues
T a b l e I R E S U L T S B Y N U M B E R OF I S S U E S O N F I F T H D A Y IN T H E M A R K E T N u m b e r of n e w i s s u e s s h o w i n g i n c r e a s e s f r o m o f f e r i n g p r i c e ... 20
iB'A
to 2 0 3 . 3 % ) N u m b e r of n e w i s s u e s s h o w i n g d e c r e a s e s f r o m o f f e r i n g p r i c e ... S<.-1.7%
t o 20%) N u m b e r of n e w i s s u e s s h o w i n g no c h a n g e f r o m o f f e r i n g p r i c e ... 7 N u m b e r o f n e w i s s u e s o u t p e r f o r m i n g t h e ISEI ... 2 3 ( 6 4 . 7 % of total)While more than half of the issues (64.7 percent ) outperformed the
market indicator (ISEI ), it was necessary to determine whether this
proportion was significantly different from the a priori expectation that
under purely random circumstances half of the issues would outperform the
market. The significance of the results was tested by the chi-square
test,
X 2 = (f - e )2 /e
f = observed frequency
e = expected frequency
nl = stocks that have outperformed the market
riE = stocks that have not outperformed the market
In line with Reilly and Hatfield's (1969 )conclusion, we also, can
conclude that, the number of new issues that outperformed the market was
We can reject the null hypothesis at 90 per cent con-fidence level.
(X^ } £.7 ) . The hypothesis was supported by the number oT new issues
outperforming the market at 90 per cent confidence level.
In addition to examining the number of new issues that gained or lost,
the extent of gains and losses experienced during the period was also
considered to derive results related with the hypothesis. Table £
contains the results of this analysis. A relative loss indicates that
the new issue did not increase as much as the market or declined by more.
A relative gain means that the new issue increased by a greater percent
than the market or declined by less.
As shown in Table II below, the number of issues that did not do as good
as the market is IE; the average relative loss of these was about 11.S£
per cent.In contrast, the average relative gain for those new issues that
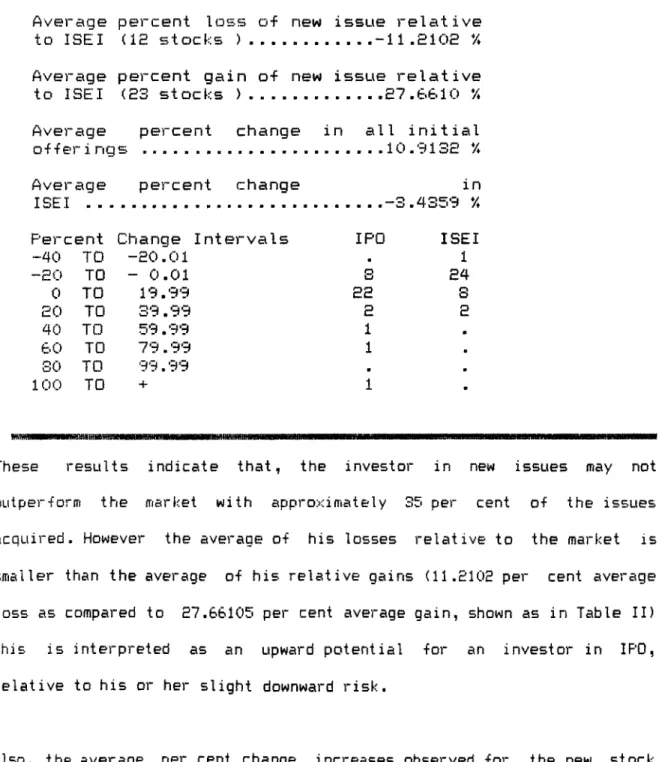
Table II PERCENT CHANGE RESULTS FROM OFFERING TO FIFTH
TRADING DAY IN THE MARKET
A v e r a g e p e r c e n t l o s s o-f n e w i s s u e r e l a t i v e to ISEI (IS s t o c k s ) ... - l l . E l O e */♦ A v e r a g e p e r c e n t g a i n o-f n e w i s s u e r e l a t i v e to ISEI (23 s t o c k s ) ... S 7 . 6 6 1 0 % A v e r a g e p e r c e n t c h a n g e in all i n i t i a l o-f-ferings ...1 0 . 9 1 3 S
'
/
*
A v e r a g e ISEI . . . p e r c e n t c h a n g e _o in . 4 3 5 9 */. P e r c e n t C h a n g e I n t e r v a l s I P O ISEI -40 T O - S O . 01 1 - S O T O - 0 .01s
S 4 0 T O 1 9 . 9 9s s
8
S O T O 3 9 . 9 9s
S 40 T O 5 9 . 9 9 1 m 6 0 T O 7 9 . 9 9 1 m SO T O 9 9.9 9 m o 1 0 0 T O 1 •These results indicate that, the investor in new issues may not
oLitper-form the market with appro>dmately 35 per cent of the issues
acquired. However the average of his losses relative to the market is
smaller than the average of his relative gains (ll.ElOS per cent average
loss as compared to E7.66105 per cent average gain, shown as in Table II)
This is interpreted as an upward potential -for an investor in IPO,
relative to his or her slight downward risk.
Also, the average per cent change increases observed -for the new stock
issues, than the average per cent change experienced by the market (10.9
per cent vs. -3.4 per cent, shown in Table II) was a notable result as it
shows the average -favorable per-formance of the IPOs compared to the
market.
These results are in line with the results obtained by Reilly and
Hatfield (1969) . The results support the hypothesis that investors in new
stock issues enjoy higher very short run returns on the average than the
overall market. These results also indicate that on the average new
issues have done better than the stock market indicator since the
relative losses in new stock issues are small compared to relative gains.
4.1.2 IPO Performance From Offering to Fifth Friday in the Secondary
Market :
Table III and figure 2 presents the summary results of the tests from the
offering day to fifth friday (short term) in the market.
pbserved Frequency
pxpected F-requency
ril C·-' 1 7 . i n2 10 1 7 . 5Figure S:
N u m b e r o-f n e w i s s u e s s h o w i n g i n c r e a s e s •from of-fering p r i c e ... E O N u m b e r o-f n e w i s s u e s s h o w i n g d e c r e a s e s ■from of-fering p r i c e . . ... 13 N u m b e r o-f n e w i s s u e s s h o w i n g no c h a n g e •from of-fering p r i c e ... E N u m b e r of n e w i s s u e s o u t p e r f o r m i n g the I S E I ... E 5
confidence leveKX^ > 5.0S3) ^ . This time we reject the null hypothesis.
The data present sufficient evidence to indicate that under purely random
circumstances more than half of the issues would outperform the market in
the short run.
Table
IIIRESULTS FROM OFFERING TO FIFTH FRIDAY AFTER STOCKS
APPEARANCE IN THE MARKET
Consistent with the above result, the average per cent change figures
listed in Table IV indicate that the extent of the gains in new issues
relative to the market was significantly higher than the relative losses.
According to Table IV, there were S IPOs observed, experiencing more than
£0 per cent increase in price. This is two times of the performance
result of ISEI for same intervals.
13 IPOs experienced decreases of more than £0 per cent, whereas market
indicator fall below -£0 per cent in £3 of the case. This again supports
the relatively more upward potential with less downward risk for IPOs.
‘ C o m p u t e d X '' veCLue
is
b . 4 £ S 5 7 , of.T a b l e IV S U M M A R Y O F R E S U L T S , F I F T H F R I D A Y IN T H E S E C O N D A R Y M A R K E T
^ ■ l ■ ^ ■ i l l l l l l l l l l l l l l l l l ■ I I I I I I I I I I IIIIIIIIIIIIIIIIIIIIIIIIII IIIIIIIIIIIIΠ IIIIIIIIIIIIIIIIIIIIIIIIIIIIIIIIIIIIIIIÍIlnlllllllllllllllllllllllllllllílllllllllllllllllHIIIIIIIIIIIIIIIIIIIIIIIIIIIIIIIIIIIIIIIIIIIIIIII lllllllllllllllllllllllll IlllllllllllllllllllllllllllllllllllllllllHllllllllllllllimi
A v e r a g e p e r c e n t l o s s of n e w i s s u e r e l a t i v e to I S E I - ... ...- I 5 . 4 3 b l A v e r a g e p e r c e n t g a i n of n e w i s s u e r e l a t i v e to ISEI ... E 7 . 5 3 E S A v e r a g e p e r c e n t c h a n g e i n all new i s s u e s .... A v e r a g e p e r c e n t c h a n g e i n the ISEI P e r c e n t C h a n g e I n t e r v a l s I P O ISEI -40 T O - E O .01 E 5 - E O T O - 0 . 0 1 0 11 IS 0 T O 1 9 . 9 9 14 S E O T O 3 9 . 9 9 o o 40 T O 5 9 . 9 9 1 . 60 T O 7 9 . 9 9 E 1 SO T O 9 9 . 9 9 m 100 T O E m
It is noteworthy that the average percent change in price for all ths new
issues a+ter four weeks was above the average percent price change that
prevailed on the fifth day after the offering (12.90594 vs. 10.91325 ).
Contrary to this result, Reilly and Hatfield observed lower percent price
change prevailed on the fourth friday relative to first friday result.
This difference can be attributed to the relative inefficiency of Turkish
Stock Market.
4.1.3 IPD Performance From Offering to Sixth Month in the Secondary
Market :
T a b l e V R E S U L T S O F I S S U E S F R O M O F F E R I N G T O £'5th F R I D A Y A F T E R S T O C K ' S F I R S T A P P E A R A N C E IN T H E M A R K E T
■il■l■llllllllllllllllllllllllllllllll■lllllllllllllllllnlllllllllllllllll II IllinilllllliriWIIIII IIIIIIIIIII IIinilllllllllllllllllllllllllllllll ll llllllllllllllllllllllllllllllllllllllllllllllllllllllllllllllllllllllllllllinilllllinnilllllinilinilllininillllllltl
N u m b e r of n e w i s s u e s s h o w i n g i n c r e a s e s f r o m o f f e r i n g p r i c e ... IS N u m b e r of n e w i s s u e s s h o w i n g d e c r e a s e s fro m o f f e r i n g p r i c e ... 14 N u m b e r of n e w i s s u e s s h o w i n g n o c h a n g e from o f f e r i n g p r i c e ...1 N u m b e r of n e w i s s u e s o u t p e r f o r m i n g the ISEI ... ’ --- 15 (Total i s s u e s h a v i n g s i x m o n t h s d a t a a r e S7 )
iday six months after the offering are listed in Table V and figure 3.
nl nS
O b s e r v e d f r e q u e n c y 15 12
E x p e c t e d f r e q u e n c y 1 3 . 5 1 3 . 5
Figure 3 :
While more than half (55.5 per cent ) of the issues outperformed the
market indicator, the result is not significantly different from what was
expected under random occurrence at 95 per cent confidence level but
significant at 90 per cent .
According to the percent change figures listed in Table VI the average
loss relative to the market is -S9.32 per cent where as the average
investor is greater than the extent d+ relative losses -for the medium
term also. But the magnitude o-f the dif-ference between average relative
gain and average relative loss notably declines as the period studied
increases. T a b l e VI S U M M A R Y O F R E S U L T S SI X M O N T H S A F T E R O F F E R I N G W lt m H M ln iM llin i l i n i l l i m B n i l i m W I i n i i n n n n M I l l B l l l l l l l l l ll l l l l l l l l l l ll l l l l l l l l l l iM I I W I I M I I I I I I I I I I I I I I I I I I I I I I I I I I I I I I I I I I I I I I I I I I I I I I I I I I I I I I H I I I iM l l l ll l l l l l l l l l l ll l l l l l l l l l ll l l l l l l l l l l ll l l l l l l l l l l ll l l l l l l l l l ll l l i n i W ^ ^ A v e r a g e p e r c e n t l o s s of n e w i s s u e s r e l a t i v e to ISEI ...
-aS.SEEE
A v e r a g e p e r c e n t g a i n of n e w i s s u e s r e l a t i v e to A v e r a g e p e r c e n t c h a n g e i n alln<=V|Ai •i Cicni ic>c: ... . 0 , 4 ‘4P,A
A v e r a g e p e r c e n t c h a n g e i n the TQFT . .- 4 . A 7 3 3 P e r c e n t C h a n g e I n t e r v a l s I P O ISEI -60 T O - 4 0 . 0 1 4
m
- 4 0 T O - 5 0 . 0 1 6 4-BO
T O - 0 . 0 1 4 140
T O 1 9 . 9 9 6 7 E G TO 3 9 . 9 9 o 1 4 0 T O 5 9 . 9 9 o 1 60 T O 7 9 . 9 9 H S O T O 9m
S
9 ■ :i. 00 T O ·+· 1m
Again from table VI the average percent change figures for the initial
public offerings were 0.A966 per cent. It was -4.6733 per cent for the
stock market indicator ISEI. Again for this time period, like the two
periods analysed above, average percent price change comparisons are in
favor of the new stock issues.
1 5 also highlighted in Table VI. The new stock issues distribution shows 7 cases with returns higher than SO per cent (S cases tor ISEI ), but new
issues experiencing the returns that are smaller than -SO per cent are
more than ISEI tailing to same interval ( 10 vs. 4). Assuming that one
measure ot risk is the probability ot a decline, these results would
indicate that there is greater risk involved in investing in new issues
than investing in seasoned market stocks in medium term.
In conclusion, the hypothesis ot superior short term returns tor
investors in new stock issues are substantiated, but the medium term data
do not present sutticient evidence to say so. However, one must keep in
mind that, there were S7 issues having medium term data, compared with
total ot 35 issues tor analyzing short and very short term.
4.E FINDINGS RELATED TO TESTING OF THE SECOND HYPOTHESIS;
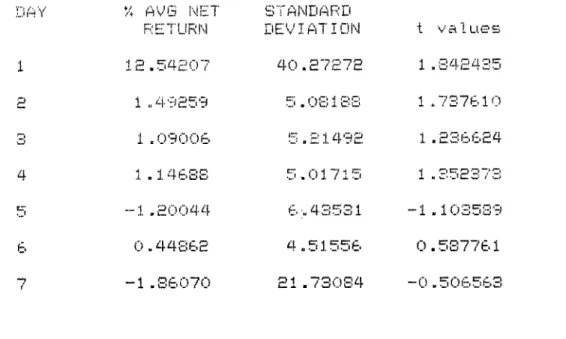
Table VII presents the daily net return results for the total sample of
stocks with corresponding t values.
The average net return tor all the stocks in the sample on the very first
day from ottering is substantially higher than the following six days
return as can be seen from Table VII. The standard deviation ot the
average net returns tor day one is also larger than the following day's
deviation results. The significance ot the results are tested by t-test
stat ist ic.
T a b l & V I I I } A IL Y ¡'-‘.ET !E!·:. ! L'Hr'i HEoUL I ■::) rUR ' U ! PiL c,'AMr'L.E: (.c)!rj S T O C K S ) .1.1 A Y 1 P % AVG NET RETURN IE .
54£07
1
„4 9
S5
S1 .0 9 0 0 6
1
.14 6
SS--1
.2 0 0 4 4
0
-4 4
S6
E -1 .8 6 0 7 0
S T A M DaFa'D DEVIATION40
.E7
E7
E 0 . 0 8 1 8 65
.E149
E 5 . 0 1 7 1 56
;.43531
4 .5 1 5 5 6
El.7 3 0 8 4
t v a l u G S1
.3 4
E435
1 .7 3 7 6 1 0
1
.E3 6 6
E4
1
.35
S373
-1 .1 0 3 5 3 9
0 .5 8 7 7 6 1
—0 .5 0 6 5 6 3
Only the tiret and second day returns are stat ist ical iy signi-f leant at 95
per cent confidence (t > 1.645). The null hypothesis is rejected for the
first two days.
These results show that the bulk of market adjustment to iriispricing is
accomplished within the first two days of trading. The mispricing
observed is in favor of underpricing as the stocks experienced
significant positive excess returns for the first two trading days in the
market.
Table VIII presents the return results for the sample of stocks that
experienced negative returns on day one.
was:-Ho : L! j = 0
Ha ; u ^ < Ci
where
Lij = average net return in period t; tor sample stocks that experience
negative returns on day one. (t=i to 7 days)
T a b l e V I I I D A I L Y N E T R E T U R N R E S U L T S F O R S A M P L E S T O C K S T H A T E X P E R I E N C E D N E G A T I V E R E T U R N S DM D A Y O N E . (5 S T O C K S ) D A Y ·/. A V 6 N E T S T A N D A R D t R E T U R N D E V I A T I O N v a l u e s 1 - S . 0 4 S 0 6 5 . 0 1 3 3 5 1 “ 3 . 5 3 9 6 1 6
a
1 .‘5 1 5 6 0 S 4 . 4 9 1 9 4 5 0 . 9 5 3 5 3 0 o 0 . 1 6 9 9 9 4 a . 0 5 2 4 S 6 0 . 1 3 5 1 9 3 4 - 0 . 9 9 S S 0 0 4 . 3 7 1 3 2 7 - 0 . 5 1 0 5 5 1 cr - 7 . 3 6 3 6 5 0 3 . 2 9 6 2 1 3 - 1 . 9 3 4 7 1 5s
1 . 6 3 4 5 3 1 1 . 4 7 1 6 7 5 2 . 5 5 9 4 6 6/
2 . 3 4 5 7 6 0 4 . 0 9 9 4 3 4 1 . 2 7 9 5 1 2Only the ■first day return is statistically significant (t > 2.132) with
S5 per cent con-fidence, for stocks that experience negative returns on
day one. First day return is substantially lower than the successive day returns. Null hypothesis is rejected only -for first day , since successive day returns are irisigniticant
T a b l e X D A IL Y MET FiETlJFiN F iE E lJ L T S i-OR SAM PLE S TO C K S Tl ■AT E X P E
P.
I E M C E D N D C H A i'·'·! G E 0 M D A Y 0 N E ( 1 0 S T D C K S ) b FiETLIRM () D E V I A T I O N o v a I U S B (.) P.6 6 1 9 5
4
.1117
E E.0 4
FE/
C).SOIEE3
.71
E'ci /0
.6
3176
_o .0 0 4
IS3
.E4
E4
S0 .0 0 4 0 7
- 0
.35 08
S4 .9 1 3 1 5
O u E E53
ci 0 .0 4
E09
3
.S6 5
S7
0
.03 4 4
E0
.S S007
4 ,3 6 5 6 9
0
.5 3
E97
The -fact that is revealed by the results listed in tables VIII, and IX,
none o+' the daily returns -for days two through five were signi-ficant ,
implies that excess returns are available only during the first two days
of trading. This shows that adjustment to both types of mispricing taxes
place during the first two trading day, with no significant returns
occurring on any of the subsequent days.
From table X, one can see that the stocks experiencing no excess return
on the first day, earn significant positive excess returns on the second
trading day. The following days excess returns were again insignificant.
The adjustment to mispricing for the stocks experienced no change on day
c n e5 IE accomplished on the very following day. This change is notably PC'S i t i v e .
I n R o c k ^9^· fíiOCiol D*^ U r i d o r D r :íC i n g
íi \<=\S
CBOlliliOd ih¿;t. t o r a c o s t , i n v e s t o r s c o üIg •‘p u r c h a s e ' ’ in-foríTiat i o n a b o u t t h e e q u i 1 i b r iuítí p n c e o t a rissue, and thus become an intormed trader. H this is so, t h e n an o
informed trader would earn on the average S 3 . % per cent return , since
such a trader would only invest in underpriced issues. On the other hand,
the uninformed trader would invest in all issues, averaging a 14.03 per
cent return^. The difference of
3.93
per cent becomes an upper bound on the cost that an uninformed investor should be willing to incur to becomean informed trader.
t u
B.
V I’··B
X U
r
r'l 1···. IJ
V .1. J . T ]■J, -i!-5. CONCLUSION :
This study attempted to examine how investors in new stock issues have
■Fared relative to the rest o-f the stock market both in short term and in
medium term. It is hypothesised that initial public of-ferings are
underpriced. The speed o-f market adjustment to mispricing in initial
public D-f-ferings are -further explored.
The very short and short term results consistently supported the
hypothesis, since the number of new issues outperforming the stock market
indicator was statistically significant. The results are also
strengthened, with IPOs, always experiencing substantially higher sice of
average relative gains than the sice of average relative losses. The
investor's downside risk is smaller as comDared to his/her potential
oai n s .
The hypothesis is not supported by the medium term results. Although the
extent of average relative gains was higher than the extent of average
relative losses, the difference between the two amounts was smaller than
for the short term periods. Also there was greater risk involved in
’! h·? M i a r k e t a d ;і iiat rnant t o m i o p r t c i or» з а ooEar-^tr'O t o d e· аи.С0ііір1 1 ttfied d U ' " i n o
the -first two days s-- public trading, y.'ith the bulk of the adjustment
being in the first day.
As a conclusion, initial public offerings are found to be underpriced and
investors in IPOs can enjoy short term returns relative to the market.
Relatively smaller losses of the IPOs can be explained by the possible
commitment of the issuer to support their offering if it experiences huge
price declines. Underpricing in Initial Public Offerings can be
attributed to risk aversion of underwriters purposely underpricing IPOs
in order not to end up with an unsuccessful new stock issue.
According to timing classification of IPOs, which can be seen in Appendix
4, no considerable effect of market trend on the new stock issue is
observed descriptively. Though this does not mean that timing of the new
issue is not related to its afterwards performance. It is recommended for
the future researchers to examine the effect of timing of new stock issue
to its performance as well as the causes of underpricing mystery which
REFERENCES
-ROCK, K . , "Why New Issues Are Underpriced'' Journal of Financial
Economics, March 1986, pp. 187-212.
-BEATTY, R. and RITTER, J., ‘‘Investment Banking, Reputation and the
Underpricing of Initial Public Offerings" Journal of Financial Economics
March 1986, pp. 213-232.
-IBBOTSON R. G., "Price Performance of Common Stock New Issues" Journal
of Financial Economics, September 1975, pp. 235-272.
-MCDONALD J., and FISHER, A.K. , "New Issue Stock Price Behavior" Journal
of Finance, March 1972, pp. 97-102.
-REILLY, F.K. and HATFIELD, K., "Investor Experience with New Stock
Issues" Financial Analysts Journal. September-October 1969, pp73-80.
-TINIC, Seha H., "Anatomy of Initial Public Offerings of Common Stock"
Journal of Finance. 1988, pp. 789-819.
-HILLER, R.E., REILLY, F.K., "An Examination of Mispricing Returns and
Uncertainty for Initial Public Offerings" Financial Management, Summer