INTEGRATING SOCIAL FACTORS INTO
MOBILE LOCAL SEARCH
a thesis submitted to
the graduate school of engineering and science
of bilkent university
in partial fulfillment of the requirements for
the degree of
master of science
in
computer engineering
By
Basri Kahveci
August, 2015
INTEGRATING SOCIAL FACTORS INTO MOBILE LOCAL SEARCH
By Basri Kahveci August, 2015
We certify that we have read this thesis and that in our opinion it is fully adequate, in scope and in quality, as a thesis for the degree of Master of Science.
Prof. Dr. ¨Ozg¨ur Ulusoy(Advisor)
Assoc. Prof. Dr. ˙Ibrahim K¨orpeo˘glu
Prof. Dr. Ahmet Co¸sar
Approved for the Graduate School of Engineering and Science:
Prof. Dr. Levent Onural Director of the Graduate School
ABSTRACT
INTEGRATING SOCIAL FACTORS INTO MOBILE
LOCAL SEARCH
Basri Kahveci
M.S. in Computer Engineering Advisor: Prof. Dr. ¨Ozg¨ur Ulusoy
August, 2015
As availability of internet access on mobile devices develops year after year, users have been able to make use of mobile internet and search services while on the go. Location information on these devices has enabled mobile users to utilize local search applications for discovering places and activities around them. Although mobile local search is a kind of search activity, it is inherently different than general web search. Mobile local search focuses on local businesses and points of interest, instead of web pages as in general web search. Moreover, users’ context has a significant effect on their decision process. In previous studies, ranking signals and user context have been investigated on a small set of features. We extend ranking signals and user context in mobile local search with using data of location-based social networks. We developed a mobile local search application, Gezinio, and collected a data set of local search queries. Gezinio helps users to issue local queries and see various kinds of social information about local businesses around them. We built ranking models and investigated how social features affect decision process of users. We show that social features influence users’ click decisions and they can be utilized by ranking models to improve the local search experience. Additionally, we propose different social features for different query categories.
¨
OZET
SOSYAL FAKT ¨
ORLER˙IN MOB˙IL YEREL
ARAMALARA ENTEGRASYONU
Basri Kahveci
Bilgisayar M¨uhendisli˘gi, Y¨uksek Lisans Tez Danı¸smanı: Prof. Dr. ¨Ozg¨ur Ulusoy
Austos, 2015
Mobil cihazların internet eri¸siminin yıldan yıla yaygınla¸smasıyla, kullanıcılar hareket halindeyden mobil interneti ve arama servislerini kullanabilir oldular. Bu cihazların sundu˘gu konum bilgisi sayesinde mobil kullanıcılar yerel arama uygulamaları ile etraflarındaki mekanları ve etkinlikleri ke¸sfedebilme imkanı bul-dular. Mobil yerel arama her ne kadar bir arama aktivitesi olsa da, genel web aramasından belli farklılıklar i¸cermektedir. Genel web araması web say-falarıyla ilgilenirken, mobil yerel arama ise yerel i¸sletmelerle ve ilgi alanlarıyla ilgilenir. Ayrıca yerel aramalar zaman, hava durumu, konum gibi kullanıcının durumunu etkileyen fakt¨orlerden etkilenirler. Onceki ¸calı¸smalar yerel arama¨ sonu¸c sıralamalarındaki sinyalleri ve kullanıcı durumunu etkileyen fakt¨orleri k¨u¸c¨uk bir ¨ozellik k¨umesinde incelemi¸stir. Biz ise konum tabanlı sosyal a˘glardaki veriyi kullanarak yerel aramaları geni¸slettik. Gezinio ismini verdi˘gimiz bir mobil yerel arama uygulaması geli¸stirerek yerel arama sorgularını i¸ceren bir veri k¨umesi topladık. Kullanıcılar Gezinio’yu kullanarak yerel aramalar yapıp etraflarında bulunan mekanlar hakkında sosyal nitelikli bilgilere eri¸stiler. Daha sonra topladı˘gımız veriyi inceleyerek, sosyal ¨ozelliklerin kullanıcıların arama sonucu de˘gerlendirmelerini etkiledi˘gini ve bu ¨ozellikleri kullanan sonu¸c sıralama modellerinin yerel arama sonu¸clarını iyile¸stirdi˘gini g¨ord¨uk. Buna ba˘glı olarak, farklı kategorilerdeki sonu¸c sıralamalarının, farklı sosyal ¨ozelliklerden faydala-nabilece˘gini g¨osterdik.
Acknowledgement
Foremost, I would like to express my sincere gratitude to my advisor Prof. Dr. ¨Ozg¨ur Ulusoy for the continuous support of my research, for his patience, motivation, enthusiasm, and immense knowledge. His guidance helped me in all the time of research and writing of this thesis. I couldn’t have imagined having a better advisor and mentor.
Besides my advisor, I would like to thank the rest of my thesis committee: Assoc. Prof. Dr. ˙Ibrahim K¨orpeo˘glu and Prof. Dr. Ahmet Co¸sar for their support.
My special thanks goes to Fatma Kahveci for his endless patience and faith. I couldnt be finished with this work without her support.
Last but not the least, I would like to thank my parents Erdo˘gan Kahveci and Aysel Kahveci for supporting me spiritually throughout my life.
Contents
1 Introduction 1
2 Related Work 4
2.1 Diary Studies . . . 5
2.2 Mobile Local Search Log Analysis Studies . . . 6
2.2.1 Analysis of Mobile Context . . . 6
2.2.2 Analysis of Mobile Ranking Signals . . . 7
2.3 Application Development Studies . . . 10
2.3.1 Mobile Local Search Applications . . . 10
2.3.2 Mobile Recommendation Systems . . . 13
3 Gezinio, a Mobile Local Search Application 14 3.1 System Architecture . . . 15
3.2 User Interface . . . 16
CONTENTS vii
3.2.2 Local Business Details Screen . . . 18
3.2.3 Multiple Levels of Relevance . . . 18
4 Data Set 25 4.1 Features for Queries and Local Businesses . . . 25
4.1.1 Explicit Features . . . 25 4.1.2 Implicit Features . . . 29 4.2 Search Logs . . . 30 4.3 Top-Level Statistics . . . 35 4.3.1 Query Length . . . 35 4.3.2 Session Length . . . 37 4.3.3 Query Variation . . . 40
4.4 Click Rank Analysis . . . 42
5 Experiments and Results 46 5.1 Ranking Performance Metrics . . . 47
5.1.1 Normalized Discounted Cumulative Gain . . . 47
5.1.2 Expected Reciprocal Rank . . . 48
5.2 Learning to Rank . . . 49
CONTENTS viii
5.3.1 Training . . . 51
5.4 Ranking Model Performances . . . 53
5.4.1 MART Models . . . 53
5.4.2 LambdaMART Models . . . 55
5.5 Importance of Features . . . 59
5.5.1 Categorical Interpretation for Importance of Features . . . 60
5.5.2 Occurrences of Features . . . 61
List of Figures
3.1 Architecture of Gezinio . . . 20
3.2 The Search Screen . . . 21
3.3 Search Results on the Search Screen . . . 22
3.4 Local Business Map Pin Pop-up . . . 23
3.5 Local Business Details Screen . . . 24
4.1 Number of Users by Query Count . . . 31
4.2 Number of Users by Query Count with at least 1 Search Result Click 31 4.3 Number of Users by Number of Query-Issued Days . . . 33
4.4 Number of Queries with Clicks and No-Click . . . 33
4.5 Number of Queries per Month . . . 34
4.6 Percentage of Queries per Category . . . 34
4.7 Number of Queries per Category . . . 38 4.8 Number of Query Terms (x-axis) to Number of Queries (y-axis) . 38
LIST OF FIGURES x
4.9 Number of Letters (x-axis) to Number of Queries (y-axis) . . . 39
4.10 Session Length (number of queries per session) (x-axis) to Number of Sessions (y-axis) . . . 39
4.11 Number of Queries by Occurrence . . . 41
4.12 Cumulative Query Frequencies . . . 41
4.13 Number of Queries by Number of Clicks . . . 44
4.14 Number of Queries By Click Rank . . . 45
5.1 Relative Feature Importance Scores for NDCG@30 . . . 63
5.2 Relative Feature Importance Scores for ERR@30 . . . 64
5.3 Relative Feature Importance Scores for Food category . . . 65
5.4 Relative Feature Importance Scores for Shopping category . . . . 66
List of Tables
4.1 Top 20 Queries . . . 35
4.2 Number of Queries By Click Types . . . 43
5.1 NDCG@10 for CAT1 category model . . . 53
5.2 NDCG@30 for CAT1 category model . . . 54
5.3 ERR@10 for CAT1 category model . . . 54
5.4 ERR@30 for CAT1 category model . . . 54
5.5 NDCG@10 for CAT2 category model . . . 54
5.6 NDCG@30 for CAT2 category model . . . 55
5.7 ERR@10 for CAT2 category model . . . 55
5.8 ERR@30 for CAT2 category model . . . 55
5.9 NDCG@10 for CAT1 category model . . . 57
5.10 NDCG@30 for CAT1 category model . . . 57
LIST OF TABLES xii
5.12 ERR@30 for CAT1 category model . . . 57
5.13 NDCG@10 for CAT2 category model . . . 58
5.14 NDCG@30 for CAT2 category model . . . 58
5.15 ERR@10 for CAT2 category model . . . 58
5.16 ERR@30 for CAT2 category model . . . 58
Chapter 1
Introduction
As availability of internet access on mobile devices increases year after year, users have been able to make use of mobile internet and search services while on the go. A 2008 survey [1] reports that more than 40 million subscribers make regular use of mobile internet on their mobile devices in the US. Another report [2] estimates that mobile internet subscriptions exceed 2 billion by the end of 2013 and expects a 4x growth until the end of 2019. In parallel with the growth of the mobile internet usage, many studies have been conducted in the field of mobile search. An early study [3] analyses 1 million mobile search queries sent to Google’s mobile search interfaces and concludes that diversity of queries and number of queries per session on mobile cellphones are far less than on desktop. A more recent study [4] compares search patterns across computers, iPhones and mobile cellphones, and informs that search behavior on high end smart-phones has become quite similar to the desktop, while conventional mobile phones demonstrate a different behavior as in [3]. A significant limitation of these two studies, and a few similar ones, is that they focus to understand what people are searching and how they interact with mobile phones, and they clearly miss to infer the context of the user on the search activity.
Mobile search differs from web search, not only because of the differences between devices, but also the differences in the information needs of the people
when mobile. Mobile users tend to locate different types of content while on the go. Their information needs also contain location-related, temporal and social dependencies [5], [6]. As users being mobile, contexts such as location, time, activity and social interactions change with them, and affect their information needs.
Location information on the mobile devices has enabled people to use mobile local search services. Local services, point of interests and driving directions are a few of the most popular mobile information needs of the users [5], [6], [7], [3]. Mobile local search is not only affected by the context of the mobile user, but also from type of the entities it addresses. Similar to the general mobile search, users have a strong dependency on different types of context, such as location, time, activity or social interactions. For instance, when a user makes a query “food”, she may prefer a close-by fast-food restaurant in the noon because of time restrictions. If she issues the same query after work, she may prefer a farther dinner restaurant since she probably has more free time. Besides, local businesses and point of interests contain different types of information than web pages. Mobile users issue local queries to learn open hours or driving directions, or read reviews about a particular local business.
Importance of the mobile user context and local search ranking signals have been investigated by many studies. Although spatial and temporal context have been studied extensively, social context for mobile local search have been ana-lyzed in a limited scope. In this thesis, we used the data of social networks to gather social information about local businesses and investigate effect of the so-cial context on mobile local search in a broader view. To do so, we developed a mobile local search application, Gezinio. Mobile users issue local search queries via Gezinio and find various types of information about local businesses such as business hours, rating scores, reviews, number of visitors etc. We collected local queries, search results and search result clicks anonymously between March 2014 and November 2014 with Gezinio. We then analyzed these queries to understand user behavior and effect of social context on mobile local search.
• We developed a mobile local search application and collected a data set of local search queries that contain many social features in the search results. • We present statistics about our data set and compare them to other studies
to show the differences of users’ behavior on mobile local search.
• We build ranking models which utilize social features and show that these models outperform the baseline model which sorts all the results by distance to the user location. We conclude that users are more likely to find a search result relevant when they click it based on its social features, instead of its distance to user location. Concordantly, clicking to a search result by considering the distance does not necessarily satisfy users, and it causes multiple search result clicks.
• Lastly, we report that query categories put varying degrees of focus on the social features. Ranking systems can utilize different features to provide more relevant local search results for different query categories.
This thesis is organized as follows. In the following chapter, we discuss a few related features. In Chapter 3, we introduce our mobile local search application. We start analyzing our data set in Chapter 4 and provide a few statistics. We build our ranking models and present our results about effect of social features on local search in Chapter 5. Lastly, we summarize our conclusions in Chapter 6 and suggest possible directions for future research.
Chapter 2
Related Work
In this chapter, we review previous studies about mobile general search, mobile local search and mobile location-based recommendation systems.
We first refer to diary studies that investigate mobile information needs of users. These studies investigate types of mobile information needs, when they are addressed and by which contextual factors they are prompted.
Afterwards, we particularly focus on mobile local search. We first introduce search log analysis studies that investigate effect of the mobile context on mobile local search. With these studies, we see that context is an important factor for mobile local search, and local search systems can benefit from it. Secondly, we review some other search log analysis studies that deal with ranking signals in mobile local search. Since mobile local search focuses on a different type of domain (e.g., local businesses and points of interest), its ranking signals differ from general search and should be handled differently.
Finally, we review mobile application development studies that investigate lo-cal search and location-related recommendation systems. Similar to us, many other researchers have investigated local search by developing a mobile applica-tion, and observing users’ interaction with it. Although our main focus is mobile local search, we also summarize a few mobile local recommendation systems that
follow a similar approach to the local search application studies.
2.1
Diary Studies
It is reported in [6], [5], [7] and [8] that location-related information needs are among the top categories of information needs as about one-fourth of information needs are location-related. Information about local services, points of interest, contact information and business hours are among these information needs. Ad-ditionally, 72% of the information needs are prompted by contextual factors [6]. The contextual factors are classified as activity (what the person is doing at the time of the information need), location (the place where the person is), time (when the need arises) and conversation (any kind of conversation the person is involved in). Location is the top contextual factor with 34% [6]. Similarly, 30% of the mobile information needs are prompted by the locational context that likely has a relation with the temporal context [5]. These studies also examine actionable nature of mobile information needs. In particular, people address their mobile information needs 58% of the time when they arise [6]. Most of the time, information needs could not be satisfied because of the lack of the mobile internet access. With respect to this, almost all of the information needs are accessed if users have mobile internet access [8].
Teevan et al. [7] conduct a diary study that particularly focuses on mobile local information needs. They report that respondents search for a specific place or local business in mind only for 47% of the time. Users are more likely to be looking for a result without a specific place in mind. They are also likely to get directions to a place or get a phone number of the place. Lastly, they report that mobile local information needs are highly contextual and depends on location, time and social factors.
2.2
Mobile Local Search Log Analysis Studies
2.2.1
Analysis of Mobile Context
Location of the user may be an important aspect for the decisions of users on search results and have an impact on weights of other contextual features during the decision process. For instance, a user, who issues a mobile local search query in rush hours of a very crowded city, is most probably willing to travel a short distance because of the heavy traffic conditions. Therefore, she tends to click to nearby businesses in the local search results. Contrary to this, a mobile user in a small city may use her car and prefer distant local businesses. It is essential for a mobile local search engine to capture these variations. With this motivation, Lymberopoulos et al. [9] analyze 2 million mobile local search queries issued to Mobile Bing Local over a period of 3 months across the US. They introduce a few location-aware features into the feature space. Using these features, they build multiple ranking models on top of different layers of locational granularity with MART [10]. To evaluate their approach, they forward test queries to the ranking model that provides the best performance for the zip-code of the query. They report that user location and other location-aware features are more important than the other contextual features, such as time of day, day of week, weather conditions etc. Additionally, importance of location-aware features varies across the ranking models clearly showing the existence of the variance in click behaviors of mobile users across locations.
Mobile local search works well when the relevance is defined as nearest points of interests (POIs), but its capabilities are limited. It can be improved by incor-porating contextual factors and behavioral profiles into the process. For instance, a user may prefer different types of restaurants for lunch and dinner (temporal context). Additionally, two people that belong to different communities, may issue the same query at the same time and location, and desire to see different sets of nearby businesses that are relevant to their interests. Hapori [11] is a framework that is built on users’ context, behavioral profile and similarities to other people. It models POI preferences of users by taking the context (e.g.,
weather, time, location) into account. Afterwards, it builds a community model based on behavioral similarity between people. By this approach, it recognizes how the interest of people for the POIs change from weekday to weekend, from sunny days to rainy days, from person to person etc. It analyzes over 80,000 local categorical search queries (i.e. food, drink, entertainment etc.) issued to Mobile Bing Local over a period of 6 months. It shows that search result click preferences vary across different times of day and days of week. Similarly, weather conditions affect users’ click preferences. It also divides users into behavioral clusters and shows that click probabilities of local businesses significantly differ between these clusters. Based on these findings, it builds ranking models for various query cat-egories. A query category can be broad such as entertainment, food, or it can be quite narrow such as Mexican food, night-clubs etc. These ranking models outperform search result rankings in Mobile Bing Local by various degrees. The degree of the outperform is related to how much Hapori can utilize contextual features and behavioral aspects for a query category. It finally concludes that contextual factors and behavioral aspects are quite beneficial for mobile local search.
2.2.2
Analysis of Mobile Ranking Signals
Aforementioned studies investigate fundamental features and do not primarily focus on mobile ranking signals, such as business ratings and customer reviews. On the contrary, Lv et al. [12] focus on these signals, and study how these signals affect click decisions of users to develop more effective mobile local search result rankings. To estimate business popularity, they use the search result clicks in a significant portion of their data set. Similar to the other works, they conduct their study as solving a click prediction problem and building ranking models. For instance, they investigate the relationship between the business rating score and users’ click preferences. To do so, they train a click prediction model, and initially conclude that there is no clear relationship between the business rating score and users’ click preferences. They further examine the business rating scores to diagnose this conclusion. For this reason, they compare rating scores of
local businesses to the mean rating score of the local businesses within the same category. They find out that rating score of most of the clicked businesses are above their corresponding mean category rating score. This conclusion reveals the relationship between the business rating score and click preferences, and can be interpreted as follows: Although users do not really know the mean score of a category, they may be able to approximately estimate the mean scores by looking over the retrieved businesses list. If it is true, it means that users often take the mean rating score from the business result list as a pivot score, and tend to click businesses with higher than the pivot score. They add mean business rating scores to the future set, and build ranking models to verify this interpretation. They also investigate a pivot click phenomenon which also exists for the distance feature, and conclude that the pivot phenomenon of distance is not as clear as the business ratings. One possible reason may be the possibility that users can understand distance better than business ratings since it is a physical, concrete and objective concept.
Berberich et al. [13] leverage external data sources to quantify mobile local ranking signals. They use click popularity of the web pages of local businesses and driving-direction requests to quantify business popularity and distance sig-nals respectively. Integrating external data sources into the feature generation process is challenging since they are often sparse (i.e., cover only a subset of the relevant business), skewed (i.e., some businesses contain detailed information, others contain little detail or no detail at all), and noisy (e.g., contain outliers such as direction requests that span large areas). They address these issues of external data sources by using statistical aggregates at multiple resolution lev-els. They introduce new features by selecting an appropriate subset of external data (back off set) and deriving a single feature value. They then build ranking models using these features. They evaluate these models by testing with 80K queries with both human judgments and click logs separately. They show that both aggregate features and back off features significantly improve the ranking performance for both human-judged data set and click log data set. Finally, they conclude that external data can be utilized for improving mobile local search.
Domain knowledge about local businesses, such as customer ratings and re-views, can be sparse or some businesses may not have any data at all. Ad-ditionally, the quantitative and qualitative information about businesses might vary a lot across business categories. Some categories may receive more reviews or higher average rating than others. Therefore, using domain knowledge effec-tively becomes challenging in mobile local search. To address these issues, Lv. et al. [14] cluster businesses based on either business categories or business chains and introduces new features to ranking process. They build aggregate values to smooth customer ratings, number of reviews and clickthrough rates based on business category and business chain if the business belongs to a commercial chain. Business category data has an advantage of high level of coverage. On the other hand, it may be still coarse. For this reason, business chain is used as an alternative smoothing unit. The coverage of business chains is presumably not as high as that of the business category, because many businesses may not belong to any business chain. Nevertheless, businesses in the same business chain usually not only belong to the same category but also tend to share similar reputation, popularity, and other properties. Therefore, the two types of clusters comple-ment each other. Using these aggregated values, they build ranking models using the method provided in [10], and compare performance of these ranking models with baseline models with no smoothing values. They report that cluster-based smoothing provides improvements up to 5% on MAP (Mean Average Precision) metric.
Diversity of information needs behind local search makes it necessary to use different information retrieval strategies for different query types [15]. However, using a supervised learning method is not very practical since local search queries yield very few online features and it is too expensive to obtain sufficiently large labeled data [15]. To address these problems, Bian et al. [15] develop a semi-supervised approach to categorize local search queries into three types: business category, chain business, and non-chain business. They conduct an analysis over search logs. Using a small set of labeled queries, they develop a click-based and a location-based label propagation methods to automatically generate query category labels for unlabeled queries from the search logs. In particular, they
report that the number of clicks per search session of business name queries is much more likely to be smaller than that of business category queries. Moreover, chain business queries are submitted from more locations since chain businesses have larger geographic scale, but non-chain businesses are likely to be bound to fewer locations. Based on these findings, they first classify queries between business category and business name as follows: Queries with the average number of result clicks per session is higher than a threshold are labeled as business category; otherwise, they will be labeled as business name. In the second step, they classify queries between chain business and non-chain business as follows: Queries with average occurrence at higher than a certain number of locations will be labeled as chain business; otherwise, they will be labeled as non-chain business. They evaluate their method with a few classifiers, and report that they substantially outperform supervised learning methods.
2.3
Application Development Studies
2.3.1
Mobile Local Search Applications
Jeon et al. [16] developed a semantic web based mobile local search system which is claimed to be the first application of semantic web technology in mobile communication. When it receives a local search query from a mobile device, it first analyzes the query with the ontology system, and forwards it to a local search system. For instance, a user query “Ataturk Airport hamburger” is analyzed by the search engine and the word “hamburger” is mapped to the category of fast food. Then, a spatial search is applied for the query fast food around the “Istanbul Airport”. They report that number of terms in the query is the key factor on the performance of the system. They also report that their system provides more than 20% improvement in the search process, compared to the conventional local search services.
Church et al. [17] developed a proof-of-concept map based mobile search appli-cation, SocialSearchBrowser (SSB) to investigate social aspects of mobile search. SSB tries to address people’s information needs, and enhance the mobile search by providing connections to their social networks. It allows mobile users to see queries and interactions of their peers, and issue their own queries. They con-ducted a live field study with sixteen participants during April 2009, and gener-ated approximately 300 messages. Afterwards, they complemented the work with a post-study survey to gain insights about participants’ experiences. They report that 57% of the messages are location-specific queries, and 36% of the messages are general queries. These queries are answered by both friends of the users, and the SSB server application that retrieves relevant results from third party APIs. Additionally, SSB server also sends an SMS notification to the user when a peer answers a query. They report that participants liked the peer-to-peer answering capabilities and SMS notifications most. They also liked the location-based as-pect of the application because it allowed them to learn about location of their friends. To sum up, Church et al. state that SSB served as a tool for both peer-to-peer communication and search while on the go.
Limited input capabilities on mobile devices affects mobile search experience negatively. Similarly, missing contextual information causes mobile users to have a poorer search experience. To overcome these issues, Arias et al. [18] developed a thesaurus-based semantic context-aware auto completion system that can help users in completing the query terms easily, and filtering out non-relevant results based on users’ context. They created a thesaurus which represents concepts. These concepts are good candidates to be the most likely-to-be-used query terms for mobile search queries. Additionally, they extended their semantic auto com-pletion engine with context-aware recommendation, which filters out irrelevant concepts. For example, the term “beach” can be filtered out if a user is not on the seaside, or it is winter. They integrated their proposed model into a working prototype, and tested feasibility of the system with 12 people. They state that all testers found the auto completion system useful and intuitive by reducing the typing time of the query, and making the search system easier to use.
behavior. They collected 3 types of data: search logs, location data and diary entries. The study was carried on with 12 people for 12 days, and collected 347 location-based mobile search queries. They report that 42.7% and 43.8% of the search queries have been motivated by fact finding and information gathering purposes, respectively. For instance, looking for contact details of a local business is a fact-finding task, and looking for local businesses to decide a place for dinner is a information gathering task. Additionally, they state that 66% of the queries were prompted by activities and situations. Similarly, 76% of the queries were conducted in the presence of others. Lastly, they inform that users choose a local business 23.7% of the time for having a particular product or service, and 15.8% of the time for being recommended by other people.
Ehlen et al. [20] developed a mobile local search application for tablets and smart phones, Speak4it, that provides a multimodel interface for users. It allows users to issue commands using simultaneous inputs from speech and touchscreen gestures. For instance, a user can say ‘hotels’ while circling a particular region on the map. Speak4it streams user input and context data to its server. There, it combines the speech and gesture recognition results to evaluate the query issued by the user. The authors intended Speak4it to evaluate user queries in a method such that each new query is independent of context of prior queries. But they conclude that users often expect the application to take more dialogue context into consideration, and make corrections and revisions to prior queries.
In a recent study, Jolhe et al. [21] propose an Ontology Based Personalized Mobile Search Engine (OPPMSE) that captures users’ interests by mining search results and clickthrough logs. They profile users’ interests and personalize search results. Users profiles are used to build personalized ranking functions. They separate concepts into location concepts and content concepts to recognize the importance of location information in mobile search. For example, a user who is planning to visit Istanbul may issue the query “hotel” and click on the search results about hotels in Istanbul. From the clickthrough logs of the user, OBPMSE can learn the users’ content preference and location preference, and favor related results accordingly. They also use users’ GPS locations to adapt the user mobility in the personalization process and improve the location-related search results.
There is no results reported by this study yet.
2.3.2
Mobile Recommendation Systems
In addition to the aforementioned studies that focus on mobile local search appli-cations, there are various studies that focus on mobile recommendation systems and location-based recommendation systems. In this chapter, we sample some of those studies to show the challenges of mobile environments for the recommen-dation systems.
In an early study, Takeuchi et al. [22] developed a system which makes recom-mendations of shops based on users’ location history. They detect users’ frequent places and match them with the shops in the area. Afterwards, they feed their item-based collaborative recommendation algorithm with users’ frequent shops. In a similar study, Yang et al. [23] proposed a location-aware recommendation system that tries to satisfy customers’ shopping needs with location-dependent offers and promotions. These studies show that locational context can be used to model users’ preferences in a better way, and make more relevant recommen-dations.
Del et al. [24] presented a novel, decentralized mobile recommendation system, diffeRS, which exchanges users’ profiles via radio technology (e.g., Bluetooth), and builds a virtual view of the local community’s preferences. diffeRS stores user profiles in users’ devices, and computes recommendations with a lightweight algorithm. The authors stated that diffeRS achieves an accuracy and coverage that are comparable to those of centralized recommender systems.
Chapter 3
Gezinio, a Mobile Local Search
Application
In the previous chapter, we reviewed many studies about mobile information needs, mobile search and mobile local search. Diary studies examine mobile in-formation needs and reflect the effect of contextual factors successfully. Neverthe-less, they are usually conducted with few people, and miss the actual experience of mobile search. Search log analysis studies have a better view of mobile search experience. They investigate mobile local search ranking signals and effect of con-text on users’ click decisions in many aspects. With respect to this, many studies note the importance of social context for local search experience. For instance, users often make local search queries while they have company, and they wonder about other people’s opinions about local businesses. However, the set of ranking signals is very limited in these studies. For this reason, social context could not have been studied extensively.
We also focus on effect of the social context on mobile local search, and aim to study it with a broader view. We retrieve various types of information from a location-related social network and integrate them into a local search application. We developed a mobile local search application, ‘Gezinio’ [25] for the Android platform. Users install the application to their smart phones and issue local
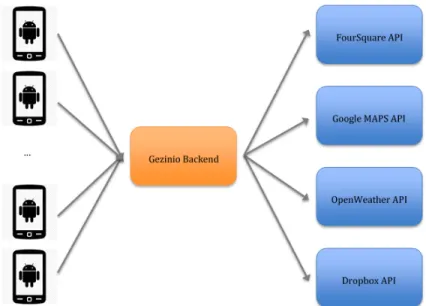
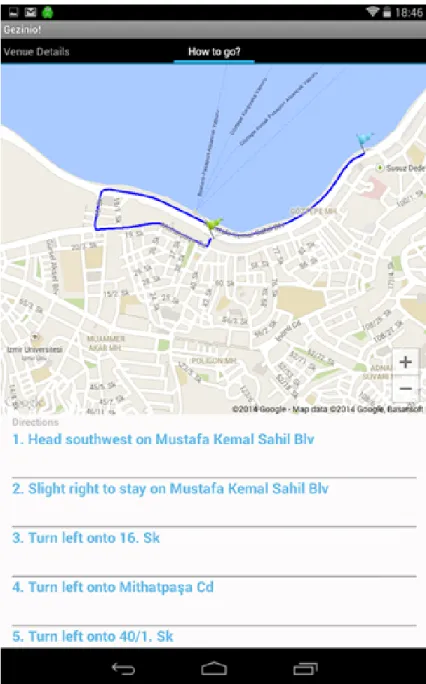
search queries. Gezinio backend system uses FourSquare Developer API [26] to find relevant local businesses around users’ locations. Users view local businesses around them on their smart phones, with various kinds of information such as the address and contact information of a local business, how popular a place is, how many people have been there in total, and at the time of the query, whether if the place is open or closed at the time of the query, a few photos of the place, user comments, links to social accounts etc. They can also perform a few actions on the local businesses shown in the search results. For instance, they may see the position of a local business on the map, call the phone number of the local business, or learn the driving directions to reach there.
We used a few APIs and platforms in our application. First of all, we used Google Maps API [27] to show location of the user and locations of local businesses on a visual map. Secondly, we used FourSquare Developer API [26] to find relevant local businesses. We also used Dropbox API [28] to persist user queries and search result clicks for offline analysis. Lastly, we used Open Weather Map API [29] to get the weather condition for the user’s location at the time of the query. We deployed our backend search system to Heroku free tier [30].
3.1
System Architecture
Figure 3.1 depicts architecture of the application. Gezinio backend system acts as a coordinator between mobile clients and 3rd party APIs. The communication
between the components of the system occurs on the HTTP protocol.
When a user installs the application, application generates a unique user ID from Gezinio backend and persists it into the local storage. User IDs are sent to Gezinio backend on search sessions to track queries and search result clicks of the users.
1. A user sends a query to Gezinio backend with a smart phone. 2. Gezinio executes 3 operations when it receives a query.
• It forwards the query to FourSquare API [26].
• It persists the query using Dropbox API [28] for further analysis. • It gets weather information for the user location and appends it to the
persisted query log.
3. After Gezinio backend receives the response from FourSquare API, it sends the list of local businesses back to the smart phone. Before sending the local business list, it re-orders the local businesses by their distance to the users location. Additionally, it only sends top-50 results to the client due to the API usage limitations of FourSquare.
4. Local businesses are displayed on the users mobile phone.
5. Users may perform some actions on the local businesses displayed on the screen.
• She may focus on one of the local businesses on the map.
• She may request the detailed information and driving directions about a local business.
6. Mobile application sends these actions to Gezinio backend as search result click events.
7. Gezinio backend appends these events to the query log of the user.
8. Gezinio backend retrieves the requested information from FourSquare API [26] and Google Maps API [27] and sends it back to the smart phone.
3.2
User Interface
Mobile location-related information accessing applications are usually organized by using a combination of a map component according to the position of user,
a textual list component that may rank informative objects, and a few other components [31]. Maps are very useful for displaying information with spatial knowledge such as places, local businesses, and navigating between these kind of objects. However, it may be hard to align virtual maps with the landmarks in the surrounding environment [32]. On the other hand, lists are easy to read comprehensively and very useful to display informative objects with an order. However, they may perform poorly when they reference to geographic locations since it requires a significant amount of cognitive effort to map the listed ob-jects to spatial representations. Therefore, it is very reasonable to combine map components with textual components such as lists and filters to display spatial information. Meier et al. report that most popular mobile location-related infor-mation accessing applications follow this approach [31]. Accordingly, we followed a similar approach and developed a UI that uses both map and list components.
3.2.1
Search Screen
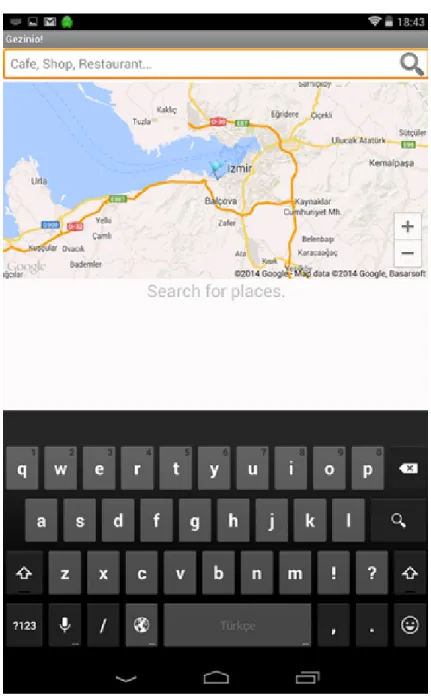
When a user launches the application, she meets a search screen as in Figure 3.2. A search bar component is displayed at the top of the screen. A map view that displays the area of the user is placed below the search bar component. The location of the user is indicated by a blue flag on the map.
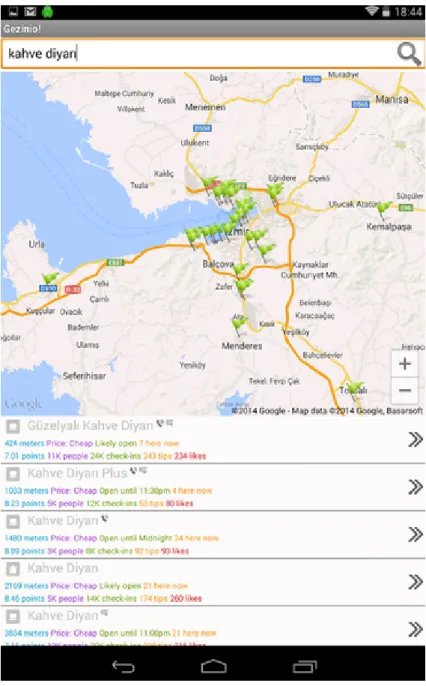
Figure 3.3 shows the local businesses that are relevant to a user query. Local businesses are displayed line by line below the map component. For each local business, a map pin that indicates the location of the business is placed on the map. Additionally, many features are displayed for each local business in the result list.
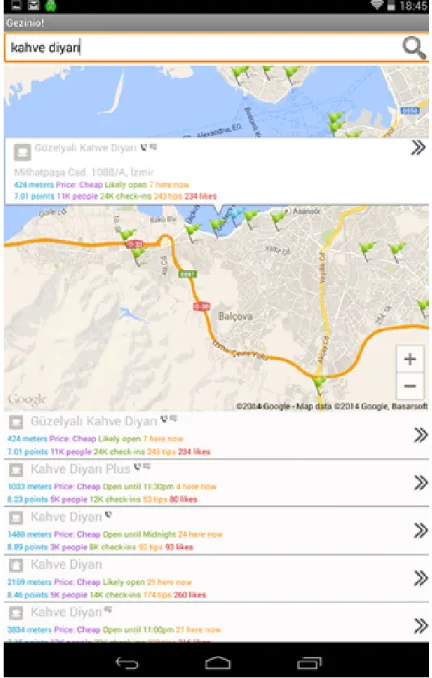
Figure 3.4 shows the map pop-up component that is displayed when a user taps to one of the businesses shown in the result list, or directly clicks a pin on the map. We call these actions Tapping-to-local-business and Tapping-to-map-pin respectively. They show different degrees of relevance for a local business.
3.2.2
Local Business Details Screen
Figure 3.5 shows the screen that is displayed when a user taps to the Right Arrow for a local business in the result list. There are two tabs on this screen; one for providing many kinds of detailed information about the local business and the other one for driving directions. Tapping-to-right-arrow action also shows another degree of relevance for a local business.
3.2.3
Multiple Levels of Relevance
Lane et al. [11], Lv et al. [12], Berberich et al. [13] and Lymberopoulos et al. [9] analyse mobile local search logs collected by a commercial mobile local search engine. All of these studies construct a binary relevance model by assessing the relevance of a local business by checking if the business is clicked or not. Although we can follow the same approach to evaluate relevance degrees, users provide us multiple levels of relevance by performing different actions on the local businesses that are shown in the search results. A user can perform the following actions on the search results in Gezinio:
1. Tapping-to-map-pin. She can tap to a pin of a local business that is placed on the map. This action may indicate that the location of the tapped local business is relevant to the user. In the following sections, this action is also called as Map-pin click.
2. Tapping-to-local-business. She can tap to a local business that is shown in the search results to find the local business on the map. Tapping to a local business in the search results focus the map to the pin of the tapped local business. This action may also indicate that the user finds the tapped local business relevant and she wants to where the local business is. In the following sections, this action is also called as Result list click.
3. Tapping-to-right-arrow. She can tap to the right arrow for a local business to view details about the local business. This action is very similar to the
previous actions but contains an important difference: a stronger degree of relevance. In the following sections, this action is also called as Details click.
Chapter 4
Data Set
4.1
Features for Queries and Local Businesses
In our study, we are interested in many features about user queries and local busi-nesses. Some of the features are explicitly shown to the user in the application, while a few of other features are implicit ones. In this section, we explain details of explicit features for local businesses first and implicit features afterwards.
4.1.1
Explicit Features
FourSquare API provides many features that provide insights for local businesses such as popularity, contact information, links to social accounts, and statistics for local businesses, etc. Gezinio shows these features to users on result lists explic-itly. In this subsection, we detail these features and divide them into categories. The features listed in this sub-section are displayed to the user for each local business in the result list, although some of them may have missing values for some of the local businesses.
4.1.1.1 General Features
• Name of local businesses are shown to the user in map pins, search result lists and details screen.
• Location (Latitude and longitude) of the local businesses are used to place them on the map.
• Distance between the querying user and a local business in meters is explic-itly shown to the user. Many studies investigate the effect of the distance feature. For instance, Lymberopoulos et al. study 2 million local search query logs issued to a commercial mobile search engine in the U.S. It states that the traveling distance is one of the most important features and it may vary between different locations (i.e. cities, states etc.) [9]. Addition-ally, Lv et al. inform that the click rate of a business generally sublinearly decreases by its distance to the user [12].
• Price level of a local business is shown to the user by using 1 to 4 ‘$’ signs. Each number of dollars shows a degree of price level about how much expensive a local business is.
• Local Business Category. FourSquare organizes local businesses by using a hierarchical category tree [33] in which upper levels are broad categories (e.g., food) and lower levels are narrow categories (e.g., Thai food and Turkish food). An icon about the business category is displayed for each local business in the result list.
• Specials shows the ongoing campaigns and special events that are present on a local business.
4.1.1.2 Accessibility Features
These features may help users on deciding whether visiting a local business or not. Mobile local searches are considered to have an actionable nature [9]. Addi-tionally, recent industrial reports [34] and [35] inform that it is very important for
local businesses to provide information for users, which are potential customers, to be able to access to the local businesses. Therefore, we show many features in search results that may be useful for querying users to access to local businesses. In addition to these features, we provide the driving directions for a local business in a detail screen if a user taps to a business in the search results.
• Open Address. We show the open address of a local business when a user clicks to a pin on the map view.
• URL of the Local Business’ Web Site. We show an icon in the search results to indicate that URL of the website is present for a local business. When a user taps to one of local businesses in the search result, she can see the URL on the details view of the application.
• Is Open provides the information about whether a local business is open or not at the time of a user query.
• Phone Number. We show a phone icon to indicate that phone number of the local business is present. When a user taps to a local business in the search results, she can see the phone number on the details view and call the local business within the application.
4.1.1.3 Popularity and Social Features
These features provide information about popularity and social aspects of a local business. Lymberopoulos et al. [9], Lv et al. [12], and Lane et al. [11] have a common conclusion that business popularity is one of the most important features for ranking local businesses. However, they define the business popularity for a local business with rating score or review count features. Although these two features provide a clear definition of the business popularity, we can still extend it by introducing new features that reflect social aspects of a local business such as checkin count, tip count, and like count etc. Therefore, we integrate a few new features that relate to both popularity and social aspects of local businesses.
• User Count shows the number of the users who have visited a local busi-ness.
• Checkin Count shows how many times a local business has been visited. With the previous feature, this feature may show how many loyal customers a local business has.
• Tip. A tip is a comment written for a local business by a FourSquare user. We show the tips matching to the user query for local businesses in the search results. We investigate the effect of a negative or a positive tip about a local business click decisions.
• Tip Count shows the number of tips written for a local business. When there are many tips written for a local business, it may indicate that the business is successful at making its customers talk about itself on social platforms.
• Like Count shows how many FourSquare users have performed the Like action for a local business. The Like action indicates an interest of a user to a local business.
• Here Now shows the number of users present at a local business at the time of a user query.
• Rating Score is a numeric value between 0 and 10. If a local business has many visitors in total, and the value of rating score feature is high, that business may be attractive for the first time visitors.
• Links to social accounts. If a local business has accounts on social media web sites such as Twitter or Facebook, relevant icons are shown to the user in the search results. A user can see social media accounts if she taps to a local business in the search results.
4.1.2
Implicit Features
In addition to the explicit features that querying users can see in the search results, we introduced a few implicit features that are not visible to the user in the user interface. These features are appended to the search logs and investigated in further analysis.
• Query Time. We persist time of the query for further analysis. Addition-ally, we divide a day into bins as follows and map hour of the query into one of the bins. We choose the following bins because they are also used in the other related studies.
– Hour of Day - 1. Bins are [0, 6), [6, 12), [12, 18), [18, 0) – Hour of Day - 2. Bins are [0, 7), [7, 13), [13, 19), [19, 0)
– Hour of Day - 3. Bins are [0, 5), [5, 9), [9, 13), [13, 17), [17, 21), [21, 0)
• User Identifier. We assign a random ID to a device when the user installs the application. Then, we transfer the assigned user ID to server with the queries. IDs are assigned randomly and do not contain any information about the user.
• User Location. Location of the user is retrieved from the GPS sensor of the smart phone while making queries. It is both used to retrieve the results and persisted in the search logs.
• Weather Condition. We retrieve the weather condition information [29] and attach it to the search logs as a categorical feature.
• Sentiment of the Tips. A positive sentiment in the tip for a local busi-ness can make it more attractive than the other busibusi-nesses in the search results. Similarly, a negative sentiment may have a negative effect on the querying users’ decision process. Following these two intuitions, we detect the sentiment of the tips of the local businesses shown in the search results.
We use 4 labels for sentiments as Positive, Negative, Neutral and No Sen-timent. Sentiment detection is done manually since number of tips with sentiment is small.
• Query Type. Correct query classification may produce more relevant re-sults since the query category may help the system to select the best strategy in order to find and rank local businesses. Bian et al. classify mobile local search queries by assigning them to one of the query categories: business category query, chain-business category, or non-chain business category. They conclude that the click probabilities of mobile local search results vary significantly between query types [15]. Another example is Lane et al who investigate only the categorical queries to study the effect of context on mobile local search. They show that effect of the context depends on how narrow or broad category a query is [11]. Similar to sentiment detection of the tips, we manually label queries as business category, chain-business category, or non-chain business category.
• User Loyalty. We define a new implicit feature, user loyalty, that is calculated by dividing checkin count by user count for each local business in the search results. It indicates a degree of loyalty users show to a local business.
4.2
Search Logs
We present many statistics about the collected search logs in this section. 260 users installed the application and issued 1275 queries between March 2014 and November 2014. Figure 4.1 shows the number of users by query count. Figure 4.2 displays the number of users by query count with at least 1 search result click. Figure 4.3 shows the number of users by the number of days that users issued a query.
Figure 4.1: Number of Users by Query Count
• The average number of queries per user is 4.9 with min = 1, max = 98, median = 3, standard deviation = 8.625.
• 72 users (27%) issued only 1 query. • 73% of the users issued at least 2 queries. • 52% of the users issued at least 3 queries. • 28% of the users issued at least 5 queries.
• 231 users (88%) issued queries with at least 1 result click.
• 53% of the users issued at least 2 queries with at least 1 result click. • 35% of the users used the application for at least two days for issuing a
local search query.
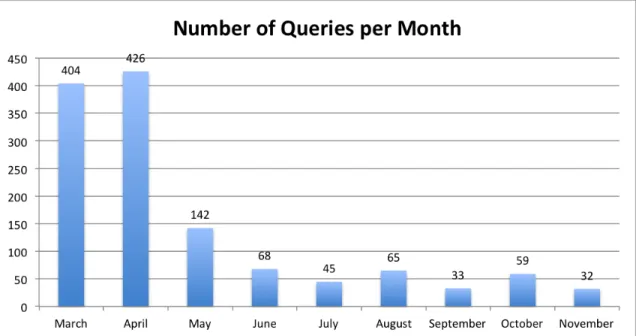
Figure 4.4 shows that 64% of the queries contain at least 1 search result click. Figure 4.5 displays the number of queries per month. Since the application was introduced in many websites in March 2014, the number of queries in March and April is significantly higher than the other months.
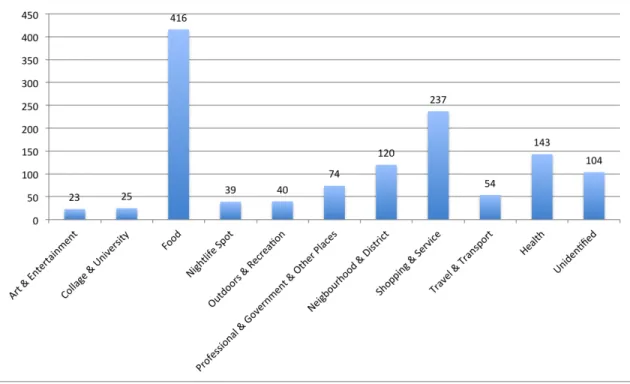
Figure 4.6 and Figure 4.7 show the distribution for categories of queries. The most popular category is food that contains queries such as cafe, pizza, burger king. One of the other popular categories is shopping & services that contains queries such as market and barber. We also observe that health category contains 11% of the queries. Gan et al. report similar category distribution to ours. Night life (restaurants, entertainment, etc.) and medical (hospitals, pharmacies, etc.) local businesses (shops, etc.) are among the top categories in [36]. Teevan et al. also report that restaurants and shopping are the top 2 categories of mobile information needs [7].
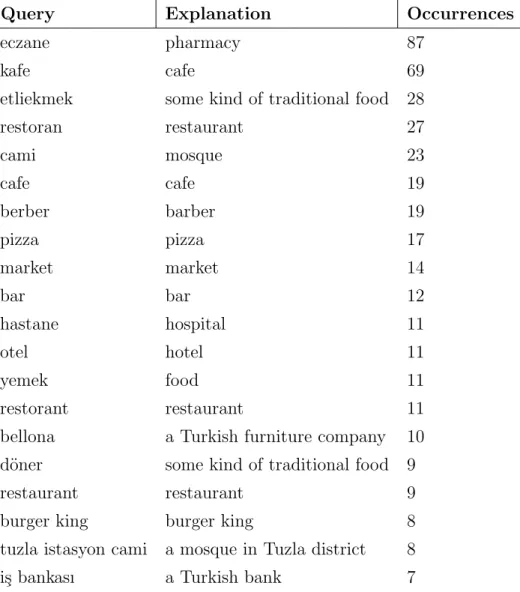
Table 4.1 shows top 20 queries issued to the Gezinio. 16 of top 20 queries are categorical queries. burger king, bellona and i¸s bankası are business chains. tuzla istasyon cami is a mosque in Tuzla district of Istanbul.
Figure 4.3: Number of Users by Number of Query-Issued Days
Figure 4.5: Number of Queries per Month
Query Explanation Occurrences
eczane pharmacy 87
kafe cafe 69
etliekmek some kind of traditional food 28 restoran restaurant 27 cami mosque 23 cafe cafe 19 berber barber 19 pizza pizza 17 market market 14 bar bar 12 hastane hospital 11 otel hotel 11 yemek food 11 restorant restaurant 11 bellona a Turkish furniture company 10 d¨oner some kind of traditional food 9 restaurant restaurant 9 burger king burger king 8 tuzla istasyon cami a mosque in Tuzla district 8 i¸s bankası a Turkish bank 7
Table 4.1: Top 20 Queries
4.3
Top-Level Statistics
4.3.1
Query Length
Figure 4.8 shows the number of queries by number of query terms. Figure 4.9 displays the number of queries by number of letters. 70% of the queries contain
only 1 query term and 58% of the queries contain 4-9 letters. Average number of terms per query and average number of letters per query is 1.37 and 8.52, respectively. Table 4.1 lists the top 20 queries. Average number of letters and average number of terms reported by Kamvar et al. [3], Baeza et al. [37], Church et al. [38], and Kamvar et al. [4] are higher than our numbers. In contrast to our study, these studies analyze general mobile search queries. Kamvar et al. analyze queries issued from mobile phones, PDAs, and computers to the Google’s search interface in a one-month period of 2005. They report that the average number of terms per query is 2.3, and the average number of letters per query is 15.5 for mobile phones. In a more recent Google study, Kamvar et al. [4] analyze queries issued by computers, iPhones, and mobile phones in a one-month period of 2008. They report that the average number of terms as 2.93 and 2.44, and the average number of letters as 18.25 and 15.89 for iPhones and mobile phones, respectively. In another study, Church et al. [38] analyze search queries issued by European mobile users in a 7-day period of 2006. Similar to the other studies mentioned above, they report 2.2 and 13.8 as the average number of terms and the average number of letters, respectively. In a recent study, Song et al. [39] analyze search queries issued to Bing search engine between August 2012 and October 2012 by iPhone, iPad, and desktop users. They report that mobile issues generally issue longer queries than tablet and desktop users. The average number of words is 3.05, 2.88, and 2.73 for mobile, tablet, and desktop queries, respectively. Accordingly, the average number of characters is 18.93, 18.02, and 17.44 for mobile, tablet, and desktop queries, respectively. The inconsistency of query length among various studies indicates that user behavior continues to evolve for search on mobile platforms. Based on our statistics, we can also report that users prefer short and categorical queries for mobile local search. Categorical queries can also indicate that people do not have a specific place in mind before issuing the query.
It is very important to note that these studies analyze general search queries. There are a few other studies that particularly focus on local search queries. Gan et al. [36] investigate geographical search queries, i.e., text queries such as “hotel new york” that employ geographical terms in attempt to restrict results to a
particular region or location. They analyze 36 million queries of the AOL query trace and report that geographical queries tend to have more terms than non-geographical queries. Those queries are longer because they contain terms that are related to user location [36]. However, we use mobile devices’ GPS capabilities to detect user location. Therefore, our queries do not contain location-related terms. Additionally, we are interested in only local search queries and we report that local search queries tend to be categorical, and shorter than general queries. Church et al. [38] make a similar conclusion such that queries sent to the search engines other than Google tend to be categorical, shorter queries such as news, sports, etc. with 1.5 terms and 9.6 characters on the average. For that case, our statistics seem to be similar to those reported in [38]. In a recent study, Ravari et al. [40] analyze local queries issued to a popular navigation application from iPhone and iPad devices between February 2014 and June 2014. They report that the average number of terms is 1.87 for mobile phones and 1.93 for tablets.
4.3.2
Session Length
Figure 4.10 shows the distribution of the session length. Session length repre-sents the number of queries per session within 15-minute duration. 47% of the search sessions contain more than one query and the average number of queries per session is 2.04. Although the session length distribution is similar to the dis-tributions reported by Church et al. [38] and Kamvar et al. [3], [4], our average number of queries per session is slightly higher than 1.6 of [3], [4] and 1.8 of [38]. We speculate that local search results are not as satisfying as general search, and users tend to issue more queries per session.
Ravari et al. [40] report that the average number of queries per session is 1.74 for tablets and 1.49 for mobile phones. Since they analyze queries issued to a navigation application, it is very likely that users have a specific destination in mind before issuing the query. For this reason, they issue a few queries and start their travel which also cause shorter sessions.
Figure 4.7: Number of Queries per Category
Figure 4.9: Number of Letters (x-axis) to Number of Queries (y-axis)
Figure 4.10: Session Length (number of queries per session) (x-axis) to Number of Sessions (y-axis)
4.3.3
Query Variation
We calculate the diversity of the query logs in two different ways. Firstly, we count the number of unique queries. Secondly, we examine what percentage of the total query volume is accounted by the top 100 queries.
Figure 4.11 shows that there are 399 singleton queries that occur only once in the search logs. Additionally, it shows that there are 606 unique queries that are accounted for 47% of the total query logs. Kamvar et al. [4] inform that iPhone queries (61% unique queries) are more similar to computer queries (69%) than mobile phone queries (40%). It is known that a significant part of mobile phone queries contain adult queries. Therefore, mobile queries are less diverse. Although Gezinio is used in Android smart phones, the query diversity is closer to mobile phones than computers. There may be a few reasons behind this case. Firstly, Gezinio is a vertical search engine that only deals with local search queries. Additionally, smart phone users are usually familiar with locational social networks. The most popular categories in locational social networks are usually limited to categories such as food and shopping etc. Therefore, we believe that similar to the popular categories in locational social networks, the diversity of the local search queries is not high.
Figure 4.12 shows the cumulative frequency occupied by the top 100 queries. It demonstrates that top 10 queries occupy 25%, top 25 queries (2% of all queries) occupy 35%, top 50 queries occupy 42%, and top 100 queries occupy 51% of the total query volume. Kamvar et al. [4] report that 2% of the queries occupy less than 10% of the total query volume that is less than one-third of ours. Referring to the long tail phenomenon, we can see that the “tail” is shorter for local search queries compared to the others.
Figure 4.11: Number of Queries by Occurrence
4.4
Click Rank Analysis
Table 4.2 shows click types and number of queries that contain the given click type. 825 queries, that is 64% of the total query volume, contain at least 1 click. Map Pin Click is the type of click that users perform on the pins placed into the map. It is shown that it is the least preferred click type with 11% among all the queries. On the contrary, 776 queries, that is 60% of the total query volume, contain at least one click that have occurred on the result list. Those clicks are the ones that end up with focusing the map on the clicked local business, that is Result List Click, or opening a new screen that presents detailed information about the local business, that is Details Click. Church et al. [41] compare based and text-based interfaces for mobile local search. They conclude that map-based interfaces are useful when a specific address has a strong impact on the preference while text-based interfaces are useful when many types of information are provided in the results. Since local businesses displayed in our search results contain many features and various kinds of information, users’ click preferences in our study support the claims given in [41]. Ravari et al. [40] report that 70% of sessions result with routing (a user decides to drive to the target location). Similarly, 44% of our queries contain clicks that result in displaying details and routing information about a local business. These conclusions strongly indicate the actionable nature of the mobile local search.
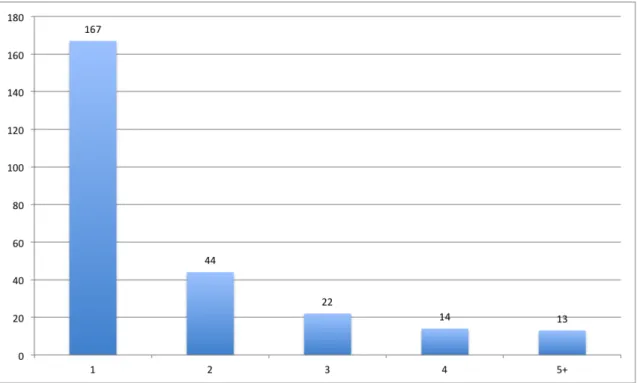
Figure 4.13 depicts distribution of queries for click counts. It shows that 18% of the total query volume contain only 1 result click. The percentage of queries that contains 2 result clicks is 29%, that is higher than the percentage of queries with only 1 result click. Additionally, 16% of the total query volume contain at least 3 result clicks. Given these percentages, average number of clicks per query is 1,56 among all queries. When we ignore the queries with no click, average number of clicks per query goes up to 2,41. Kamvar et al. [3] report that the average number of clicks per query is 1,7 for the queries with at least one result click. We speculate that mobile local search is still an emerging area, and local search results are not as satisfying as general search.
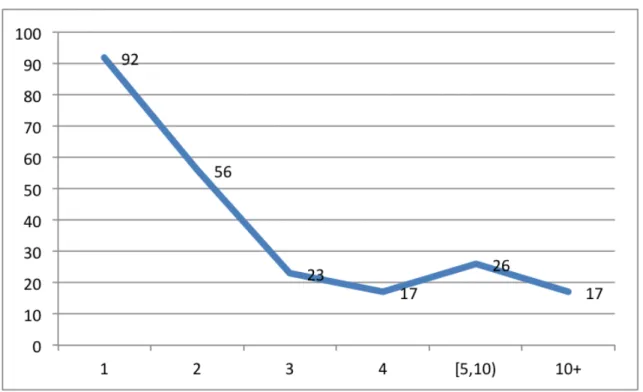
Figure 4.14 depicts the distribution of the click ranks. We conclude that the average position of a result selection is 6, with the actual average click position value as 5.33. It is also shown that 56% of the queries contain a click within the top 3 ranks. The numbers we report are very close to the numbers reported by [38]. We can state that the click rank distribution for mobile local search is similar to that of the general mobile search. Additionally, users have more tendency to click to items other than the first item in the result list, compared to the general web search. Baeza et al. [42] report that more than 50% of result selections occur on the first result for the general web queries. Although users are just inherently more likely to select top-ranked results [43], information snippets about local businesses shown in the result lists may attract users to click on result items with lower ranks. Lastly, we see that there are considerable amount of clicks in the lower ranks. We speculate the reason behind this as follows: In the Gezinio application, users go up and down in the result list with scrolling actions. Scrolling is the action in which a user puts her finger to the screen and movies it up or down. Since it is a very simple action to perform, we think that users usually view the local businesses and perform clicks in the lower ranks very easily.
Click Type Number of Queries Percentage
Map Pin Click 151 11%
Result List Click 695 54%
Details Click 578 44%
Result List Click or Details Click 776 60% Result List Click and Details Click 497 38% Any Type of Click 825 64%
Chapter 5
Experiments and Results
In this chapter, we present results of the data analysis we performed on the collected data set to investigate the role of social features in mobile local search. We start by describing a few ranking metrics, learning to rank methods and software tools that we used in the study. Afterwards, we detail our data pre-processing and training steps. Finally, we present our results and interpretations. In this thesis, our main motivation is investigating effect of social features on local search experience of mobile users. We formulate our work as a learning-to-rank problem. We use a few learning-to-learning-to-rank methods such as Multiple Additive Regression Trees (MART) [10] and LambdaMART [44] to build ranking mod-els and re-rank the search results using these ranking modmod-els. We expect these ranking models to utilize social features and improve the search result rankings. Then, we evaluate these models to see whether these re-rankings improve the per-formance of rankings or not. Additionally, we analyze social features individually to see how they effect the search result rankings. We investigate importance of individual features on all of the queries, and queries of the most popular cate-gories. This approach helps us to reveal the fact that individual features have varying degrees of importance on different categories.
learning rates to support our findings.
5.1
Ranking Performance Metrics
There are many measures that are commonly used for evaluating how well a re-ranking algorithm performs on a data set. Discounted Cumulative Gain (DCG) and its normalized variant Normalized Discounted Cumulative Gain (NDCG) are usually preferred in academic research when multiple levels of relevance are used [45], [46]. Recently, several new evaluation metrics have been proposed such as Expected Reciprocal Rank (ERR) [47]. It is claimed in [47] that ERR models user’s satisfaction with search results better than the DCG metric. In this study, we use NDCG and ERR metrics for training and testing the ranking models.
5.1.1
Normalized Discounted Cumulative Gain
DCG uses a graded relevance scale to measure the usefulness of a search result based on its position in the search result list. Gain of each search result is discounted at lower ranks. It accumulates the gain from the top to the bottom of the search result list [45], [46].
DCG assumes that highly relevant documents are more useful if they have higher ranks in the search result list. For this reason, it penalizes highly relevant documents appearing in lower ranks by reducing the graded relevance value log-arithmically proportional to the position of the result [45], [46]. The discounted cumulative gain accumulated at a particular rank position p is defined as:
DCGp = p X i=1 2reli−1 log2(i + 1)
Search result lists vary in length depending on the query. Therefore, the perfor-mance of queries can not be compared consistently by using DCG. The cumulative
gain should be normalized across queries. This is done by sorting the documents of a result list by relevance and producing the maximum possible DCG till po-sition p, also called Ideal DCG (IDCG) till that popo-sition [45], [46]. For a query, Normalized Discounted Cumulative Gain (NDCG) at a particular rank position p, is computed as:
N DCGp =
DCGp
IDCGp
5.1.2
Expected Reciprocal Rank
DCG assumes that a document in a given position has always the same gain and discount independent of the documents above it. However, the probability that a user browses to some position in the ranked list depends on usefulness of documents above the browsed rank. This has been considered as a drawback. Another model type, named as cascade model, analyzes user click behavior by considering the likelihood a user examines a document at a specific rank is de-pendent on how satisfied the user was with the previously observed documents in the search result list. A new metric within this model, Expected Reciprocal Rank (ERR) that implicitly discounts documents which are shown below very relevant documents is proposed by [47].
The cascade model assumes that a user views search results from top to bot-tom. She has a certain probability of being satisfied at each position. Let Ri be
this probability at position i. This value can be estimated by maximum likelihood on the click logs [47]. For a given set of Ri, the likelihood of a user is satisfied
and stops at position r is:
r−1
Y
i=1
(1 − Ri)Rr
This formula calculates the probability that the user is not satisfied with the first r − 1 results and satisfied with the rth one. Based on this, ERR is computed