p53 polymorphism influences response in cancer
chemotherapy via modulation of p73-dependent apoptosis
Daniele Bergamaschi,1,9Milena Gasco,2,9 Louise Hiller,3,9Alexandra Sullivan,1,9Nelofer Syed,1,9Giuseppe Trigiante,1,9Isik Yulug,4,9Marco Merlano,2Gianmauro Numico,2 Alberto Comino,5Marlene Attard,1Olivier Reelfs,1Barry Gusterson,6Alexandra K. Bell,6 Victoria Heath,6Mahvash Tavassoli,7Paul J. Farrell,1Paul Smith,8Xin Lu,1and Tim Crook1,*
1Ludwig Institute for Cancer Research, Imperial College Faculty of Medicine, St. Mary’s Campus, Norfolk Place, London, W2 1PG, England
2Department of Medical Oncology, Azienda Ospedaliera S Croce e Carle, Via Coppino 26, 12100 Cuneo, Italy 3Cancer Research UK Clinical Trials Unit, Institute for Cancer Studies, University of Birmingham, Birmingham, England 4Department of Molecular Biology and Genetics, Bilkent University, Ankara, Turkey
5Department of Pathology, Azienda Ospedaliera S Croce e Carle, Via Coppino 26, 12100 Cuneo, Italy 6Department of Pathology, University of Glasgow, Western Infirmary, Glasgow, Scotland
7King’s College School of Medicine and Dentistry, Coldharbour Lane, London, SE5 8Department of Biology, Brunel University, Uxbridge, England
9These authors contributed equally to this work. *Correspondence: [email protected]
Summary
Intact p73 function is shown to be an important determinant of cellular sensitivity to anticancer agents. Inhibition of p73 function by dominant-negative proteins or by mutant p53 abrogates apoptosis and cytotoxicity induced by these agents. A polymorphism encoding either arginine (72R) or proline (72P) at codon 72 of p53 influences inhibition of p73 by a range of p53 mutants identified in squamous cancers. Clinical response following cisplatin-based chemo-radiotherapy for advanced head and neck cancer is influenced by this polymorphism, cancers expressing 72R mutants having lower response rates than those expressing 72P mutants. Polymorphism in p53 may influence individual responsiveness to cancer therapy.
Introduction Wild-type p53 function is compromised in the majority of human tumors yet is intact in normal cells of the host (Vogelstein et al., Apoptosis is a fundamental mechanism by which DNA-damag- 2000). As such, the selectivity of anticancer drugs cannot be ing anticancer agents cause cytotoxicity (Johnstone et al., accounted for by p53-dependent apoptosis alone. The p53 rela-2002). p53 has a major function in transducing stress to the tive p73 also functions in transduction of specific types of DNA apoptotic machinery of the cell, consistent with the importance damage. For example, activation of the p73/c-abl pathway by of p53 status as a determinant of cellular response to DNA- some chemotherapeutic agents causes apoptosis via target damaging drugs (Lowe et al., 1993, 1994). The presence of genes such as AIP1 (Gong et al., 1999; Costanzo et al., 2002). intact p53 function confers tumor sensitivity to DNA-damaging p73 exists as several splice variants at both N and C termini. agents including cisplatin and hence potential curability of can- N-terminal variants lacking the transactivation domain may act cers such as germ-cell tumors (Riou et al., 1995). Despite the as dominant-negative inhibitors of both p53 and p73 (Stiewe
et al., 2002). recognized role of p53 in determining cellular sensitivity to
anti-cancer agents, anti-cancers with intact p53 function are in a minority. In squamous cell carcinomas (SCC), mutants occurring in the arginine allele (72R) are detected more commonly than those Mutations in p53 are reported to occur in at least 50% of human
cancers (Vogelstein et al., 2000). The resultant mutant proteins in the proline allele (72P) at the polymorphic codon 72 (Marin et al., 2000; Brooks et al., 2000). These findings were subsequently are frequently functionally compromised for apoptosis
induc-tion. Indeed, there is now evidence that apoptosis is the p53 verified independently in other cancers (Tada et al., 2001; Furi-hata et al., 2002). The nonrandom retention and expression of function selected against in tumorigenesis (Schmitt et al., 2002).
S I G N I F I C A N C E
Molecular genetic factors predictive of clinical outcome would be of great value in oncology. We show that p73 is a determinant of cellular response to a range of anticancer drugs and that polymorphism in p53 influences response in head and neck cancer, at least in part, via its influence on the inhibition of p73-dependent apoptosis by mutant p53. Patients whose cancers express p53 mutants with mutation in the 72arginine (72R) variant have a worse response to therapy than those expressing p53 mutants encoding proline at position 72 (72P). Expression of 72R mutants that efficiently inhibit p73 is associated with a particularly poor outcome to therapy. Our results thus establish a link between polymorphism in p53 and individual response to cancer therapy.
p53 mutants implies the existence of selective pressure(s) dur- expressing the inactive p73DD (L371P) exhibited similar sensi-tivity to control Saos-2 cells (Figure 2C). In colony-forming ing tumorigenesis that confer a selective advantage to cells
expressing 72R mutants, resulting in overrepresentation of 72R assays, survival of lines expressing either dominant-negative form of p73 was higher than control cells and those expressing mutations in carcinomas. p73 and the related p63 are targets
for transdominant inhibition by specific p53 mutants (Di Como the inactive p73DD (L371P) following drug exposure (Figure 2D). et al., 1999; Marin et al., 2000; Strano et al., 2000, 2002; Gaiddon
et al., 2001). A possible mechanism to account for the bias p53 mutants confer anticancer drug resistance: Effect of p53 polymorphism
toward 72R mutants in carcinomas was afforded by the
obser-vation that inhibition of p73 is influenced by the polymorphism These data imply a role for p73 in mediating the cytotoxicity of anticancer agents and show that cellular sensitivity can be at codon 72. The 72R forms of mutants 143A and 175H more
efficiently associate with p73 and inhibit p73-dependent target modified by dominant-negative inhibition of p73. Specific p53 mutants are able to inhibit p73. For mutants 143A and 175H, gene upregulation than equivalent 72P mutants (Marin et al.,
2000), but other mutants associate with p73 in both 72R and this activity is enhanced if the p53 mutant expresses arginine (72R) rather than proline (72P) at codon 72 (Marin et al., 2000). 72P forms (Marin et al., 2000; Gaiddon et al., 2001). Because of
its modulatory effects on p53 mutant function, it is an interesting We thus wished to determine whether expression of 72R and 72P variants of a wide range of p53 mutants influences cellular possibility that treatment outcome in human cancer is influenced
by the polymorphism (Soussi and Be´roud, 2001). Such a model sensitivity to p73-dependent, drug-induced apoptosis in vitro. First, we tested in transient assays the ability of 72R and 72P presupposes that p73 is an important determinant of cellular
sensitivity to anticancer drugs, but definitive evidence of this is polymorphic variants of mutants identified in head and neck squamous cell cancers (HNSCC) to inhibit apoptosis resulting lacking. In the present work, we have investigated this
hypothe-sis at a mechanistic and molecular pathological level. from expression of p73 (Figure 3A). In total, 13/25 tested mu-tants produced at least a 50% inhibition of p73-dependent apo-ptosis (173L, 175H, 176Y, 179R, 179Y, 220C, 242Y, 245D, 245S, Results
248W, 249S, 273C, 282W). Although 72P variants of the positive mutants were clearly able to inhibit p73-induced apoptosis, p73 is induced by anticancer agents
and modulates cellular sensitivity the 72R variant more efficiently inhibited apoptosis than the corresponding 72P (Figures 3A and 3B). The remaining 12 mu-Steady-state levels of endogenous p73 were analyzed by
West-ern blotting following cytotoxic drug treatment in a range of tants caused less than a 50% reduction in p73-induced apopto-sis irrespective of the polymorphism (Table 1). Next, we wished cancer cell lines, predominantly SCC of the head and neck
but also including SCC of the cervix (C33a), vulva (A431), and to determine whether inhibition of p73 by the 72R and 72P variants of the p53 mutants correlates with the relative ability immortalized skin keratinocytes (Hacat). Levels of endogenous
p73 increased in each of the squamous carcinoma cell lines to form stable complexes. To achieve this, we tested a subset of the mutants in transfection/coimmunoprecipitation assays following exposure to cisplatin, doxorubicin, taxol, and
etopo-side (Figure 1A). There were variations in induction of p73 by similar to those described previously to demonstrate associa-tion between mutant p53 and p73 (Di Como et al., 1999; Marin different drugs in the individual cell lines. For example,
doxorubi-cin caused an increase in p73 in all cell lines analyzed. Further, et al., 2000; Strano et al., 2000; Gaiddon et al., 2001). In these assays, 72R mutants more efficiently associated with p73, there was induction of p73 by each tested drug in HSC3 and
BICR31, whereas doxorubicin, taxol, and cisplatin but not eto- whereas the 72P variants of these mutants also bound to p73 but with lower efficiency than the 72R (Figure 3C). The superior poside caused p73 induction in HN30. Quantitative PCR
analy-sis revealed that expression of AIP1 mRNA was increased by ability of the 72R variant of mutants such as 173L, 175H, 179Y, and 245D to inhibit p73-dependent apoptosis was also reflected drug treatment that caused upregulation of p73 (Figure 1B).
We next addressed the possibility that induction of p73 in their greater association with p73 relative to the 72P (Figure 3C). Consistent with its inability to inhibit p73-dependent apo-contributes to the cytotoxicity of these anticancer agents.
Saos-2 cells were transiently transfected with full-length p73␣ ptosis, mutant 142L did not detectably bind to p73 in either 72R or 72P forms (Figure 3C). p53-induced apoptosis was also together with the dominant-negative inhibitors p73⌬2 and
p73DD or with the inactive point mutated p73DD (L371P). inhibited by some of the p53 mutants, but in contrast to p73, this activity was not influenced by the polymorphism (Figure 3D). Saos-2 cells have been shown to activate an endogenous
pro-gram of p73-dependent gene expression in response to doxoru- To directly assess the effect of the p53 polymorphism on drug-induced apoptosis and cytotoxicity, we established iso-bicin, including upregulation of AIP1, and are thus a suitable
cell line for such experiments (Costanzo et al., 2002). Both genic Saos-2 cell lines expressing 72R and 72P forms of each p53 mutant. The steady-state levels of p53 protein in the cell p73⌬2 and p73DD bind to p73 and inhibit its transactivating
activity whereas p73DD (L371P) lacks this activity (Irwin et al., lines analyzed were similar to those of endogenous p53 mutants such as seen in head and neck cancer cell lines (Figure 4). We 2000; Fillippovich et al., 2001). Expression of p73␣ alone caused
apoptosis, which was efficiently inhibited by p73⌬2 and p73DD initially analyzed Saos-2 cell lines expressing equal steady-state levels of the p53 mutants 173L, 175H, and 179Y (Figure 4A). but not by p73DD (L371P) (Figures 2A and 2B). To further
estab-lish a potential role for p73 in mediating cytotoxicity, we estab- These mutants were detected in individual patients in both 72R and 72P forms in HNSCC and, moreover, the polymorphic vari-lished Saos-2 cell lines expressing the dominant-negative
inhibi-tors of p73 and tested their sensitivity to drug-induced apoptosis ants showed differences in their ability to inhibit p73 (Figure 3). Cells were exposed to various anticancer drugs and apoptosis and cytotoxicity. Consistent with transient assays, cell lines
expressing p73⌬2 and p73DD were less sensitive to apoptosis assessed by flow cytometry. Expression of the three mutants reduced cellular sensitivity to drug-induced apoptosis com-following exposure to cisplatin, doxorubicin, and taxol, but lines
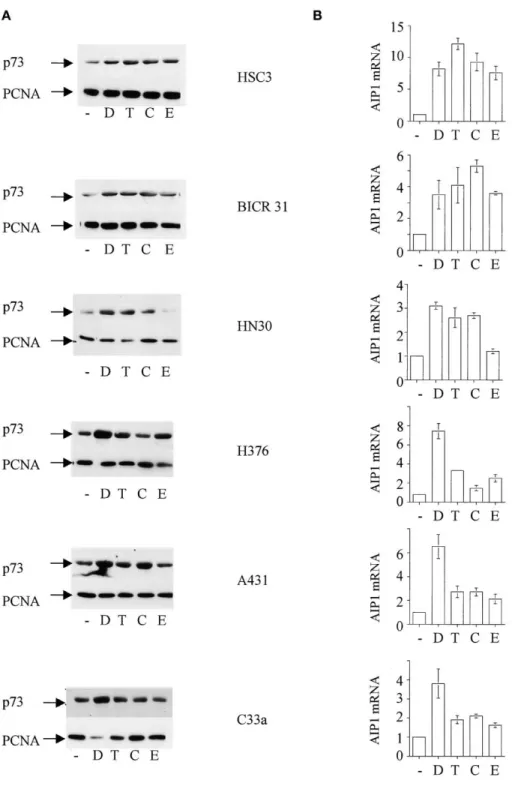
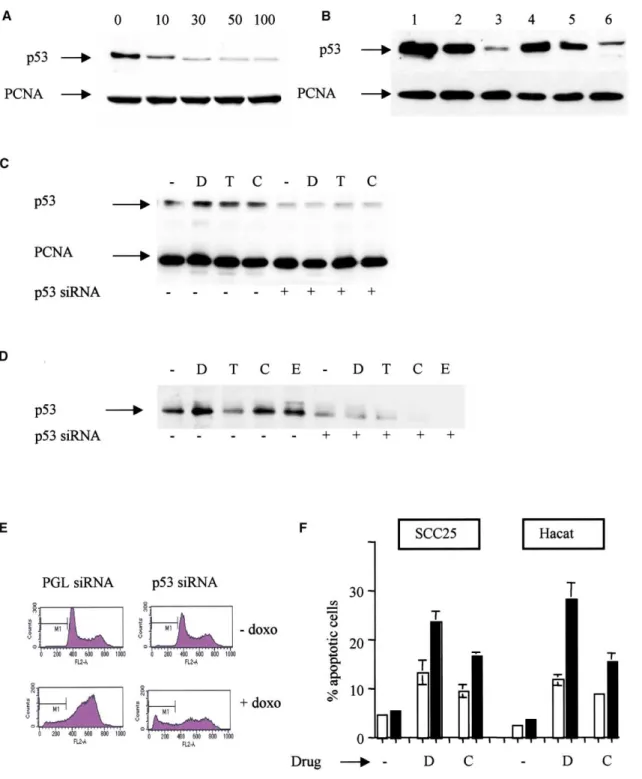
Figure 1. Anticancer drugs induce p73 function
in squamous carcinoma cell lines
A: Cytotoxic drugs induce p73 in squamous
car-cinoma cell lines. The indicated cell lines were treated with chemotherapeutic drugs: —⫽ no drug; D⫽ doxorubicin; T ⫽ taxol; C ⫽ cisplatin; E ⫽ etoposide. The following concentrations were used: doxorubicin 1g/ml; taxol 500 ng/ml; cisplatin10g/ml; etoposide 10 M. Twenty-four hours after drug exposure, cell lysates were pre-pared and steady-state levels of p73 determined by Western blotting. Equal protein loading in each lane was confirmed by reprobing the blot with PC-10, an antibody to PCNA.
B: Anticancer drugs activate AIP1. Squamous
carcinoma cell lines were treated with the indi-cated drugs at the above concentrations. After 24 hr, total RNA was isolated and the level of AIP1 RNA determined using TaqMan PCR. Data shown are mean mRNA levels (⫾ 1SD), normal-ized to GAPDH, relative to untreated cells from two independent experiments.
pared to control cells (Figures 4B and 4C). In cells expressing inhibition when expressed as the 72R form relative to the 72P (Table 1). In contrast, expression of other mutants such as 142L, the 72R variant, apoptosis was reduced almost to levels seen
in untreated control cells, whereas the reduction in apoptosis 152Q, 158G, and 161V had only small effects on cellular sensitiv-ity to drug-induced apoptosis, irrespective of the polymorphism in cells expressing the 72P variant was less pronounced (Figure
4C). The mutant 142L, which did not detectably associate with (Table 1). We next further analyzed a subset of these mutants to determine whether differences in apoptosis inhibition were p73, had only a minimal effect on drug-induced cytotoxicity
in either the 72R or 72P form (Figure 4C). To extend these related to the different abilities of the mutants to block induction of AIP1, a recognized target gene for p73 (Costanzo et al., 2002). observations, we next analyzed cell lines expressing the 72R
and 72P variants of the remaining 22 mutants identified in our Activation of the AIP1 promoter by cisplatin or doxorubicin treat-ment was inhibited by 173L, 175H, and 179Y, in each case the patients. Mutants 176Y, 179R, 220C, 242Y, 245S, 245D, 282W,
Figure 2. p73 is a determinant of cytotoxic drug action in human carcinoma cells
A: Inhibition of p73-dependent apoptosis by coexpression of dominant-negative p73 proteins. Saos-2 cells were transfected with the indicated expression
plasmids (10g), and apoptosis was determined by flow cytometry after 24 hr as described in Experimental Procedures. In the plate designated as vector, cells received only empty expression vectors. p73⌬2 and p73DD are dominant-negative p73 proteins. The sub-G1 cell population is indicated as M1. The profiles shown are representative of four independent experiments.
B: Inhibition of p73-dependent apoptosis by dominant-negative p73 proteins p73⌬2 and p73DD, but not the inactive p73DD (L371P). The histogram summarizes the results of four independent transfection experiments. Data shown are mean apoptosis⫾ 1SD.
C: Abrogation of p73 function inhibits induction of apoptosis by DNA-damaging anticancer agents. Saos-2 cell lines stably expressing the indicated
dominant-negative p73 proteins were treated with the indicated drugs (doxorubicin 1g/ml; taxol 500 ng/ml; cisplatin 10 g/ml) and apoptosis determined by flow cytometry after 24 hr. Controls containing vector only DNA sequences were treated with drug vehicle only (untreated). Data shown are mean % sub-G1 cells⫾ 1 SD from at least three separate experiments.
D: Inhibition of p73 confers resistance to anticancer agents. Saos-2 cell lines stably expressing the indicated p73 proteins or containing empty vector only
(control) were treated with varying concentrations of cisplatin or doxorubicin. Survival was determined by colony-forming assay. Data shown are means⫾ SD of at least three separate experiments. Similar results were obtained from several independent clones.
equivalent 72P mutant (Figure 4D). The mutant 142L, which Mutants, which did not inhibit drug-induced apoptosis, did not significantly increase resistance to the cytotoxic effects of anti-failed to inhibit drug-induced apoptosis, also anti-failed to inhibit
cancer drugs. AIP1 induction (Figure 4D). We next determined the effect of
the polymorphism on the cytotoxicity of anticancer drugs in the
cell lines used for apoptosis analysis. Cells were exposed to Modulation of cellular drug sensitivity by siRNA
varying concentrations of each agent and colony survival deter- To verify the hypothesis that mutant p53 increases resistance mined. Mutants previously shown to most efficiently inhibit apo- to anticancer agents via interaction with p73, we tested the ptosis also conferred the highest degree of resistance to cyto- ability of small inhibitory RNA (siRNA) oligonucleotides to modu-toxicity of cisplatin (Figure 4E). Thus, cell lines expressing the late cellular drug sensitivity. To assess the effects on 72R and 72R variant of “hot spot” mutants 173L, 175H, 179 acquired 72P p53 mutants, we initially analyzed the effect of siRNA against p53 in isogenic Saos-2 cells expressing 72R and 72P the greatest resistance to cytotoxicity (Figure 4E and Table 1).
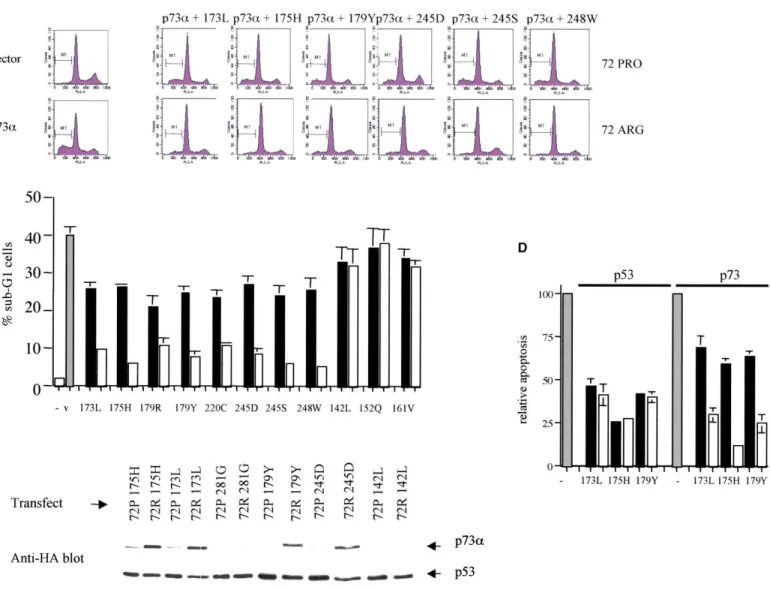
Figure 3. Polymorphism in p53 influences transdominant inhibition of p73 by a wide range of human tumor-associated mutants
A: Transient assays of p73-induced apoptosis in cells transfected with 72R and 72P p53 mutants. Saos-2 cells were transfected with plasmids expressing
p73␣ (10 g) and the indicated p53 mutants (20 g), together with pCD20 (3 g). Twenty-four hours following transfection, cell cycle distribution and DNA content were determined by flow cytometry as described in Experimental Procedures. Sub-G1 cells are designated M1. The flow cytometry profiles shown are representative of at least three experiments.
B: Summary of superior inhibition of p73-dependent apoptosis by 72R p53 mutants. Data shown are means (⫾ 1SD) from at least three experiments in which Saos-2 cells were transfected with 10g of p73␣ and 20 g of p53 expression plasmid.
C: Association of polymorphic p53 mutants with p73␣ correlates with inhibition of drug-induced apoptosis and cytotoxicity. Saos-2 cells were transfected
with HA-tagged p73␣ (10 g) and the indicated p53 mutants as the 72R or 72P variant (20 g). Twenty-four hours later, cell lysates were prepared and subjected to immunoprecipitation with PAb1801. Immunoblotting was done with anti-HA polyclonal antiserum (Y11). Mutant 281G in our hands associates inefficiently with p73 and is used as a negative control. The remaining mutants are all from the HNSCC cases described in this study. 142L which does not affect sensitivity to drug-induced apoptosis associates very weakly with p73. The remaining mutants shown associate more efficiently with p73 when in the 72R form. Note that this correlates with more efficient inhibition of p73-dependent apoptosis.
D: Polymorphism in mutant p53 influences transdominant inhibition of p73 but not wild-type p53. Saos-2 cells were transfected with expression plasmids
encoding either wild-type p53 or full-length p73␣ as indicated (gray panels), together with the indicated plasmids expressing either the 72P (black panel) or 72R (open panel) form of each p53 mutant. Sub-G1 cells were determined 24 hr after transfection by FACS assay. The graph shows percentage of sub-G1 cells relative to transfection of p53 or p73 alone (which are designated as 100%). Data are mean percentages of sub-sub-G1 cells induced by p53 or p73 alone⫾ 1SD from at least four independent experiments.
forms of the mutant 173L, which had been demonstrated to previously shown to upregulate p73 in response to cytotoxic drug exposure. Treatment with p53-specific siRNA reduced efficiently inhibit p73 (Figure 3). There was a dose-dependent
reduction in steady-state levels of both 72R and 72P forms of steady-state levels of p53 both in head and neck and other squamous carcinoma cell lines (Figure 5C and data not shown). this mutant following treatment with p53-specific siRNA (Figures
5A and 5B). The control PGL3 siRNA did not affect p53 levels. Despite upregulating p73 levels (see Figure 1), cytotoxic drug treatment did not increase p53 levels, but treatment with siRNA We also tested the ability of siRNA to downregulate expression
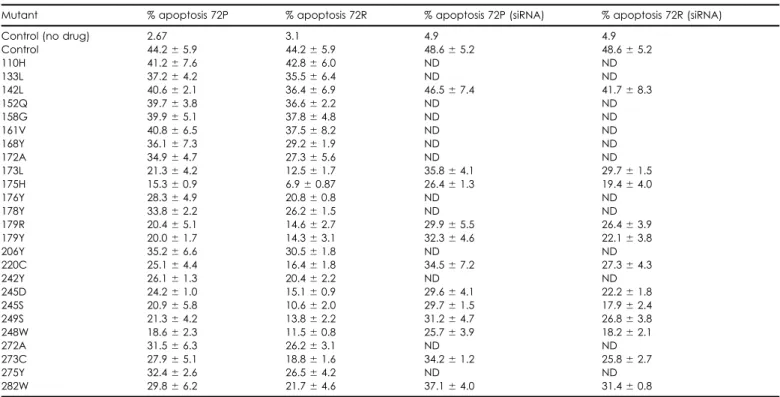
pres-Table 1. Inhibition of cisplatin-induced apoptosis by human tumor-associated p53 mutants
Mutant % apoptosis 72P % apoptosis 72R % apoptosis 72P (siRNA) % apoptosis 72R (siRNA)
Control (no drug) 2.67 3.1 4.9 4.9
Control 44.2⫾ 5.9 44.2⫾ 5.9 48.6⫾ 5.2 48.6⫾ 5.2 110H 41.2⫾ 7.6 42.8⫾ 6.0 ND ND 133L 37.2⫾ 4.2 35.5⫾ 6.4 ND ND 142L 40.6⫾ 2.1 36.4⫾ 6.9 46.5⫾ 7.4 41.7⫾ 8.3 152Q 39.7⫾ 3.8 36.6⫾ 2.2 ND ND 158G 39.9⫾ 5.1 37.8⫾ 4.8 ND ND 161V 40.8⫾ 6.5 37.5⫾ 8.2 ND ND 168Y 36.1⫾ 7.3 29.2⫾ 1.9 ND ND 172A 34.9⫾ 4.7 27.3⫾ 5.6 ND ND 173L 21.3⫾ 4.2 12.5⫾ 1.7 35.8⫾ 4.1 29.7⫾ 1.5 175H 15.3⫾ 0.9 6.9⫾ 0.87 26.4⫾ 1.3 19.4⫾ 4.0 176Y 28.3⫾ 4.9 20.8⫾ 0.8 ND ND 178Y 33.8⫾ 2.2 26.2⫾ 1.5 ND ND 179R 20.4⫾ 5.1 14.6⫾ 2.7 29.9⫾ 5.5 26.4⫾ 3.9 179Y 20.0⫾ 1.7 14.3⫾ 3.1 32.3⫾ 4.6 22.1⫾ 3.8 206Y 35.2⫾ 6.6 30.5⫾ 1.8 ND ND 220C 25.1⫾ 4.4 16.4⫾ 1.8 34.5⫾ 7.2 27.3⫾ 4.3 242Y 26.1⫾ 1.3 20.4⫾ 2.2 ND ND 245D 24.2⫾ 1.0 15.1⫾ 0.9 29.6⫾ 4.1 22.2⫾ 1.8 245S 20.9⫾ 5.8 10.6⫾ 2.0 29.7⫾ 1.5 17.9⫾ 2.4 249S 21.3⫾ 4.2 13.8⫾ 2.2 31.2⫾ 4.7 26.8⫾ 3.8 248W 18.6⫾ 2.3 11.5⫾ 0.8 25.7⫾ 3.9 18.2⫾ 2.1 272A 31.5⫾ 6.3 26.2⫾ 3.1 ND ND 273C 27.9⫾ 5.1 18.8⫾ 1.6 34.2⫾ 1.2 25.8⫾ 2.7 275Y 32.4⫾ 2.6 26.5⫾ 4.2 ND ND 282W 29.8⫾ 6.2 21.7⫾ 4.6 37.1⫾ 4.0 31.4⫾ 0.8
All experiments were performed in Saos-2 cells stably expressing the indicated p53 mutants. Cells were treated with 10g/ml cisplatin and apoptosis determined after 24 hr by flow cytometry as described in Experimental Procedures. Where indicated, cells were exposed to 100M p53 siRNA 48 hr before cisplatin treatment. Data are mean apoptosis⫾ 1SD from two experiments.
ence and absence of drug exposure (Figure 5C). We also wished determine the utility of p53 siRNA to sensitize such cells to anticancer drugs. We tested mutants 175H, 179Y, 179R, 245S, to determine whether siRNA to p53 caused reduced association
of mutant p53 with p73. We therefore examined by immunoblot- 248W, 249S, 273C, and 282W. These hot spot mutants together comprise a substantial proportion of human tumor-associated ting endogenous complex formation with and without siRNA.
The increase in p73 protein caused by drug exposure was unaf- mutants (Vousden and Lu, 2002). Each of the mutants had previously been shown to increase resistance to cisplatin, par-fected by p53 siRNA (Figure 5D), but there was a clear reduction
in the amount of bound mutant p53 immunoprecipitated with ticularly when expressed in the 72R form (Table 1). Treatment with p53 siRNA increased the sensitivity of cell lines expressing p73 in cells treated with p53 siRNA prior to exposure to cytotoxic
drugs (Figure 5D). Thus, whereas total p73 protein levels are each of these mutants (in both 72R and 72P forms) to cisplatin and doxorubicin (Table 1). Representative dose response curves unaffected, p53 siRNA causes a significant reduction in p73
mutant p53 complex formation. In cells treated with p53 siRNA are shown in Figure 6B. then exposed to anticancer drugs, there was a clear increase
in apoptosis compared to cells either mock-transfected with 72R p53 mutants correlate with poor response in head and neck cancer
siRNA or transfected with the PGL siRNA (Figure 5E). Although
the magnitude of the enhancement of apoptosis caused by Taken together, the in vitro studies described above reveal roles for both p73 and p53 polymorphism in influencing anticancer mutant p53 downregulation varied between cell lines, inhibition
of mutant p53 expression caused a consistent increase in drug- drug sensitivity. We thus wished to determine whether treatment outcome in vivo is influenced by mutation and polymorphism induced apoptosis in all cell lines tested (Figure 5F).
In the Saos-2 cells expressing 72R and 72P mutants, we in p53 in cancers arising in tissues expressing p73. We therefore analyzed expression of p73 and the sequence of p53 in a series tested in colony survival assays the effect of p53 siRNA on
drug-induced cytotoxicity (Figure 6). We initially analyzed clones of 70 inoperable head and neck cancers treated with chemo-radiotherapy. Each patient presented with locally advanced, expressing 173L, which we previously showed to inhibit p73
and increase drug resistance. When pretreated with p53 siRNA, unresectable TNM stage III/IV HNSCC and received multimodal treatment consisting of radiotherapy alternated with platinum-such cells (expressing either 72R or 72P forms of the mutant)
were substantially more sensitive to doxorubicin and cisplatin based chemotherapy. Clinico-pathological details of the cases are shown in Table 2.
than untreated cells or cells treated with the PGL siRNA oligos
(Figure 6A; Table 1). siRNA treatment had only a small effect The frequency of the codon 72 genotypes in the cases did not differ from that in normal tissue controls: cases RR⫽ 54%; on drug sensitivity in cells expressing the p53 mutant 142L,
which does not detectably inhibit p73 in our assays (Table 1). We RP⫽ 40%; PP ⫽ 6%. Controls: RR ⫽ 55%; RP ⫽ 50%; PP ⫽ 5% (2 ⫽ 1.85; p⫽ 0.40). Mutations were detected in 40/70
cases (57%). In cancers arising in individuals heterozygous R/P versus 16.1 months (95% CI⫽ 12.5–24.5)), 2⫽ 3.9, p ⫽ 0.05.
There was no significant difference in survival between the 25 at codon 72 (n⫽ 19), mutations were detected more commonly
in the 72R allele (14 mutations in 72R and 5 mutations in 72P; cases with p73-inactivating mutations and the remaining 15 patients (15/25 dead versus 6/15 dead, median survival⫽ 29.3 p⫽ 0.0394).
Twenty-five out of the twenty-seven patients with wild-type months (95% CI⫽ 16.8-not reached) versus 45.0 (95% CI ⫽ 21.0-not reached)),2⫽ 0.9, p ⫽ 0.34.
p53 (93%) gained complete response to treatment (CR), as
opposed to only 23 out of the 40 patients with p53 mutations Of the 25 cases expressing mutants which efficiently inacti-vate p73, 6 of the mutations were in the 72P allele and 19 in (58%) (p⫽ 0.0044). At the time of analysis, 30/70 (43%) patients
have died or progressed. Median time to death or progression the 72R (Table 2). Of the 6 in the 72P allele, 5 (83%) achieved CR. Of the 19 in the R, 6 (32%) achieved CR (p⫽ 0.06). At the of these 30⫽ 13.1 months (inter quartile range, IQR ⫽ 7.6 to
18.4). Median follow up for the 40 alive and progression-free time of analysis, 19 of the 25 patients had progressed or died (median PFS⫽ 16.1 months, 95% CI ⫽ 12.5–24.5). PFS was patients⫽ 33.9 months (IQR ⫽ 16.9 to 44.7).
Progression-free survival (PFS) was significantly longer for significantly longer if mutation was in the 72P rather than 72R allele (1/6 progressed or died versus 18/19 progressed or died, complete responders than for partial responders (13/48
pro-gressed or died versus 14/19, respectively; % surviving progres- median PFS not reached (95% CI 18.5–not reached) versus 13.5 (95% CI⫽ 10.0 – 16.4)), 2⫽ 8.5, p ⫽ 0.0036). At the time
sion free at 2 yr⫽ 77% versus 28%; 2⫽ 25.7, log rank p ⬍
0.0001). There was also significantly longer PFS for patients of analysis, 15 out of the 25 patients had died (median survival⫽ 29.3 months, 95% CI ⫽ 16.8–not yet reached). Survival was with wild-type p53 rather than those with mutant p53 (5/30
progressed or died versus 25/40 respectively; % surviving at 2 significantly longer for patients with mutations in the 72P rather than the 72R allele (0/6 dead versus 15/19 dead, median survival yr ⫽ 82% versus 46%; 2⫽ 11.4, log rank p ⫽ 0.0007). The
significance of p53 mutation remained even in the presence not reached (95% CI not reached–not reached) versus 19.4 (95% CI⫽ 13.8–32), 2⫽ 9.1, p ⫽ 0.0026) (Figure 7A).
of other known prognostic variables (age, performance status,
stage, site of primary tumor, and nodal status) (p⫽ 0.002). For These data all imply that p73 may have an important function in mediating the activity of anticancer drugs in vivo and in vitro. the 40 cases with mutations, PFS was significantly longer for
patients with mutant 72P rather than 72R (1/8 progressed or It was therefore of interest to determine whether expression of p73 per se might be of prognostic value. We thus assessed p53 died versus 24/32, respectively; % surviving progression free
at 2 yr⫽ 83% versus 38%; 2⫽ 6.9, log rank p ⫽ 0.0087). and p73 expression using immunocytochemistry in 50 cases for
which sections were available (Figure 7B) and scored these At the time of analysis, 26/70 patients had died (37%). The
median time to death of these patients ⫽ 14.9 months (inter cases for nuclear expression. p53 expression was detected in 31/50 cases and expression of p73 in 19/50 cases. After group-quartile range, IQR⫽ 7.6 to 27.0). The median followup for the
44 living patients⫽ 31.7 months (IQR ⫽ 17.2 to 44.7). ing patients into positive p73, wild-type p53 (n⫽ 10), positive p73, mutant p53 (n⫽ 9), negative p73, wild-type p53 (n ⫽ 11), There was significantly longer survival for patients achieving
CR than PR (11/48 dead versus 12/19 dead; % surviving at 2 and negative p73, mutant p53 (n⫽ 20), survival was found to be similar between groups (log rank 2 ⫽ 2.7, log rank p ⫽
yr⫽ 85% versus 43%; 2⫽ 20.0, log rank p ⬍ 0.0001). Survival
was also significantly longer for patients without mutations (5/30 0.45). Thus steady-state p73 expression does not appear in this small sample to be predictive of survival. However, analysis dead versus 21/40, respectively; % surviving at 2 yr ⫽ 82%
versus 62%; 2⫽ 7.6, log rank p ⫽ 0.0058). The significance of response rates across the four groups revealed that p73
expression and p53 mutational status together may be pre-of p53 status remained even in the presence pre-of other known
prognostic variables (p⫽ 0.02). dictive of response (2 test for trend p value ⫽ 0.03). Thus,
taking together p73 expression with p53 mutation status, p73 For the 40 cases with mutations, there was significantly
longer survival for patients with mutation in the 72P allele rather expression may have predictive value in terms of response. than 72R (0/8 dead versus 21/32, respectively; % surviving at
2 yr⫽ 100% versus 53%; 2⫽ 8.1, log rank p ⫽ 0.0044). Discussion
In this study, we present data implying an important role for p73 p53-dependent inhibition of p73 correlates
with clinical drug resistance function in determining cellular sensitivity to chemotherapeutic agents. Several lines of in vitro experimental evidence from In this work, we have identified specific p53 mutants that inhibit
p73-dependent apoptosis. We show that this activity is substan- our studies support the hypothesis that p73 status influences responsiveness to such drugs. Firstly, we demonstrate induction tially enhanced when the mutants occur in the 72R form and
we demonstrate partial reversal of drug resistance by inhibition of p73 in response to anticancer agents in squamous carcinoma cell lines from several tissues. Although p73 was initially re-of p53 expression. To assess the clinical effect re-of these mutants,
we analyzed treatment outcomes in the patients in our series ported not to be upregulated by DNA-damaging treatment (Kaghad et al., 1997), later work has demonstrated p73 induction of HNSCC whose cancers contained these mutants.
Twenty-five cases contained p53 mutations (72R or 72P) by cisplatin and doxorubicin (Agami et al., 1999; Gong et al., 1999; Yuan et al., 1999; Costanzo et al., 2002). We now extend that efficiently inhibited p73 (Table 3), and there were 15 cases
with mutations that did not. Of the 25 patients, 11 (44%) these studies by showing p73 induction by a variety of cancer chemotherapeutic agents that act through distinct mechanisms. achieved CR. Of the 15 cases, 12 (80%) achieved CR (p ⫽
0.06). There was significantly longer PFS for the 15 patients Upregulation was accompanied by increased expression of AIP1 in each of the cell lines examined. As such, our results with non p73-inactivating p53 mutations compared to the 25
patients (6/15 progressed or dead versus 19/25 progressed or suggest that the model of p73 action derived from studies of doxorubicin (Costanzo et al., 2002) may also be applicable to dead, median PFS⫽ 31.3 months (95% CI 17.3-not reached)
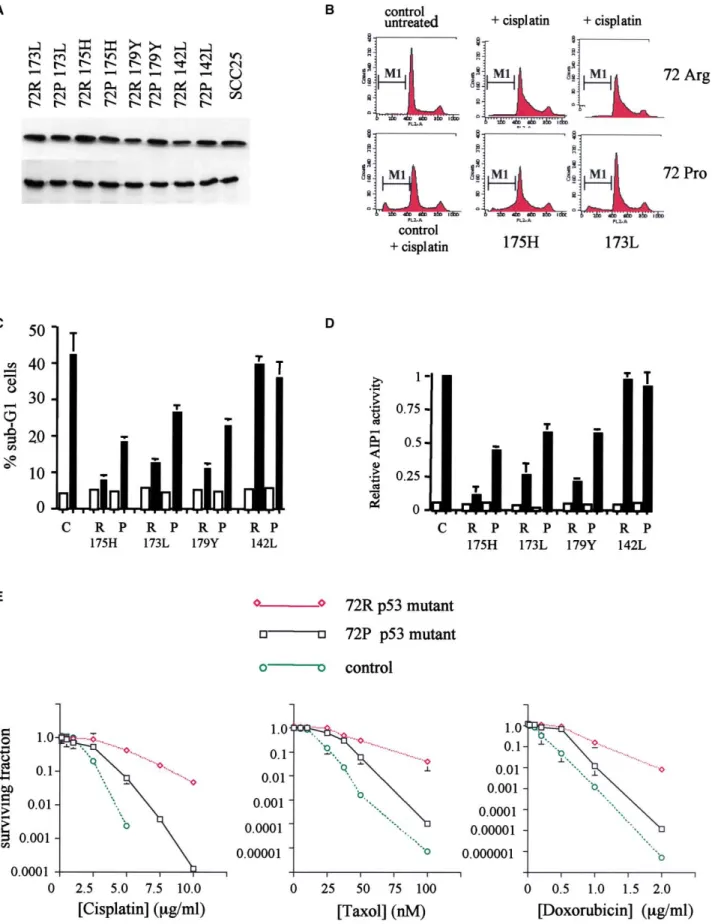
Figure 4. Polymorphism in p53 modulates sensitivity to anticancer drugs
A: Equal steady-state levels of mutant p53 proteins are expressed in the cell lines analyzed for apoptosis sensitivity. Saos-2 cells were engineered to stably
express the indicated p53 mutants in either the arginine (72R) or proline (72P) polymorphic variant. Cell lysates were prepared from exponentially growing Saos-2 cells and subjected to Western blotting with antibody DO-1 (p53) and PC-10 (PCNA) to verify equal protein loading in each lane. SCC25 is a human
other anticancer agents. Furthermore, the diversity of the anti- of p53 mutants able to inhibit p73 confers resistance to apopto-sis and cytotoxicity induced by chemotherapeutic drugs. The cancer drugs that cause p73 induction and AIP1 upregulation
supports the hypothesis that p73 may be an important cellular close correlation between inhibition of p73 and increased drug resistance supports such an association. Consistent with these mediator of the cytotoxicity of multiple anticancer agents. Our
data are complementary to those reported by Irwin and cowork- observations, downregulation of mutant p53 using siRNA in-creased the sensitivity of multiple cancer cell lines to drug-ers who also show induction of p73 by various anticancer agents
(Irwin et al., 2003 [this issue of Cancer Cell]). induced apoptosis. These results suggest a model in which expression of mutant p53 alters cellular sensitivity to anticancer Secondly, we show that abrogation of p73 function by
ex-pression of dominant-negative inhibitors reduces apoptosis and drugs by inhibition of p73. Because we had also observed that this inhibition is affected by the polymorphism at codon 72 cytotoxicity produced by the same range of anticancer drugs.
Previous work has shown that dominant-negative inhibition by of p53, this raised the possibility that the in vivo efficacy of chemotherapy is influenced by the polymorphism. The effect of p73⌬2 or p73⌬N abrogates cytotoxicity of cisplatin (Fillippovich
et al., 2001; Zaika et al., 2002). Dominant-negative inhibitors p53 status on response and survival in head and neck cancer has been investigated previously. In one such study, mutations such as p73⌬2 and p73DD may also inhibit the function of the
p73 paralog p63 (Irwin et al., 2000). The TA form of p63 can in p53 were associated with loco-regional failure, but not overall survival following radiotherapy (Koch et al., 1996). In other stud-activate apoptosis in response to DNA damage, whereas the
N-terminally truncated⌬N forms lack this activity. Western blot- ies, overall survival following radiotherapy was significantly worse in cases with p53 mutations (Gallo et al., 1999; Alsner ting and RT-PCR revealed that expression of p63 was almost
exclusively of the⌬N form in the cell lines used in our studies et al., 2001). Mutation in p53 is also associated with lower response rates to chemotherapy in head and neck cancer (Ca-(data not shown), consistent with the hypothesis that the effect
of dominant-negative inhibition is mediated through p73. This belguenne et al., 2000; Fouret et al., 2002). However, no study has examined the influence of mutation and polymorphism in is also supported by studies using siRNA against p73 reported
in the accompanying paper (Irwin et al., 2003). p53 on outcome. Furthermore, few studies have sought to corre-late outcome with the properties of the p53 mutants, although p73 expression is deregulated via E2F1 by expression of
oncogenes (Irwin et al., 2000; Stiewe and Putzer, 2000; Brooks specific mutations may be associated with shorter survival in oral cancer (Yamazaki et al., 2003). In the present work, we et al., 2002; Zaika et al., 2001). As a result, full-length p73 is
overexpressed in some cancers relative to normal tissue (Zaika present evidence that clinical response to combined modality chemo- radiotherapy in advanced head and neck cancer is et al., 1999; Cai et al., 2000; Brooks et al., 2002) and we now
show by immunocytochemistry that p73 is overexpressed in influenced both by the properties of the p53 mutants and the allelic variant at codon 72. Specifically, we have observed that advanced HNSCC. Taken together with these studies, our
re-sults and those of Irwin and coworkers suggest that the relatively p53 mutants associated with less favorable response to chemo-radiotherapy are those which most efficiently inactivate p73 greater steady-state levels of full-length p73, and/or its
en-hanced inducibility, in neoplastic versus normal tissue may con- in vitro. Consistent with in vitro studies of the effect of the polymorphism on inhibition of p73, response was less favorable tribute to the oncotoxic selectivity of DNA-damaging agents.
Previous work has shown that expression of specific p53 when the mutant occurred in the 72R rather than 72P form. Further, we present evidence that p53 mutation and polymor-mutants can inhibit apoptosis induced by some anticancer
agents (Li et al., 1998; Blandino et al., 1999). Furthermore, inhibi- phism may also influence both progression-free and overall survival. Verification of our results will require study of larger tion of p73 by p53 mutants has been demonstrated by several
investigators (Di Como et al., 1999; Marin et al., 2000; Strano numbers of patients and of other tumor types. Despite these caveats, our results suggest that the ability of p53 mutants to et al., 2000; Gaiddon et al., 2001). Because our data implied
an important role for p73 in mediating drug cytotoxicity, we abrogate p73 function may be important in vivo as well as in vitro and support the assertion that future studies of the effect wished to explore the possibility that these phenomena might
be mechanistically linked. We show that expression of a subset p53 on outcome in oncology will need to incorporate analysis
tongue squamous carcinoma cell line and is included to show that levels of p53 protein in the Saos-2 cells are comparable to endogenous mutant p53 in head and neck cancer cell lines.
B: Inhibition of cisplatin-induced toxicity in cells stably expressing 72R and 72P variants of p53 mutants 173L and 175H. Exponentially growing cells were
treated with cisplatin (10g/ml) for 2 hr and then grown in drug-free medium for a further 24 hr after which apoptosis was determined by flow cytometry. The figure shows representative FACS profiles, and the sub-G1 cells are designated as M1.
C: Increased cellular resistance to anticancer agents by mutant p53 correlates with inhibition of p73. The data shown are mean % sub-G1 cells (⫾ 1 SD)
in the indicated cell lines following exposure for 2 hr to cisplatin (10g/ml). The data are from three experiments. Similar results were obtained from other independent clones.
D: Abrogation of drug-induced apoptosis is associated with inhibition of p73-dependent activation of AIP1. Saos-2 cell lines expressing the indicated p53
mutants were transfected with AIP1 luciferase and pSV2-gal. Eighteen hours later, the cells were treated with cisplatin (10 g/ml). Luciferase activity was determined after 12 hr. Data shown are mean luciferase activity, corrected for-galactosidase, from three experiments. Equivalent results were obtained from at least two independent clones expressing each mutant.
E: Polymorphism in p53 modulates the cytotoxicity of anticancer drugs which act through p73. Saos-2 cell lines stably expressing p53 mutants were treated
with varying concentrations of the indicated drugs for 2 hr, then grown in drug-free medium until visible colonies appeared. Data shown are means⫾ 1 SD of at least three independent experiments. Symbols are as follows: open circles⫽ vector only cells; open square ⫽ 72P form of the mutant; open diamonds⫽ 72R form of the mutant. In the left-hand figure, the mutant ⫽ 175H; In the middle figure, the mutant ⫽ 173L; In the right-hand figure, the mutant⫽ 179Y.
Figure 5. Inhibition of mutant p53 expression sensitizes cells to anticancer agents
A: Dose-response of reduction in p53 expression with increasing p53 siRNA. Saos-2 cells expressing 72R 173L p53 were treated with the indicated concentrations
(nM) of p53 siRNA. p53 expression was determined by Western blotting after 48 hr of treatment.
B: 72R and 72P p53 mutant expression is specifically downregulated by siRNA treatment. Saos-2 cells were treated with 100 nM siRNA and analyzed by
Western blotting with antibody DO-1 48 hr later. To confirm equal loading, the blots were also probed with antibody to the control protein PCNA as shown. Lanes 1–3: Saos-2 expressing 72P 173L p53, lanes 4–6: Saos-2 cells expressing 72R 173L p53. Lanes 1 and 4: untreated (no si RNA); Lanes 2 and 5: 30M siRNA; Lanes 3 and 6: 100M siRNA.
C: Inhibition of endogenous mutant p53 expression by siRNA. HN5 cells were treated with 100 nM p53 siRNA (⫹) or PGL3 siRNA (⫺). Forty-eight hours later, cells were either untreated (—) or exposed to doxorubicin (D; 1g/ml), taxol (T; 500 ng/ml), or cisplatin (C; 10 g/ml). After 24 hr, cell lysates were prepared and analyzed for p53 and PCNA by Western blotting. p53 levels are unaffected by cytotoxic drugs but downregulated by p53 siRNA.
D: p53 siRNA inhibits endogenous complex formation between mutant p53 and p73. Hacat cells were treated with 100 nM p53 siRNA (⫹) or PGL3 siRNA (⫺). Forty-eight hours later, cells were either untreated (—) or exposed to doxorubicin (D; 1 g/ml), taxol (T; 500 ng/ml), cisplatin (C; 10 g/ml), or etoposide (E; 10M). After 24 hr, cell lysates were prepared and p53-p73 complexes analyzed as described in Experimental Procedures. Immunoprecipitation was performed with ER-15 and blotting with DO-1. Following treatment with p53 siRNA (designated as⫹), there is a marked reduction in p53 complexed with p73 compared to cells pretreated with PGL3 siRNA.
colonies were ring cloned and expression of transfected sequences con-of the polymorphism (Soussi and Be´roud, 2001). Additional
firmed by Western blotting and/or RT-PCR. prognostic data may be afforded by analysis of p73 expression.
The results of initial immunocytochemical studies that we
pres-Drug treatment
ent suggest that p73 expression, when taken together with p53 Cells were exposed to anticancer drugs at concentrations determined in mutation status, may have predictive value in terms of response colony-forming assays to be cytotoxic. For analysis of p73 induction, the following concentrations were used: etoposide 10M; cisplatin 1 g/ml and but not survival. However, the steady-state expression of p73
10g/ml; taxol 500 ng/ml; doxorubicin 1 g/ml. revealed by immunocytochemistry may not be representative
of levels induced in tumors by chemotherapy. Moreover, p73
Immunoblotting
is expressed in multiple splice variants at both C and N termini,
Cells were harvested in lysis buffer (50 mM Tris, 250 mM NaCl, 0.1% Nonidet further complicating interpretation of immunocytochemical NP-40, 5 mM EDTA, 50 mM NaF, 1 mM PMSF with protease inhibitor cocktail analysis. Nevertheless, additional studies of the prognostic util- (Roche)). Antibodies were as follows: p73: ER-15 (Neomarkers) affinity puri-fied, 1:100; p53: DO-1 ascites, 1:1000; PCNA: PC-10 ascites, 1:1000). All ity of p73 expression are clearly warranted.
lanes contained equal amounts of protein as determined by the Bradford It should be noted from our data that mutants such as 142L,
method. Association between p53 mutants and p73 was analyzed by immu-152L, 158G, and 161V lacking detectable ability to abrogate
noblotting essentially as described by Marin et al. (2000). Briefly, lysates p73 function also appear to be preferentially selected in the R were prepared from subconfluent 3 cm dishes of cells in RIPA buffer and allele. As such, the greater effect of 72R p53 mutants on p73 divided into equal portions. Lysates were precleared with protein G sepha-is unlikely to be the only mechansepha-ism underlying both the bias rose then subjected to immunoprecipitation with ER-15 (p73), DO-1 (p53), or Pab419 (control antibody). Immunoprecipitated proteins were resolved for selection of 72R mutants in neoplastic development and
on 10% polyacrylamide gels and immunoblotted with either DO-1, ER-15, also the less favorable outcome in cancers with mutations in
or Pab419. Proteins were detected using a secondary anti-mouse light chain the 72R allele. This implies either that 72R mutants possess
antibody (HRP-conjugated rat anti-mouse light chain, Pharmingen No: other enhanced functions relative to the 72P allele or that selec- 559751) and visualized with the enhanced chemiluminescent system from tion during tumorigenesis favors clones in which the wild-type Amersham. To compare complex formation with p73 between the two poly-morphic variants of p53, Saos-2 cells were transfected with 15g pcDNA3 activity of the 72R protein has been inactivated. The latter
hy-p73␣ and 15 g pCB6⫹p53 (in either 72R or 72P forms). Twenty-four hours pothesis would require that the 72R wild-type protein possesses
later, lysates were prepared and processed for immunoblotting exactly as functions which more efficiently mediate tumor suppression and
described above. which are selected against in tumorigenesis. Additional studies
are required to address these possibilities, but the frequent Plasmids
preferential retention of 72R mutants clearly implicates gain of pCB6⫹72R wt p53 and pCB6⫹72P wt p53 (Crook et al., 1994) were the plasmids for p53 expression and for in vitro mutagenesis using the Stra-function for a subset of mutants specifically selected for in
tagene Quikchange system. pcDNA3 HAp73␣ and pcDNA3 HAp73 (De cancers. This in turn correlates with less favorable response to
Laurenzi et al., 1998) were generous gifts of Dr. Gerry Melino and were used treatment as evidenced by the particularly poor outcome of the
for expression of p73. pcDNA3 p73⌬2 was generously given to us by Dr. patients in our series where cancers contained 72R mutants K.K. Khana. pcDNA3 p73DD and p73DD (L371P) were kindly provided by that efficiently abrogate p73. Drs. Meredith Irwin and William Kaelin. pcDNA3 p73DD encodes a dominant-Combined modality treatments for advanced head and neck negative form of p73 that binds to full-length p73 and abrogates activation of p73-inducible promoters (Irwin et al., 2000). The point mutant p73DD cancer are associated with significant toxicity. It is, therefore,
(L371P) does not bind to full-length p73 and lacks transdominant inhibitory crucial to make rational treatment decisions based on distinctive
activity (Irwin et al., 2000). p53AIP1 luciferase was generously provided by features of each cancer and to spare unnecessary toxicity to
Dr Silvia Soddu. patients with a low probability of response. Although resistance
to cancer chemotherapy is likely to be regulated by multiple Analysis of apoptosis and cytotoxicity
factors, the data we present herein suggest that the p53-p73 p73-induced apoptosis was assessed in Saos-2 cells by transient transfection and flow cytometry. Exponentially growing cells received 10g of p73 expres-interaction and its regulation by p53 polymorphism is an
impor-sion plasmid and 3g of pcDNA3 CD20, together where appropriate with p53 tant determinant of response and survival in head and neck
mutants or dominant-negative inhibitors at a ratio of 1:1 (10g: 10 g) and cancer. Our results suggest that patients with specific p53
muta-1:2 (10g: 20 g). Twenty-four hours after transfection, cells were harvested, tions in the 72R form are those least likely to gain complete stained with propidium iodide, and apoptosis was determined as the % of response to chemotherapy. sub-G1 cells. Drug-induced apoptosis was determined 24 hr after treatment with chemotherapeutic drugs by flow cytometry. p53-dependent apoptosis
Experimental procedures was assessed using essentially similar experiments. Briefly, cells received 10g of either pCB6⫹72R wt p53 or pCB6⫹72P wt p53 together with 72R
Cell lines or 72P p53 mutants at a ratio of 1:1 and 1:2. Apoptotic cells were quantified Squamous carcinoma cell lines and Saos-2 p53⫺/⫺cells were maintained in by flow cytometry as described above.
DMEM with 10% fetal bovine serum. To generate cell lines stably expressing Cytotoxicity was determined in standard colony-forming assays. Briefly, dominant-negative inhibitors, Saos-2 cell lines were transfected with expres- 102–106cells were seeded in quadruplicate onto 9 cm tissue culture dishes.
24 hr later, they were treated for 2 hr with cytotoxic drugs at a range of sion plasmids, then grown in the presence of 400 g/ml G418. Isolated
E: Downregulation of mutant p53 results in increased drug-induced apoptosis. Hacat cells were pretreated with either p53 siRNA or PGL3 siRNA as indicated,
then exposed to doxorubicin (1g/ml). Twenty-four hours later, cells were analyzed by flow cytometry. Sub-G1 cells are designated M1.
F: Increased apoptosis in squamous carcinoma cell lines following p53 siRNA treatment. SCC25 and Hacat cells were pretreated with p53 siRNA (black
panels) or mock pretreated (open panels). Forty-eight hours later, cells were exposed to doxorubicin (D) or cisplatin (C). After 24 hr, apoptosis was determined by flow cytometry. Data shown are means,⫾ 1SD, of two experiments.
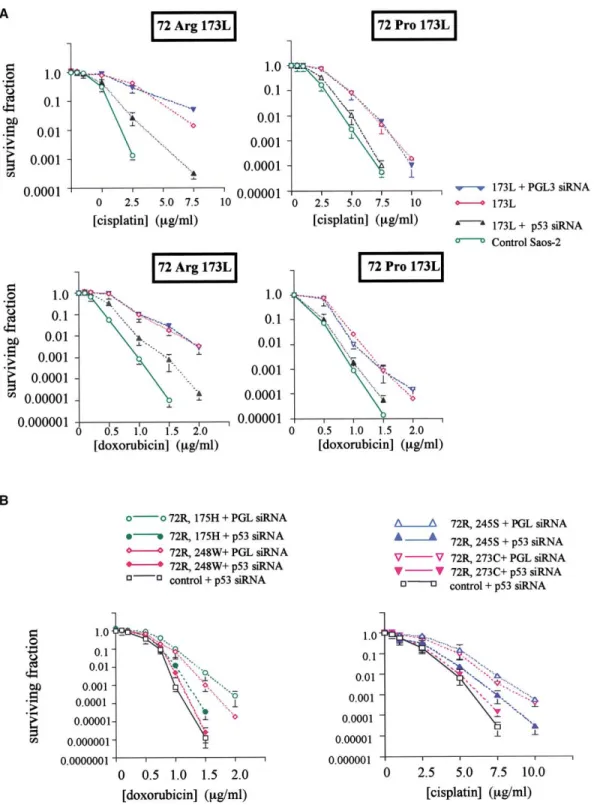
Figure 6. siRNA modulates chemosensitivity in cells engineered to express 72R and 72P variants of hot spot p53 mutants
A: Saos-2 cells expressing 72R 173L p53 were treated with siRNA (100 nM) to p53 or with PGL siRNA as indicated. Forty-eight hours later, cells were exposed
to various concentrations of cisplatin or doxorubicin. Survival was determined by colony-forming ability. Data are mean surviving fraction (⫾ 1SD) of three experiments. Control Saos-2 cells do not express p53.
B: Inhibition of expression of hot spot p53 mutants increases sensitivity to doxorubicin and cisplatin. Saos-2 cell lines engineered to express the indicated
hot spot p53 mutants were treated with 100 nM siRNA as shown. Forty-eight hours later, they were exposed to varying concentrations of doxorubicin or cisplatin and colony survival was determined as described in Experimental Procedures. Data shown are mean surviving fraction (⫾ 1SD) of two independent experiments.
Sex Age Primary site Subsite T N M Stage 72 Germline p53 gene Mt allele Resp. PFS OS A/D
M 37 Rhinopharynx — 4 2c IV Arg/Arg 173 Val⬎Leu Arg CR 23.3 32.0 D
M 55 Hypopharynx Pyriform sinus 2 3 IV Pro/Pro 220 Tyr⬎Cys Pro CR 41.4 41.4 A
M 40 Hypopharynx Pyriform sinus 4 0 3 IV Arg/Arg 220 Tyr⬎Cys Arg PR 4.7 7.3 D
M 49 Hypopharynx — 4 2c IV Arg/Arg Wild-type None CR 43.3 43.3 A
M 67 Hypopharynx — 3 0 III Arg/Pro Wild-type None CR 36.7 36.7 A
M 50 Hypopharynx — 4 3 IV Arg/Pro Wild-type None CR 49.9 49.9 A
M 58 Hypopharynx — 4 0 IV Arg/Arg 175 Arg⬎His Arg PR 12.7 29.3 D
⌬ 11bp exon4 Arg
M 66 Larynx — 3 2b 2 IV Arg/Pro 172 Val⬎Ala Arg CR 31.2 44.9 D
M 41 Hypopharynx Pyriform sinus 2 2c IV Pro/Pro 175 Arg⬎His Pro PR 23.2 23.2 A
M 59 Oropharynx — 4 0 IV Arg/Pro 248 Arg⬎Gln Pro CR 18.5 58.7 A
M 65 Oral cavity Oral floor 4 0 2 IV Arg/Arg Wild-type None CR 20.3 20.3 A
M 45 Oropharynx Soft-palate 1 2b 3 IV Arg/Pro Wild-type None TD 1.5 1.5 D
M 59 Larynx Vocal cord 4 0 IV Arg/Arg 175 Arg⬎His Arg PR 13.5 13.9 D
M 65 Larynx Vocal cord 3 1 2 III Arg/Pro 176 Cys⬎Tyr Arg CR 15.1 17.6 D
M 49 Hypopharynx 1 3 IV Arg/Arg Wild-type None CR 42.8 42.8 A
M 65 Cervical esophagus 3 2c IV Arg/Pro 179 His⬎Arg Arg PR 12.0 19.4 D
F 62 Rhinopharynx 4 2a IV Arg/Arg Wild-type None CR 52.7 52.7 A
M 58 Hypopharynx Pyriform sinus 4 2c IV Arg/Pro 276 Ala⬎Thr Arg CR 16.7 16.7 A
M 76 Hypopharynx Pyriform sinus 2 2c 3 IV Arg/Arg Wild-type None CR 22.4 22.4 A
M 56 Hypopharynx 2 3 IV Arg/Arg 245 Gly⬎Ser Arg PR 16.4 26.9 D
M 68 Oropharynx 2 2c IV Arg/Arg 161 Ala⬎Val Arg CR 44.7 44.7 A
M 59 Larynx 2 2c IV Arg/Arg Wild-type None CR 26.8 26.8 A
M 54 Oropharynx 4 0 IV Arg/Arg Wild-type None CR 49.0 49.0 A
M 75 Larynx Epiglottis 2 3 3 IV Arg/Arg 175 Arg⬎His Arg PD 1.4 1.4 D
249 Arg⬎Ser, 250 Arg
M 41 Hypopharynx Pyriform sinus 3 2b 3 IV Arg/Arg Wild-type None CR 43.5 43.5 A
M 36 Oropharynx Soft-palate 3 2c 1 IV Arg/Arg 133 Met⬎Leu Arg CR 45.8 45.8 A
M 67 Hypopharynx Pyriform sinus 3 2b IV Arg/Arg Wild-type None CR 29.0 29.0 A
F 76 Oropharynx Tonsil 4 2c 2 IV Arg/Pro Wild-type None CR 44.6 44.6 A
M 53 Larynx 4 2 2 IV Arg/Arg Wild-type None CR 15.4 15.4 A
M 62 Oropharynx Base of tongue 3 2c 2 IV Arg/Pro 248 Arg⬎Trp Arg CR 12.5 12.5 D
M 54 Larynx 0 3 3 IV Arg/Pro 173 Val⬎Leu Pro CR 14.3 14.3 A
M 57 Hypopharynx Pyriform sinus 4 2a IV Arg/Pro 280 Arg⬎Lys Arg PR 10.8 14.5 D
M 47 Hypopharynx Pyriform sinus 3 1 2 III Arg/Pro Wild-type None PR 20.6 20.6 A
M 66 Oral cavity Soft-palate 3 2c IV Arg/Pro 242 Cys⬎Tyr Arg CR 16.1 21.1 A
M 59 Oropharynx Tonsil 4 2b 3 IV Arg/Pro 206 Leu⬎Tyr Arg CR 17.0 17.0 A
M 67 Larynx 4 0 3 IV Arg/Arg Wild-type None TD 1.5 1.5 D
M 54 Oropharynx Tonsil 4 1 3 IV Arg/Pro 245 Gly⬎Ser Arg PR 10.0 13.8 D
M 47 Oral cavity Oral floor 4 2b IV Arg/Pro 241 Ser⬎Phe Pro CR 42.4 42.4 A
M 68 Larynx Glottis 3 1 2 III Arg/Arg 152 Pro⬎Leu Arg CR 27.9 27.9 D
M 56 Oropharynx Tonsil 4 1 2 IV Arg/Arg Wild-type None CR 18.1 18.1 A
M 70 Oropharynx Tonsil 4 2b 1 IV Arg/Arg Wild-type None CR 53.4 53.4 A
F 55 Oral cavity Tongue 4 0 IV Arg/Pro 175 Arg⬎His Arg PR 4.4 7.7 D
M 40 Rhinopharynx 2 3 IV Arg/Arg 273 Arg⬎Cys Arg CR 24.5 36.5 D
M 51 Rhinopharynx 2 2b IV Pro/Pro Wild-type None CR 59.8 59.8 A
F 68 Oropharynx Tonsil 4 0 IV Arg/Pro 179 His⬎Tyr Pro CR 36.5 36.5 A
M 45 Oropharynx Soft-palate 1 2b 3 IV Arg/Arg Wild-type None TD 1.5 1.5 D
M 66 Oropharynx Base of tongue 2 2c IV Arg/Arg Wild-type None CR 20.4 20.4 D
F 30 Rhinopharynx 4 0 3 IV Arg/Arg 273 Arg⬎His Arg PR 39.0 39.0 A
M 55 Oropharynx Base of tongue 4 2c IV Arg/Arg 245 Gly⬎Asp Arg PR 30.9 31.9 A
M 67 Oropharynx Base of tongue 4 2b 3 IV Arg/Pro Wild-type None CR 15.2 15.2 A
F 72 Hypopharynx Pyriform sinus 4 0 IV Arg/Pro Wild-type None PR 15.4 15.4 A
M 70 Oral cavity Tongue 2 2c 3 IV Arg/Pro Wild-type None TD 1.9 1.9 D
F 59 Larynx Vocal cord 4 0 IV Arg/Arg 142 Pro⬎Leu Arg CR 18.2 18.2 A
M 57 Hypopharynx 4 3 IV Arg/Arg 179 His⬎Tyr Arg PR 9.8 16.8 D
M 50 Hypopharynx Pyriform sinus 4 2b IV Arg/Pro 181 Arg⬎His Arg CR 31.3 31.3 A
M 46 Larynx Glottis 4 2c IV Arg/Pro 245 Gly⬎Asp Pro CR 37.4 37.4 A
M 59 Hypopharynx Pyriform sinus 3 1 2 III Arg/Pro 158 Arg⬎Gly Arg CR 15.3 15.3 D
M 54 Larynx Vocal cord 3 0 2 III Arg/Arg 176 Cys⬎Phe Arg PR 15.0 17.3 A
F 61 Larynx Epiglottis 3 0 2 III Arg/Pro 266 Gly⬎Val Arg NE 9.9 9.9 D
M 60 Oral cavity Oral floor 4 2a IV Arg/Pro 273 Arg⬎Cys Arg CR 25.1 35.6 D
M 60 Hypopharynx Pyriform sinus 4 2b IV Arg/Arg Wild-type None CR 45.9 45.9 A
M 59 Hypopharynx Pyriform sinus 4 2b 2 IV Arg/Arg F’shift; ter cod 169 Arg PR 13.2 13.2 A
M 57 Oropharynx Tonsil 4 2b 2 IV Arg/Pro 163 Tyr⬎His Pro CR 5.1 5.1 A
M 44 Oropharynx Base of tongue 4 2a 2 IV Arg/Arg Wild-type None CR 6.2 6.2 A
M 62 Hypopharynx Pyriform sinus 4 2b 3 IV Arg/Arg 175 Arg⬎His Arg PR 7.7 7.7 D
M 56 Oropharynx Base of tongue 4 3 2 IV Pro/Pro Wild-type None CR 7.2 7.2 D
M 55 Hypopharynx Pyriform sinus 3 0 1 III Arg/Arg Wild-type None CR 51.3 51.3 A
M 54 Rhinopharynx 4 3 3 IV Arg/Arg 175 Arg⬎His Arg CR 17.3 21.0 D
M 74 Hypopharynx Pyriform sinus 3 0 2 III Arg/Pro Wild-type None CR 45.6 45.6 A
F 66 Trachea 4 1 IV Arg/Pro Wild-type None CR 8.5 8.5 A
Qiagen Rneasy miniprep kit according to the manufacturer’s instructions. Table 3. Clinical outcome of patients expressing p53 mutations which
Activity of the p53AIP1 promoter was determined in transient assays by
efficiently inhibit p73 function
transfection of p53AIP1 luciferase. Cells were transfected with 1g of AIP1
Mutation Mutant allele Responsea PFS2 OSb Alive/dead
luciferase and 2g of pSV2 -galactosidase using lipofectamine (Qiagen). Twenty-four hours later, cells were exposed to cytotoxic drugs for 2 hr as
173L Arg CR 23.3 32.0 Dead
described above, then grown in drug-free medium for a further 24 hr at
173L Pro CR 14.3 14.3 Alive
which time luciferase and-galactosidase activity was determined using
175H Arg PR 13.5 13.9 Dead
175H Arg PR 4.4 7.7 Dead the Promega system.
175H Pro PR 23.2 23.2 Alive
175H Arg PD 1.4 1.4 Dead siRNA studies
175H Arg PR 7.7 7.7 Dead Sequences of oligonucleotides for inhibition of p53 and the PGL3 control
175H Arg PR 12.7 29.3 Dead siRNA (Elbashir et al., 2001) were kindly provided by Dr. M. Irwin and
Profes-176Y Arg CR 15.1 17.6 Dead sor W. Kaelin. The sequence of the p53 oligonucleotide is: 5⬘ r(CUACUUC
176F Arg PR 15.0 17.3 Alive CUGAAAACAACG)d(TT) 3⬘ 5⬘ r(CGUUGUUUUCAGGAAGUAG)d(TT)3⬘.
179R Arg PR 12.0 19.4 Dead siRNA oligos were obtained from Xeragon and transfected using the
179Y Pro CR 36.5 36.5 Alive Transmessenger transfection reagent (Qiagen). In preliminary studies, cells
179Y Arg PR 9.8 16.8 Dead
were treated with 10–100M siRNA according to the manufacturer’s
instruc-220C Arg PR 4.7 7.3 Dead
tions in order to determine the optimum concentration to downregulate the
220C Pro CR 41.4 41.4 Alive
target genes. In later studies, cells were transfected with 100M oligos for
242Y Arg CR 16.1 21.1 Alive
3 hr, after which the cells were grown for a further 48 hr in normal medium,
245D Pro CR 37.4 37.4 Alive
then treated with anticancer drugs for 2 hr. The medium was replaced with
245D Arg PR 30.9 31.9 Alive
drug-free medium and the cells grown until visible colonies appeared. The
245S Arg PR 16.4 26.9 Dead
effect of siRNA treatment on sensitivity to apoptosis was assessed by flow
245S Arg PR 10.0 13.8 Dead
cytometry 48 hr after drug treatment.
248W Arg CR 12.5 12.5 Dead
248Q Pro CR 18.5 58.7 Alive
273C Arg SD 39.0 39.0 Alive Patients and tumors
273C Arg CR 25.1 35.6 Dead The patient population comprised all cases of locally advanced, inoperable
273C Arg CR 24.5 36.5 Dead TNM stage III/IV HNSCC presenting to the Medical Oncology Department of Cuneo General Hospital. Tissue was obtained as paraffin sections at the
aCR: complete response; PR: partial response; PD: progressive disease; SD:
time of diagnosis or fresh-frozen tissue from patients with locally advanced,
stable disease.
unresectable TNM stage III/IV head and neck cancers at the time of
diagno-bPFS: progression-free survival in months; OS: overall survival in months.
sis. In each case, the diagnosis and presence of an adequate proportion of tumor tissue was confirmed by histopathological review. Patients underwent combined treatment consisting of radiotherapy and one of the following cisplatin-based chemotherapy regimens: (1) cisplatin/5-fluorouracil; (2) cis-concentrations. After drug exposure, cells were grown until visible colonies
platin/5-fluorouracil/paclitaxel; (3) cisplatin/gemcitabine. For some patients, appeared at which point they were fixed in methanol and stained with
normal tissue was obtained from blood or uninvolved tissue (confirmed by Giemsa. Survival was calculated relative to cells receiving drug vehicle alone.
histopathological analysis). Genomic DNA was isolated from blood using Each such assay was repeated a minimum of three times.
the Qiagen kit and from frozen normal tissue with proteinase K digestion. In cases where blood or uninvolved tissue was not available, normal tissue
Analysis of AIP1 activation
was obtained by microdissection using sections stained with haematoxylin Expression of AIP1 mRNA was analyzed using TaqMan quantitative PCR
as described (Kaeser and Iggo, 2002). Total RNA was prepared using the and eosin to identify areas of normal tissue.
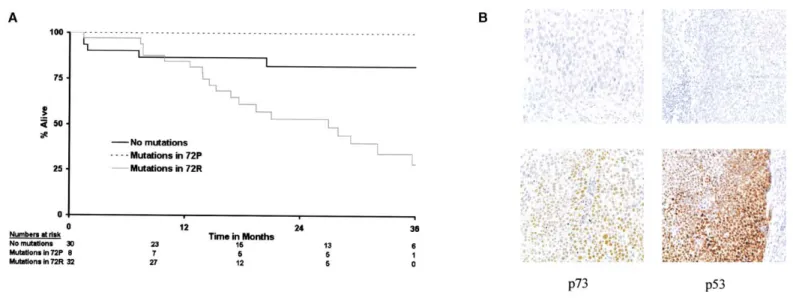
Figure 7. Clinical outcome in head and neck cancer is influenced by p53 polymorphism
A: p53 mutations predict worse survival. If mutations exist, those occurring in the 72R form predict worse survival. Survival curves for all 70 patients, split by
presence or absence of mutations (log rank p⫽ 0.0058), and whether the mutation occurred in the 72R or 72P form (log rank p ⫽ 0.0044).
B: Immunocytochemical analysis of p53 and p73 expression in head and neck cancers The figure shows examples of positive (lower panels) and negative
Blandino, G., Levine, A.J., and Oren, M. (1999). Mutant p53 gain of function:
Analysis of p53
differential effects of different p53 mutants on resistance of cultured cells Germline codon 72 genotypes were determined using genomic DNA isolated
to chemotherapy. Oncogene 18, 477–485. from patient-matched normal tissue. Amplification was performed with the
following primers: Forward primer: 5⬘CAATGGTTCACTGAAGACC 3⬘;
Re-Brooks, L.A., Tidy, J.A., Gusterson, B., Hiller, L., O’Nions, J., Gasco, M., verse primer: 5⬘ CTGTCCCAGAATGCAAGA 3⬘. Following PCR, amplified
Marin, M.C., Farrell, P.J., Kaelin, W.G., Jr., and Crook, T. (2000). Preferential products were extracted using the Qiagen QIAquick PCR purification kit retention of codon 72 arginine p53 in squamous cell carcinomas of the vulva and then bidirectionally sequenced using the ABI PRISM Big Dye Cycle occurs in cancers positive and negative for human papillomavirus. Cancer Sequencing Kit and appropriate primers. To identify p53 mutations, each Res. 60, 6875–6877.
coding exon of the gene was amplified using exon-specific primers and
Brooks, L.A., Sullivan, A., O’Nions, J., Bell, A., Dunne, B., Tidy, J.A., Evans, high-fidelity Pfx polymerase (Gibco, BRL). Amplification products were
gel-D.J., Osin, P., Vousden, K.H., Gusterson, B., et al. (2002). E7 proteins from purified and ligated into pCRblunt (Invitrogen). Individual plasmid clones of
oncogenic human papillomavirus types transactivate p73: role in cervical each exon were then sequenced. A minimum of 12 clones for each exon were
intraepithelial neoplasia. Br. J. Cancer 86, 263–268. sequenced. When mutations occurred in 72 R/P germline heterozygotes, we
further identified the polymorphic allele in which the mutation occurred. Cabelguenne, A., Blons, H., de Waziers, I., Carnot, F., Houllier, A.M., Soussi, Tumor tissue was isolated by microdissection as described above and the T., Brasnu, D., Laccourreye, O., and Laurent-Puig, P. (2000). p53 alterations presence of the mutation confirmed by sequencing. A fragment containing predict tumor response to neoadjuvant chemotherapy in head and neck codon 72 was then amplified and sequenced using the primers and condi- squamous cell carcinoma: a prospective series. J. Clin. Oncol. 18, 1465–
tions given above. 1473.
Cai, Y.C., Yang, G.Y., Nie, Y., Wang, L.D., Zhao, X., Song, Y.L., Seril, D.N.,
Immunocytochemistry
Liao, J., Xing, E.P., and Yang, C.S. (2000). Molecular alterations of p73 in Expression of p53 and p73 was analyzed by immuncytochemistry using the
human esophageal squamous cell carcinomas: loss of heterozygosity occurs following antibodies: p73: ER-15 (Neomarkers used at 1:150 dilution); p53:
frequently; loss of imprinting and elevation of p73 expression may be related DO-1 (Calbiochem used at 1:500). Sections were subject to antigen retrieval
to defective p53. Carcinogenesis 21, 683–689. prior to application of antibodies. Stained sections were scored for nuclear
Costanzo, A., Merlo, P., Pediconi, N., Fulco, M., Sartorelli, V., Cole, P.A., expression by a head and neck pathologist (BAG) who was unaware of the
Fontemaggi, G., Fanciulli, M., Schiltz, L., Blandino, G., et al. (2002). DNA clinical status of each patient.
damage-dependent acetylation of p73 dictates the selective activation of apoptotic target genes. Mol. Cell 9, 175–186.
Statistical analysis
Chi-squared tests were used to test the frequencies of the codon 72 geno- Cox, D.R. (1972). Regression models and life tables. J. R. Stat. Soc. Ser. types between cases and controls. Fisher’s exact tests were used to analyze B. 34, 187–220.
any differences in complete and partial response rates between the presence
Crook, T., Marston, N.J., Sara, E.A., and Vousden, K.H. (1994). Transcrip-or absence of mutations and mutant allele types. A test fTranscrip-or propTranscrip-ortions was
tional activation by p53 correlates with suppression of growth but not trans-used to analyze the frequency of mutations in R and P and a2test for
formation. Cell 79, 817–827. trend used to analyze the proportions of complete and partial responses
across different grouping levels of p53 and p73. Survival times were calcu- De Laurenzi, V., Costanzo, A., Barcaroli, D., Terrinoni, A., Falco, M., Annicchi-lated as the date of diagnosis to date of death, or date of censor if alive. arico-Petruzzelli, M., Levrero, M., and Melino, G. (1998). Two new p73 splice Progression-free survival times were calculated as the date of diagnosis to variants, gamma and delta, with different transcriptional activity. J. Exp. date of progression, or date of censor if not progressed. Survival curves Med. 188, 1763–1768.
were constructed using the method of Kaplan and Meier (Kaplan and Meier,
Di Como, C.J., Gaiddon, C., and Prives, C. (1999). p73 function is inhibited 1958), and the log rank test (Peto et al., 1977) was used to assess the
by tumor-derived p53 mutants in mammalian cells. Mol. Cell. Biol. 19, 1438– independent prognostic ability of both the presence of mutations and the
1449. allelic variant of mutation. Cox Proportional Hazards analysis (Cox, 1972) was
then undertaken to test the prognostic ability of the presence of mutations in Elbashir, S.M., Harborth, J., Lendeckel, W., Yalcin, A., Weber, K., and Tuschl, a multivariate setting alongside the prognostic factors of sex, age, perfor- T. (2001). Duplexes of 21-nucleotide RNAs mediate RNA intereference in mance status, stage, site of primary tumor, and nodal status. Statistical cultured mammalian cells. Nature 411, 494–498.
analysis was carried out independently using SAS statistical software (SAS
Fillippovich, I., Sorokina, N., Gatei, M., Haupt, Y., Hobson, K., Moallem, E., Institute, Cary, North Carolina).
Spring, K., Mould, M., McGuckin, M.A., Lavin, M.F., and Khanna, K.K. (2001). Transactivation-deficient p73alpha (p73Deltaexon2) inhibits apoptosis and
Acknowledgments
competes with p53. Oncogene 20, 514–522.
We thank Dr. Ken Parkinson and Dr. Ian Paterson for generously providing Fouret, P., Temam, S., Charlotte, F., and Lacau-St-Guilly, J. (2002). Tumour cell lines. Work in the laboratory of Professor Gustorson is supported by stage, node stage, p53 gene status and bcl-2 protein expression as pre-Breakthrough Breast Cancer. We thank Compagnia di San Paolo for support- dictors of tumour response to platin-fluouracil chemotherapy in patients ing parts of this work. with squamous-cell carcinoma of the head and neck. Br. J. Cancer 87,
1390–1395.
Furihata, M., Takeuchi, T., Matsumoto, M., Kurabayashi, A., Ohtsuki, Y., Terao, N., Kuwahara, M., and Shuin, T. (2002). p53 mutation arising in Arg72 Received: November 4, 2002 allele in the tumorigenesis and development of carcinoma of the urinary Revised: February 19, 2003 tract. Clin. Cancer Res. 8, 1192–1195.
Published: April 21, 2003
Gaiddon, C., Lokshin, M., Ahn, J., Zhang, T., and Prives, C.A. (2001). A subset of tumor-derived mutant forms of p53 down-regulate p63 and p73
References
through a direct interaction with the p53 core domain. Mol. Cell. Biol. 21, 1874–1887.
Agami, R., Blandino, G., Oren, M., and Shaul, Y. (1999). Interaction of c-Abl
Gallo, O., Chiarelli, I., Boddi, V., Boccioloni, C., Bruschini, L., and Porfirio, and p73alpha and their collaboration to induce apoptosis. Nature 399, 809–
B. (1999). Cumulative prognostic value of p53 mutations and bcl-2 protein 813.
expression in head-and-neck cancer treated by radiotherapy. Int. J. Cancer Alsner, J., Sorensen, S.B., and Overgaard, J. (2001). TP53 mutation is related 84, 573–579.
to poor prognosis after radiotherapy, but not surgery, in squamous cell