supporting C,7k = 1 to the node of the lower layer of
v,
k) encoding Si;*,‘ = 1.(5) The promotion of request-proportional broadcasting by assign- ing uniform CT, (1 5 i 5 2) to all the nodes of the upper layer of all sub-networks supporting that s; broadcasts
{
,”
x (R, - A,) ifRi
-Ai
2 1ui = 1 if Ri - Ai
<
1, Ri>
0 ( 3 ) ifR,
= 0where B is a positive constant and A, equals the number of sub- networks that exclusively promote broadcasting of si and have no lateral inhibition with other sub-networks.
S k 2 0 2 i=l 2 0 0 2 0 i=2
iml
2 0 i=3 asub-network(1 ,I ) sub-network(l,2) su b-network(2,Z)
b
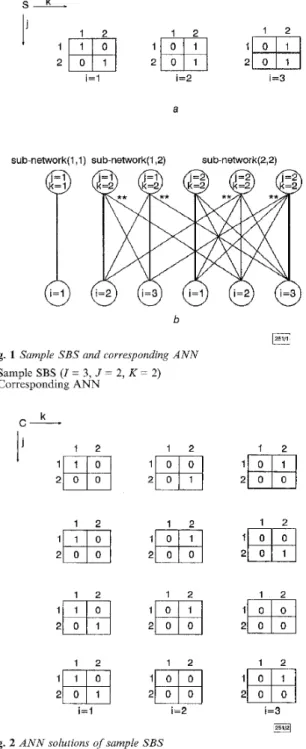
Fig. 1 Sample SBS and corresponding A N N a Sample SBS ( I = 3, J = 2, K = 2)
b Corresponding ANN
ated with I
<
15, J<
10, K<
20 and sparsity (proportion of zeros) of S not exceeding 60%.The solution is provided by the active nodes of the ANN. From (iv), at most one node of the upper and one of the lower layer can be active in each sub-network (valid and correct broadcasting). Owing to maximal constraint satisfaction, the greatest possible number of active nodes of the upper layer is produced (optimal broadcasting). if more than one optimal solution exists, each is settled on by the ANN with roughly equal probability. If the com- munication task cannot be completed (i.e. (i) cannot be fulfilled for at least one s,’), the ANN solution is still valid while maximal broadcasting is accomplished from
(ii).
The number of updates required for ANN settling is affected by the problem complexity, namely the size of the largest sub-network (z, j ) and the amount of lateral inhibition between sub-networks.Fig. 2 shows the solutions produced by the ANN for the sample SBS of Fig. 1, where B = 2 is used in eqn. 3 and eight node activa- tion updates are required for ANN settling. The first two instances of C depict the solutions for RT = [l 1 11; they constitute the two optimal solutions and each is settled upon with probability p = 0.5. The third and fourth instances of C depict the solutions for RT = [2 1 01 and RT = [2 0 11, respectively; both constitute unique optimal solutions and are invariably settled upon.
AU
instances ofC are produced for RT = [2 1 11, a communication task that can- not be completed; the greatest possible number of communication requests is fulfiied and the solutions are settled on with p = 0.43, 0.46, 0.04, 0.07, respectively; the preference for the first two solu- tions is due to the strength assignment in eqn. 3.
Conclusions: An artificial neural network employing problem decomposition and lateral inhibition has been utilised for solving the satellite broadcasting problem in parallel. The proposed solu- tions are valid (the problem constraints are satisfied), correct (the communication requests are fidfiiled) and optimal (maximal broadcasting is accomplished).
0 IEE 1998
Electronics Letters Online No: I9981054
T. Tambouratzis (Institute of Nuclear Technology - Radiation Protection, N C S R ‘Demokritos’, Aghia Paraskevi 153 10, Athens,
Greece)
6 May 1998
Fig. 2 A N N solutions of sample SBS
The ANN constructed for the sample SBS of Fig. la is illus- trated in Fig. lb. Sub-network (2, 1) is omitted as no satellite broadcasting to tz at T , exists. Positive and negative connections appear as bold and thin lines, respectively. The lateral inhibitory connections between sub-networks (1,2) and (2,2) are marked as
**.
Test results: The SBS tests performed include the problems in [l] as well as more complex problems that have been randomly gener-
An approximate solution of an NPhard graph theoretical problem, namely finding maximum clique, is presented using cellular neural networks. Like the existing energy descent optimising dynamics, the maximal cliques will be the stable states of cellular neural networks. To illustrate the performance of the method, the results wdl be compared with those of continuous Hopfield dynamics.
Introduction: Problems arising in fields as diverse as pattern recog- nition, computer vision, information processing etc. can be trans- formed into the maximum clique problem. Hence, it is of interest to develop methods to find exact and approximate solutions to the
maximum clique protdem, which has many equivalent formula- tions as an integer pro;pamming problem or a continuous noncon- vex optimisation protllem. Owing to its simple formulation, the maximum independent set problem, which is equivalent to the maximum clique problem, is mainly considered. The method pro- posed in this Letter is based on the unconstrained quadratic 0-1 programming formulation given in [l], and is a local method with good approximation.
The maximum clique problem aims to find the largest clique in an undirected graph. The graph is assumed to have no loops, not more than one edge associated to a vertex pair, and at least one edge. A clique is a set of vertices in a graph such that every pair is connected by an edge. In a more formal way, this can be stated as follows: if G = (V, E ) s an undirected graph, where Vis the set of vertices and E is the set of edges, a subset S of vertices is called a clique if the subgraph introduced by S is complete. A maximum clique of G is a clique of maximum cardinality. The solutions of the 0-1 optimisation problem defmed with cost function min(xTAx - eTx), x E (0, l}n, gives the maximal clique of G. Here A is the adjacency matrix of G and for i, j = 1, 2, ..., n, a, = = 1 iff (v, vj) E E and e = (1, 1, ..., 1>’. Since G is an undirected graph and has no loops, it follows that A is a symmetric matrix with a,, = 0 for i = 1, 2,
...,
n. It is known that a point x’ E (0, 1)” is a discrete local minimum of xTAx ~ eTx iff x’, which is equal to x*, defines amaximal independent set for G [l]. The characteristic vector xs E (0, l}n is defined as follows: x; = 1 if v, E S, x; = 0 if v, E S for i - 1 , 2
,...,
n.Several neural network models, which are mostly of the Hop- field type, have been proposed for the maximum clique problem [2, 31. Even though the problem is discrete in nature, both discrete and continuous models of neural networks are used. The method proposed in this Letter is based on a continuous cellular neural network [C“j [4], although the formulation is based on the 0-1 programing problem as stated above. The method given here is motivated by the piecewise linear dynamics of the CNN. Like most analogue neural network models, continuous relaxation is used for handling discrete variables and the original optimisation variables take discrete values as a function of these new variables. Since the cellular neural network minimises its quadratic energy function, the quadrati: cost formulation of the maximum clique problem is chosen here. The maximum cliques will be the stable states of the CNN. It ljhould be noted that, due to the nonregular structure of a given graph, the CNN used for approximating the maximum clique of the: graph may be fully-connected and, further- more, may possess a nonuniform connection weight pattern. Cellular neural network formulation for maximum clique problem: The motivation of the proposed method is the completely stable dynamical behaviour of the CNN. It is well known that the dynamics of the CNN, given by the following state equations: -
1 2
x = -sx
+
W f ( x )+
U f ( Z k ) =-(IQ
+
11 - lzlc - 11) l < k < n (1) where x and U are the state vector and input vector, respectively,minimise the related ‘energy’ function [4, 51 for the symmetric W matrix. This energy function is as follows:
1 1
2 2
ECNN(X) = --FT(x)Wf(x)
+
-fT(x)f(x) - u T f ( x ) (2) For CNN formulatiorl, the cost function for the maximum clique problem is redefined as given below:E(x) = :cTAx - e T x
+
X ( X ~ X - eTx) ( 3 ) Here, the last term is :added to obtain binary steady-state outputs for the CNN. Since the stable states of the CNN are elements of {O, l}-, the unipolar binary variables x E [O, l p have to be trans- formed into bipolar ones. After defining new variable y := 2 x 4 ,the ‘energy’ function becomes
IVl
Here, the term yTSy -- yTSy = 0 is added in order to obtain a dynamical representation similar to CNN which has non-zero self state feedback connection weights. The equation system governing the CNN dynamics after the change of variables and related with the energy function given in eqn. 4 will be as follows:
Densitj
Y - -6Y
+
Wf(Y) + U (5) where W := [(6 - h)I - A], U := (I - A)e. Thus, the defined weight matrix W is symmetric, since A is the adjacency matrix of the con- sidered undirected graph. The diagonal of W is positive, because S is positive valued while h is negative valued. In the CNN formula- tion stated above, A is used in defming the connection weights in a fully connected CNN. As stated in [4, 51, the CNN is completely stable for a symmetric weight matrix W and the stable equilibrium points of eqn. 5 are the minimums of the ‘energy’ function in eqn. 4. Solving the differential equation eqn. 5 coincides with finding a maximal clique of G.Table 1: Average clique sizes found for 100- and 400- graphs with densities of 0.25, 0.50 and 0.75
0.25
100 0.50 Overall average 7.59I
0.75 113.87 113.5621 14.24I
14.69I
14.40I
15.18I
0.25I
5.53 15.099I
5.96I
5.91I
6.08I
6.046 400I
0.50 9.24 8.866 10.03 0.75 I18.74~18.116l 19.93I
6?9?:I
i
8
:
1
:3 2”d8:I
Experimental results: The performance of the CNN is illustrated on random graphs of various vertex sizes and densities. Average maximum cliques, where the averages are taken over the test graphs generated with the same characteristics, i.e. the vertex size and densities, are considered as the primary performance measure. This performance provides an indirect comparison of the results obtained here with those reported for continuous Hopfield dynam- ics [CHD]. Another performance measure is also considered, in which the averages are computed for the same test sets but taking into account only the best results obtained on each graph in five and ten independent runs of the CNN with random initial condi- tions. This measure shows the ability of the method to find differ- ent search directions when it is started from different initial points. The experimentalresults are summarised in Table 1 for h = 4 . 5 ,
S = 0.01 and the initial conditions chosen randomly near the ori- gin. Further experimental results are given in [6], where compari- son with saturated linear dynamics i s also considered.
Conclusion: In this Letter a method based on cellular neural net- works is introduced to approximate the solution of the maximum clique problem. The quadratic cost formulation of the maximum clique problem is considered here to exploit the quadratic energy function minimisation capability of the CNN. The adjacency matrix of the considered problem is used in defining the weighted connections in a fully connected CNN. The stable equilibrium points of the CNN are the minimums of its energy function, which is equated to the quadratic cost function of the maximum clique problem. Solving the differential equation system defining the cel- lular neural network gives one of the maximal cliques as the local minimum of the related energy function.
0 IEE 1998
Electronics Letters Online No: 19981026
N:S. Sengor, M.E. Yalqn, Y. Calm, M. UGer and C. Giizeliv
(Istanbul Technical University, Maslak 80626, Istanbul, Turkey)
F. Pekergin (LIPN
-
Universitk Paris-Nord, 93430- Villetaneuse, France) 0. Morgul (Bilkent University, Bilkent, Ankara, Turkey)I June 1998
References
1 PARDALOS, P.M., and ROGERS, G.P.: ‘.A branch and bound algorithm for the maximum clique problem’, Comput. Oper. Res., 1992, 19, (S), pp. 363-375
2 JACIOTA, A.: ‘Approximating maximum clique with a Hopfield network’, ZEEE Trans. Neural Netw., 1995, 6, ( 3 ) , pp. 724-735 3 FUNABIKI, N., TAKEFUJI, Y., and LEE, K.c.: ‘A neural network model
for finding a near maximum clique’, Parallel Distrib. Comput., 1992, 14, pp. 340-344
4 CHUA, L.o., and YANG, L.: ‘Cellular neural networks: Theory’, ZEEE
Trans. Circuits Syst., 1988, 35, pp. 1257-1272
5 WU,C.W., and CHUA, L.o.: ‘A more rigorous proof of complete stability of cellular neural networks’, IEEE Trans. Circuits Syst., 1997, 44, pp. 370-371
PEKERGIN, F., and MORGUL, 0: ‘An application of cellular neural network: Maximum clique problem’. 1998 Fifth IEEE Int. Workshop on Cellular Neural Networks and Their Appl. Proc., London, 1998, pp. 208-21 1
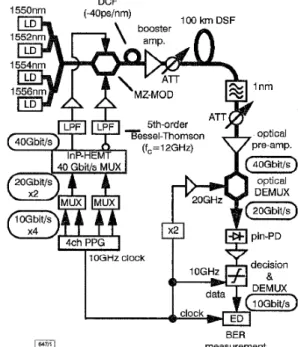
complementary data) were converted to duobinary signals by using fith-order Bessel-Thomson lowpass fdters (LPFs), with a 3dB bandwidth of 12GHz, as a duobinary filter. The duobinary
Mach-Zehder (MZ) with an electrical 3dB bandwl&h Of 30GHz
L71.
A high-power driver with 20GHz bandwidth was used for 40GbiUs duobinary modulation. The driving voltage was -5V,,. To realise good eye-opening of the 40GbiUs optical duobi- nary signal, this voltage was slightly higher than the half-wave- length voltage of the MZ modulator, 3.9V.Four optical camers, whose wavelengths ranged from 1550 to 1556nm, were simultaneously modulated by the push-pull type MZ modulator. The zero-dispersion wavelength of the l0Okm transmission fibre was 1540nm and its dispersion was 0.66pslnml
km
at 1550nm. To reduce the total dispersion and to decorrelate the four-channel optical signals, a short dispersion compensation fibre (DCF) preceded the transmission fibre. A total power of +13dBm was launched into the transmission fibre. A lnm optical bandpass fdter (OBPF) was used for WDM channel selection, and the selected signal was optically demultiplexed into a 20 GbiUs return-to-zero optical signal with an MZ modulator. The 20Gbitis optical signal was detected by apin photodiode and demultiplexed into a 1OGbit/s signal by a decision circuit.6 SENGOR, N.S., YALClN, M.E.3 CAKlR, Y.3 UCER, M.5 GUZELIS, C.9 signals were supplied to two electrodes of a push-pull type Limo,
16OGbit/s
WDM
transmission experiment
using four 4OGbit/s optical duobinary
channels
K. Yonenaga, M. Yoneyama, Y . Miyamoto,
K.
Hagimoto and K. NoguchiFour-channel multiplexed MGbit/s optical duobinary signals are successfully transmitted over a lookm dispersion-shifted fibre for the fist time. 40Gbitis based four-channel WDM transmission without individual channel dispersion compensation was achieved by virtue of the high dispersion tolerance of the optical duobinary
z
signal. ._
Introduction: To construct ultra-high-capacity networks, high- speed optical transmission technologies are very important. The transmission capacity of a single camer has recently reached 4OGbitis in electrical time-division multiplexing systems [I, 21. In such high-speed optical transmission systems, the tolerable disper- sion range is very small and precise dispersion control is indispen- sable [3]. For expansion of the dispersion range, the optical duobinary transmission technique is promising [4], and has been demonstrated in a 40GbiUs transmission system [5]. The optical duobinary technique is also suitable for WDM transmission sys- tems that multiplex high-speed channels because of the high dis- persion tolerance and high frequency-utilisation efficiency.
This Letter demonstrates 16OGbiUs WDM transmission using
four-channel multiplexed 40 Gbitis optical duobinary signals over h,Znm/div. h,2nm/div. a l0Okm dispersion-shfted fibre (DSF). The optical duobinary
technique expands the usable bandwidth and transmission distance in 40 Gbitis based WDM systems without individual channel dis- persion compensation or dispersion slope compensation.
b C m
Fig. 2 Optical spectra of 40Gbith optical duobinary signal and four-
a 40Gbith optical duobinary signal spectrum
b WDM spectrum before transmission (Okm)
c WDM spectrum after transmission (100km); Pin = +13dBm
WDM
Fig. 2 shows the optical spectra of the 40GbiUs optical duo- binary signal and the four-channel WDM signal. Fig. 2b shows the WDM spectrum before transmission. The camer wavelengths were 1550nm (channel l), 15521x11 (channel 2), 1554nm (channel 3) and 1556nm (channel 4). All channels were in the anomalous dispersion region, i.e. apart from the zero-dispersion wavelength of the transmission fibre (1540mn). Fig. 2c shows the WDM spec- trum after lO0km transmission. No four-wave mixing was observed because of the large dispersion in the signal wavelength region. Fig. 2a shows the expanded spectrum of the 40Gbit/s opti- cal duobinary signal (channel 2). The spectrum shows characteris- tics of narrow bandwidth and a suppressed carrier, basic attributes of an optical duobinary signal.
Fig. 3 shows the results of l00km DSF transmission. The 4OGbitis eye-diagrams, shown in Fig. 3a, were observed at the input of the optical demultiplexer. All channels have good eye- opening even though individualchannel dispersion compensation was not used because of the high-dispersion tolerance of the opti- cal duobinary signal. Fig. 3b shows the average bit error rate (BER) performances for all channels. The BERS for the four demultiplexed time slots were individually measured by adjusting the clock phase. Receiver sensitivity difference between the four Fig. 1 Schematic diagram of experimental setup demultiplexed time slots was < 1dB for all channels. The DCF
(40ps/nm), which was inserted to reduce the total dispersion and to decorrelate the four-channel optical signals, was not used in Experiments: Fig. 1 shows a schematic diagram of our experimen- back-to-back BER measurements. Before transmission, the tal setup. A 27-1 pseudo-random binary sequence (PRBS) 4OGbiU receiver sensitivity at a BER of le9 was -23.2dBm for all chan- s signal was generated by an InP-HEMT selector IC [6] from two nels. After 100
k m
transmission, the sensitivities for channels 1, 2, 27-1 PRBS 20Gbitis signals. The 40GbiUs binary signals (data and 3, and 4 were -23.8, -24.6, -24.8 and -25.2dBm, respectively. It is1506 ELECTRONICS LETTERS 23rd July 7998 Vol. 34 No. 15
E R