FOOD AND CLOTHING CONSUMPTION IN TURKEY Ebru ÇAĞLAYAN Marmara University Istanbul, Turkey [email protected] Melek ASTAR Istanbul Bilim University
Istanbul, Turkey [email protected]
Abstract:
This paper estimates models of Engel curves for two household commodities, namely food and clothing in Turkey using LAD, M and LTS regressions beside OLS. Obtain results indicate that income elasticities of both food and clothing expenditures are smaller than one, in other words both food expenditure and clothing expenditure are compulsory ex-penditures. In the light of the obtained information, it can be said that tax applications on compulsory expenditures that mean vital needs shall be in a way that will impact the low in-come groups less.
Keywords: Engel curve, robust regression, food consumption, clothing expenditure, Turkey
JEL classification: D1, D12, C01, C21 1. INTRODUCTION
Engel curve reflects the income and consumption relationship of households and thus plays an important role in the countries’ policies regarding income distri-bution. Especially with the acceptance of food expenditures from household expenditure groups as compulsory goods according to Engel curve, this strong rela-tionship found between food and income became an important criterion for measuring the welfare levels of the households in both developed and developing countries. It is possible to say that the food expenditures concluded to be compul-sory expenditures in the Engel curve are used as a criterion in determination of the poverty line of households in recent years. Thus, Engel curve has important roles both in consumer demand theory and determination of the welfare levels of house-holds.
These curves that show the consumption and income relationships are named after C. L. Ernst Engel (1821 – 1896) who is a German statistician known with his pioneer studies on the subject of household budget surveys, and these curves
basi-cally indicate the relationship between household consumption expenditures and household income. Engel curve show how the preferences between groups of goods change when there is an increase in the household income while the prices of the goods are fixed. Thus in the basis of the Engel curve, it is possible to say that households primarily tend to satisfy their most basic needs and that the welfare level increases as the expenditure share allocated for compulsory goods within the consumption expenditure decreases.i
Engel curves were widely examined by using different econometric methods for different groups of goods. For example, Houthakker (1957) analyzed the in-come elasticities of 30 different countries for four different expenditure groups. Banks et al. (1997) analyzed Engel curve and consumer demands with the help of British data using non-parametric analyses. Blundell et al. (1998) examined the consumer demands with semi-parametric methods and interpreted the different demographical states of households based on Engel curve. McDowell et al. (1997), analyzed household consumption expenditures with Tobil model using Engel curve. You (2003) used both standard and robust models in the study where food, transportation, cigarette and alcohol expenditures were examined with Engel func-tions. At the end of the study, it was stated that robust methods exhibit better performance compared to EKK. Moreover; Working (1943), Hausman et al. (1995), Bryne et al. (1996) examined Engel curves using parametric methods.
The aim of the study was to calculate the income elasticities obtained from Engel curve by benefiting from the data of Turkish household budget survey 2009 and thus determine in what way the household consumption preferences had changed. In the study, estimations were made for food and clothing expenditures based on Engel curve. Engel curve is based on consumption functions and as these functions can be formed between income and total expenditure, they can also be formed between household income and individual expenditure items. And thus, it is enabled to determine if any good is a compulsory good for the household or a luxury good by examining different groups of goods. In many of the studies with OLS, it was seen that diagnostic tests were overlooked while decides some as-sumptions and functional form. In this study, diagnostic tests were also considered. Moreover the estimates are made by considering the outliers problems faced wide-ly when cross-section data are used. Thus LAD, M and LTS regressionsii were used
besides OLS and estimate results were compared.
In the second section that follows the introduction in this paper, the method-ology is described, and in the third and fourth sections, data and empirical results are given. And the conclusion is given in the fifth section.
2. METHODOLOGY
The regression model can be written as
where is the vector of independent variables and is vector of parameters. The tra-ditional method is the least square to estimate the parameters. The OLS estimator
where is the residuals and .
Robust regression is an important tool to provide stable results in the presence of outliersiii. However, the presence of outliers can strongly distart OLS estimator
and lead to unreliable results. In this study we use robust regression methods are called least absolute deviation (LAD), M and least trimmed squares (LTS) regres-sions to estimate s beside the OLS.
LAD Regression estimator defined as
and M-regression estimator defined as
where is a loss function. Residuals are standardized by measure of dispersion . The LTS estimator is defined as
where h is the same number less than and h is defined in the range (i) indicates sorting. LAD and M-estimators are robust to vertical outliers but turned out not to be resistant to bad leverage points. LTS re-gression can completely disregard influential outliers from the fit of the model.
3. DATA
In the study, the objective was to examine the relationship between income and consumption of households. For the analysis, 2009 Household Consumption Expenditure data obtained from TUIK (Turkish Statistical Institute) were used. The data was generated from Household Budget Survey conducted on a total of 1419 sample households between the dates of January 1 and December 31, 2009 by TUIK (TUIK 2009-CD)iv.
After the required arrangements were made in the obtained cross-sectional da-ta (lost observation, determining the socio-demographic characteristics of the head of the household instead of all the members of the household etc.), the variables were formed. In the analysis, food expenditures and clothing expenditures were taken as dependent variables. And independent variable was accepted as the dis-posable income of the household. In the study, different models were estimated both for the food and clothing expenditures. 72% of the households that are includ-ed in the study were living in urban areas and 28% were living in the rural areas. 69% of the household heads were male, 31% were female, 88% were married, and 3% single and 9% were divorced. While 15% of the household heads were
unedu-cated, 47% were primary school graduates and 27% were secondary school or high school graduates and 11% were at least university graduates.
4. EMPIRICAL RESULTS
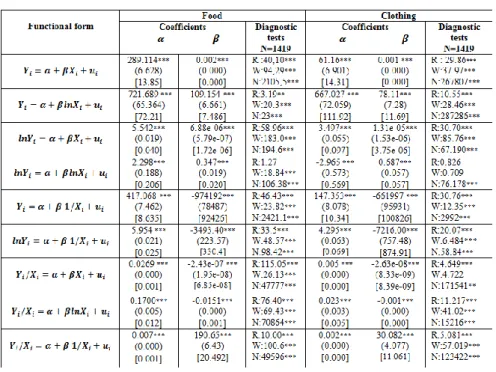
With the income elasticities obtained by estimating the Engel curve functions, it became possible to determine which groups are compulsory goods and which are luxury goods for households. However, first it was required for the appropriate functional form to be determined for the Engel curve. To be able to make predic-tions for food and clothing expenditures based on Engel curve in the analyses conducted using the household budget survey data during the study, first 9 different functional forms used mostly in the literature were estimated using OLS. Estimate results are given in table no. 1
Table no. 1 Functional forms of Engel curve
(i) *,**,*** indicate significance at the level 1%, 5% and 10%, respectively (ii) Figures in parenthesis are standard errors and in blankets are White heteroske-dasticity consistent standard errors.
(iii) R:Ramsey Reset Test for specification error, W:White Test for heteroscedasticity , N: Jargue-Bera Test for Normality
(iv) N refers numbers of observation
For 9 different estimated functional forms, all coefficients both in food and clothing expenditures were found statistically significant. First, RESET test which is a modeling specification error test was conducted. According to the test, it was determined that appropriate functional form for both food expenditure and clothing
expenditure is log-log model. Moreover, the presence of heteroscedasticity in data was tested because it is a common problem encountered while using cross-sectional data. The results of the White (1980) test for heteroscedasticity indicated that the null hypothesis of a constant variance is rejected at the 1% level. A Jargue and Bera (1980) normality tests rejected any reasonable level null hypothesis of normally distributed. The results of Jargue-Bera tests showed that error term are not normally distributed. The results of OLS showed that the model suffers from heteroscedasticity and non-normality. We also calculated the studentized residuals, standardized residuals and cooks-d to determine whether there are outliersv. The
re-sults of these tests gave strong evidence that there are also outlier problemsvi. To
get rid of these problems of OLS, we estimated the Engel curve for both clothing and food consumption by using robust regressions which are called LAD, M and LTS regressions. The results of LAD, M and LTS regressions are given in table no. 2.
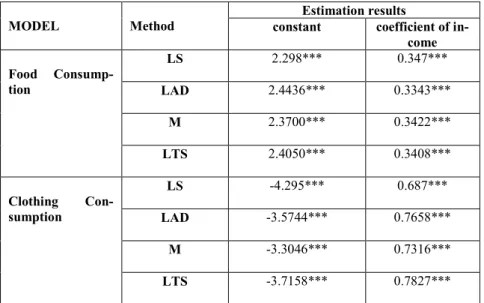
Table no. 2 Results of LAD, M and LTS Regressions
MODEL Method constant Estimation results coefficient of in-come Food Consump-tion LS 2.298*** 0.347*** LAD 2.4436*** 0.3343*** M 2.3700*** 0.3422*** LTS 2.4050*** 0.3408*** Clothing Con-sumption LS -4.295*** 0.687*** LAD -3.5744*** 0.7658*** M -3.3046*** 0.7316*** LTS -3.7158*** 0.7827***
(i) *,**,*** indicate significance at the level 1%, 5% and 10%, respectively. All the estimated coefficients of LAD, M and LTS were statistically signifi-cant. When the results were examined, it was observed that the LAD, M and LTS coefficients of the models, where food and clothing expenditures were explained with income, were very close to each other. Since the models were full logarithmic models, the coefficient of the income gave the elasticities. According to the results in the table, while the elasticity for food expenditures is 0.33 in LAD, it is 0.34 in M and LTS. Thus, food expenditures can be named as compulsory expenditures for 1419 households analyzed for Turkey. And for clothing expenditures, while the elasticity is 0.76 according to LAD, it is 0.73 according to M and 0.78 according to LTS. Even though clothing expenditures are obtained as values closer to 1 com-pared to food expenditures, the obtained results show that this value is smaller than 1 and clothing expenditures are compulsory goods (expenditures).
While the food expenditures were determined as compulsory expenditures in other words expenditures with less than 1 elasticity, clothing expenditures were de-termined as luxury expenditures having unit elasticity or more than 1 elasticity in most of the studies conducted for Turkey.
5. CONCLUSIONS
When the Engel curve related studies in the literature were examined, it can be seen that the elasticity for food expenditures is obtained as less than one and the elasticity for clothing expenditures is obtained less than one in some studies and as equal to one in others. In this study, both food and clothing expenditures were ana-lyzed individually using 2009 Turkish household data, and the way consumption behaviors change were examined with the help of Engel curve. For this purpose, 9 functional forms were estimated that can be used with Engel curve for food and clothing expenditures together with 1419 household data, and the best functional form that is valid under econometric assumptions was determined. Since the results of the OLS estimates were unreliable because of the existence of outlier problems, the estimates were made using LAD, M and LTS regressions. According to the re-sults obtained from these regression estimates, the income elasticities of food and clothing expenditures were smaller than one, positive and statistically significant. Even though the income elasticity of clothing expenditure was close to one, both expenditures are within the scope of compulsory expenditures according to these results. This indicates low income elasticity for all functional forms and all esti-mates for all income levels.
The basic result reached at the result is that the food expenditure is the largest expenditure within the household budget and the share of this expenditure in the budget decreases as the income increases. This result is in line with the main re-sults of Engel's study. As known, as the income increases the share of food expenditures within the total expenditures decreases according to the Engel curve. In other words, rise in the income distributes household consumption expenditures to expenditures other than food more. Thus, household consumption expenditures are no just focused on food expenditures. This indicates that it is possible for low income groups to be affected more from the tax policies applied to food and cloth-ing expenditures. Thus, it would be better if tax policies were applied in a way that will impact low income groups less in tax applications regarding compulsory ex-penditures that mean necessities. Since food exex-penditures are accepted as compulsory expenditures, in other words necessities according to Engel curve, food expenditures can play an effective role in the determination of poverty line.
References
[1] Banks, J., Blundell, R., Lewbel, A., 1997, Quadratic Engel Curves and Consumer Demand, The Review of Economics and Statistics, 79(4): 527-539.
[2] Belsley, D.A., Kuh, E., Welsch, R.E., 1980, Regression Diagnostic: Identifying Influ-ential Data and Sources of Collinearity. New York: Wiley.
[3] Blundell, R., Duncan, A., Pendakur, K., 1998, Semiparametric Estimation of Con-sumer Demand, Journal of Applied Econometrics 13(5): 435-461.
[4] Byrne, P., Capps, O.Jr , Saha, A., 1996, Analysis of Food Away from Home Expendi-tures Patterns for U.S. Households, 1982-89, American Journal of Agricultural Economics, 78(3): 614-627.
[5] Cook, R.D., Weisberg, S., 1982, Residuals and Influence in Regression, London: Chapman and Hall
[6] Dubbelman, C., 1978, Disturbances in the Linear Model: Estimation and Hypothesis Testing. The Hague:Martinus Nihjoff.
[7] Hausman, J.A., Newey, W.K., Powell J.L., 1995, Nonlinear Errors in Variables: Esti-mation of Some Engel Curves, Journal of Econometrics, 65(1): 205- 253.
[8] Houthakker, H.S., 1957, An International Comparison of Household Expenditure Pat-terns, Commemorating the Centenary of Engel’s Law, Econometrica, 25(4): 532-551. [9] Jargue, C.M., Bera, A.K., 1980, Efficient Test for Normality. Homoscedasticity and
Serial Independence of Regression Residuals, Economic Letter, 6: 255-259.
[10] McDowell, D.R., Allen-Smith, J.E., Mclean-Meyinesse, P.E., 1997, Food Expendi-tures and Socioeconomic Characteristics: Focus On Income Class, American Journal of Agricultural Economics, 79(5): 1444-1451.
[11] Rousseeuw, P.J., Leroy, A.M., 1987, Robust Regression and Outlier Detection. USA: John Wiley&Sons, Inc.
[12] Verardi, V., Croux, C., 2008, Robust Regression in Stata, Department of Decision Sciences and InformationManagement, Katholieke Universiteit Leuven, http://papers.ssrn.com/sol3/papers.cfm?abstract_id=1369144, accessed on March 13, 2011.
[13] White, H., 1980, A Heteroskedasticity Consistent Estimator and a Direct Test of Het-eroskedasticity, Econometrica, 48(4): 817-838.
[14] Working, H., 1943, Statistical Laws of Family Expenditures, Journal of the American Statistical Association, 38(221): 43-56.
[15] You, J., 2003, Robust Estimation of Models of Engel Curves, Empirical Economics, 28(1): 61-73.
i Engel curve is generally shown with the equation . In here indicates
the goods group expenditure by the household hth and indicates the total disposable
income of this household. According to the Engel curve, if the income elasticity of the regarding expenditure group is less than 1, that good is a compulsory good (necessity) and if it is larger than 1 then that good is a luxury good.
ii See more detail for robust regression: Rousseeuw and Leroy (1987), Verardi and Croux
(2008)
iii In regression analysis, three types of outliers which are called as vertical outliers, bad
leverage points and good leverage points influence the OLS estimator. Robust regression is an important tool to provide stable results in the presence of outliers.
iv For budget survey scope, see TUIK Household Budget Survey 2009 CD.
v See Belsley et al. (1980), Dubbelman (1978) and Cook and Weisberg (1982) for more
detail.
vi We do not provide the findings of outliers in the text because of the huge data. However,