KADIR HAS UNIVERSITY
GRADUATE SCHOOL OF SCIENCE AND ENGINEERING
A PROBABILISTIC MODEL TO MAXIMIZE CROSS-SELLING REVENUES IN FINANCIAL INSTITUTIONS
GRADUATE THESIS
YASIN ALTUN
Ya sin Altun M .S . 2016 Stu de nt ’s F ull Na m e Ph .D. (o r M .S . o r M .A .) T he sis 20 11
iii A PROBABILISTIC MODEL TO MAXIMIZE CROSS-SELLING REVENUES IN
FINANCIAL INSTITUTIONS
YASIN ALTUN
Submitted to the Graduate School of Science and Engineering in partial fulfillment of the requirements for the degree of
Master of Science in
INDUSTRIAL ENGINEERING
KADIR HAS UNIVERSITY Jun, 2016
v “I, Yasin Altun, confirm that the work presented in this thesis is my own. Where information has been derived from other sources, I confirm that this has been indicated in the thesis.”
_______________________
ABSTRACT
A PROBABILISTIC MODEL TO MAXIMIZE CROSS-SELLING REVENUES IN FINANCIAL INSTITUTIONS
Yasin Altun
Master of Science in Industrial Engineering Advisor: Doc. Dr. Ahmet Yucekaya
Jun, 2016
Alongside earns, transaction volume and transaction number goals, banks also have cross selling rate aims in recent years. Also again, many banks of our day, have studies on transaction cost and calculate costs for every single transaction without missing any and take this information into account while calculating the actual profitability of customer. We searched which product could be sold to customer in this process. While doing this, we took the cost of offer into consideration and try to maximize yield/cost ratio. This is calculated by taking the owning ratio of customers in every segment for this specific product and average profit for every customer. The results are believed to be in a level to apply. The results show that decision support system works well.
Key words: Cross selling, Cross Selling in Banks, Profitability AP
PE NDI X C APPENDIX B
vii
ÖZET
YÜKSEK LİSANS TEZİ Yasin Altun
Endüstri Mühendisliği, Yüksek Lisans Danışman: Doç. Dr. Ahmet Yücekaya
Haziran, 2016
Bankalar getiri, işlem hacmi ve işlem adedi gibi hedeflerinin yanında, son yıllarda çapraz satış oranında da kendisine bir hedef belirlemektedir. Yine günümüzde birçok banka, işlem maliyeti alanında çalışmalar yapmakta, istisnasız her bir işlem için maliyet hesaplamakta ve bunu müşterinin gerçek karlılığını hesaplarken dikkate almaktadır. Biz bu sürecin içerisinde, müşteriye hangi ürünün satılabileceğini araştırdık. Bunu yaparken teklifin maliyetini göz önüne aldık ve getiri/maliyet oranını maximize etmeye çalıştık. Bunu, her bir ürünün her bir müşteri segmenti için ortalama kârını ve ürünün her bir segmentteki müşterileri için sahiplik yüzdesini dikkate alarak hesapladık. Sonuçların uygulanabilecek düzeyde mümkün olduğuna inanılmaktadır. Sonuçlar karar destek sisteminin çalıştığını göstermektedir.
Anahtar Kelimeler: Çapraz Satış, Bankalarda Çapraz Satış, Karar Destek Sistemleri, Karlılık APPENDIX B AP PE NDI X C APPENDIX B
Acknowledgements
I would like to express special gratitude towards my parents, guidance and support have been the greatest asset in my life as well in this thesis.
I would also like to express my gratitude to my supervisor Doç. Dr. Ahmet Yücekaya, whose vast knowledge, guidance and assistance has helped me get through the difficult process while preparing my thesis report.
I would like to offer a special thank you to my only real friends Barışcan Celebcioğlu for his words of advice and support.
AP PE NDI X C
ix
Table of Contents
Abstract Özet Acknowledgements List of Tables xiList of Figures xii
List of Abbreviations
xiii
1 Introduction ... 14
2 Customer Relationship Management ... 15
2.1 Customer Relationship Management ... 15
2.2 CRM Process ... 16 2.2.1 Choice of Customer ... 16 2.2.2 Customer Acquisition ... 16 2.2.3 Customer Protection ... 17 2.2.4 Deepening of Customer ... 17 2.3 CRM and Customer ... 18
2.3.1 Defining the Customer ... 18
2.3.2 Customer Separation ... 18
2.4 Acquisitions ... 20
3 Cross Selling... 21
3.1 Cross Selling ... 21
3.2 Cross Compentition ... 22
3.3 Access to Customer for Cross Selling ... 22
4 Case Study & Model ... 24
4.1 An Overview to Banking Sector in Turkey and ... 24
4.3 Segmentation Structure of Bank ... 31
4.3.1 Segment-1 ... 31
4.3.2 Segment-2 ... 32
4.3.3 Segment-3 ... 32
4.4 Developed Probabilistic Model ... 32
5 Conclusion and Future Research ... 37
5.1 Future Oriented Possible Developments ... 37
5.2 Result ... 37
References ... 39
xi
List of Tables
Table 1.1 Banking Sector Yield Ratios-1...24
Table 1.2 Banking Sector Yield Ratios-2...25
Table 1.3 Offered products and number of offers...36
Table A.1 The raw data pattern...43
Table A.2 Edited data by type of clients...44
Table A.3 Average yield for a customer's by products...45
Table A.4 Count of customers by products...46
Table A.5 Matrix of product ownership probability...47
Table A.6 Algorithm of product ownership probability...48
Table A.7 Example data for all offer...49
Table A.8 Algorithm for all offer...50
Table A.9 Example data for best offer...51
List of Figures
Figure 1.1 Table that was created for edited data by types of clients...30
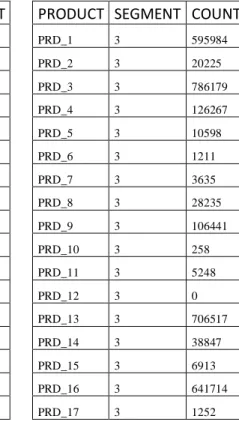
Figure 1.2 Table that was created for product, segment and product revenues...30
Figure 1.3 Count of customer by segments...31
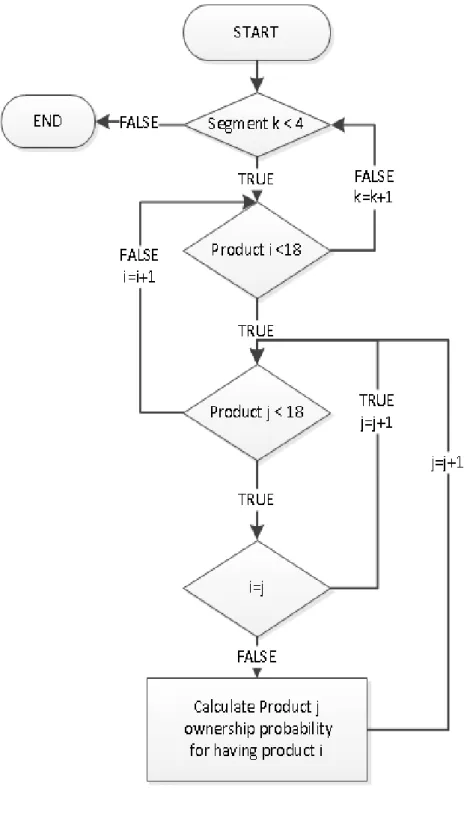
Figure 1.4 Flow model...33
Figure 1.5 Table that was created for matrix of product ownership probability...34
Figure 1.6 Table that was created for all offer...34
Figure 1.7 Tables were created for all offer and parametric ratio...35
xiii
List of Abbreviations
ROA: Return on Assets ROE: Return on Equity
BRSA: Banking Regulation and Supervision Agency (in Turkish BDDK) BAT: The Banks Association of Turkey
SDIF: The Savings Deposit Insurance Fund PBAT: Participation Banks Association of Turkey NPTB: Next Product to Buy
Chapter 1
Introduction
Together with CRM products, customer relations begin to be more measurable and begin to turn into concrete data. Companies try to understand the desires and demands with their obtained data and label them after classification. Developed technology creates an environment to process those data deeply and analyze the shopping tendencies of customers systematically.
Under the light of all those new approaches appears on communication with customer and selling techniques. In markets that competitiveness is really high, companies focus on keeping all the customers in their portfolio with the information and abilities. Without any doubt, the reason lying under this situation is to create additional resource for their new investments with taking a step forward of their competitors. Under all those conditions, companies do not have endless resources. They will expect maximum benefit with the resources they currently have. They will expect to have new customers with minimum cost, to preserve current ones and to get more profit.
In this study, cross selling technique is tried to be applied in order to get maximum gain and minimum offer cost in banking sector. Product profitability and ratio of customer's having this product are discarded from this and those information is used as decision criteria.
This thesis includes 5 chapters that are organized as follows:
Chapter-2; General Overview on CRM concept, process and benefits. Besides that, it includes relation between CRM and customer and customer classifications.
Chapter-3; cross-selling concept, practices and reaching to customer. Chapter-4; Case study and details on developed practice.
15
Chapter 2
2.1 Customer Relationship Management
Customer relationship management (CRM) is a process that is established between the company and the customer before and after sales and involves mutual benefits covering all actions. It could be also said that creating satisfaction and loyalty of customer is main objective as a result of customer relations. CRM concept and developed solutions does not have that old history.
Customer Relationship Management (CRM), became an important element of shopping in previous times but the concept gained its validity in the mid-1990s. a study conducted in 2001 By Harold Goldberg, concluded that less than half provide an adequate return on their CRM investments.(Goldberg, 2001) CRM which has gained increasing importance for businesses had gained certain level of attention at first. Changing market and the increasing value of knowledge has caused constantly renewed and developed CRM products and businesses to look with more interest in the use of CRM, CRM market revenue in 2008 came to $ 9.15 billion. (Gartner, 2009)
In short, CRM can be described as follows: "The customer will ensure the preservation and increase of the value added forms of fixed infrastructure and add value to customers will gain their loyalty as a long term buy -that also buy against- and the whole right approach to ensure sustained." (Aydin 2006) CRM relationships with customers based on trust and customer price, place, promotion and sales as well as for the important building blocks to provide the best product.
The world is changing every day, especially in recent years, the spread of technology and globalizing to monitor changes in the world and it is quite challenging to adapt to corporate firms. Under the light of these developments, traditional marketing methods are being demolished, it remains bound to collapse if they do not update themselves on new emerging methodologies. Consumers are able to find the most suitable products and offer him a click and technology. Almost in all sectors competition have increased that high in history. Many giant companies that cannot manage the process and ended
in bankruptcy while companies whose names unheard can become giants in the industry in a very short period of time.
Companies are focusing on profitability in this challenging competitive environment and works to reduce the price in terms of competition. Enterprises have to lower their prices and costs and are forced to optimize their activities in various fields as human resources, production, sales, and logistics. It is necessary to reach a certain sale turnover to get expected profitability. In order to have this, it is necessary to sell the existing or new products and services to customers.
It should be noted that every move results in costs. Indeed, performed researches suggests that the cost of selling the product to a new customer shows that an average of 6 times to sell to existing customers. It is observed that in some sectors and businesses that cost reaches up to 13 times. (Aydin 2006) This situation clearly shows that using the current customer potential is very important for their benefit. It's very good for the existing customers recognize, plans must be carries out to increase its loyalty and sell more products. Existing customers should be analyzed in terms of habits and tendencies and should produce specific solutions and recommendations in accordance. Such approaches will allow to reach maximum sales turnover at minimal cost to the company for predicted profitability.
2.2 CRM Process
There are 4 stages accepted in CRM. In short, those are: 2.2.1 Choice of Customer
In the first phase, the main purpose of CRM to find an answer to the question of "Who are the most profitable customers?”. Product descriptions, marketing studies, market research they are all at this stage. Besides, at this stage target group of the business is also identified. To have a better understanding of customers and to provide them with specific products and services, customer segmentation is subjected. Brand, customer and campaign planning is performed with new product launches.
17 The second phase of CRM is "Customer Acquisition" stage. Customer choice around the designated target group, the achievements made towards the promotion of work and initiatives to be carried out and so on. actions. In this stage, main goal is to realize the selling activity and customer acquisition. The answer for the question "What is the most effective way for sales?" is tried to be found.
2.2.3 Customer Protection
Third stage of the CRM is “Customer Protection". Customer loyalty and customer satisfaction are also located on this axis. Here, the aim is to retain customers for a long time as far as possible the aim is to connect them to the company, also to keep the business and to ensure the continuity of the relationship. As the communication with customer develops, the loyalty of customer will increase in accordance with that.
Keeping good customers, sustainability, making them loyal customers are critical for businesses. Otherwise the ones who left one business could be the best customer of a competitor business. Increased competition and markets in the developing world with different continents can even create competitive pressure. That is why companies are turning to customer and can be forced to revise their activities to keep them satisfied.
The researches put some important results in to light as follows; a 5% increase in customer retention has the same effect as a 10% increase in profits overhead. In order to gain a similar customer instead of the one business lose requires 5 times more time, energy and money.( Odabaşı 2004:123)
Keeping customers is useful for both businesses and customers. In exchange for financial and nonfinancial costs, quality customer obtains satisfaction and benefit. Above that in terms of customer, having relationship is an investment. Customer wants to benefit from this investment in the long term. Time that would spend in a well formed and spread to long term is another opportunity to use that time for another area.
2.2.4 Deepening of Customer
customers that are gained in terms of loyalty. Long-term protection of customer loyalty and profitability of acquired and includes steps to boost the share of customer spending.
2.3 CRM and Customer
2.3.1 Defining the Customer
The most important focus areas of CRM are customer and customer loyalty. Customers are the most important asset of the company to maintain the business. Every information is searched related to them and it is tried to keep every shopping record. Their attitude is investigated every time they come across with the organization. This attitude is mapped to organize a customer relation process and so different points could be seen related to customer. In fact, this process is then turned into the standards and procedures to be used by people to connect with the customer.
All of these efforts are to provide the most accurate service to customers. However, it is not right to give same service to every customer. Some of them are much more profitable for the business and so their loyalty is given much more importance. Those are the right customers and it is a right approach to give much more effort for such customers.
2.3.2 Customer Separation
As every customer need different things, businesses also expect different things. This situation has a common part for businesses. Not every customer has same added value for business. This is why businesses start from their best customers and separate starting from that point. Business uses this classification to get maximum advantage with minimum effort.
This stage is the core of CRM. Evaluating customers as good or bad, and develop strategies to these customers is the basis of this phase.
19 parallel line with the value of the customer. In customer classification, the value of the customer is used for business. This value can change for every business. In general, customer value is up to those components.
Profitability of customer is the most important component to specify its value. It should be noted that every customer causes a cost to business and this cost value changes according to every customer. For example, a bank customer who perform every procedure on call center and another bank customer who perform every procedure online. This is why some cost items like maintenances / support / use should be scaled and be reflected to customer profitability while calculating the profitability of customer.
Customers which are dynamic, open to innovation and have high socio-economic statue increase the value of businesses. For example; for a bank of which majority of customers who process all the channels, called as traditional branch banking to a bank consisting of pensioners, to cut in traditional banking activities and thus will show more resistance than other banks in reducing costs.
Customer group to which cross selling could be performed will add positive value to businesses. To increase the customer loyalty and profit margins are two of the major benefits of cross-selling.
Another factor to determine the value is value quality. The quality of customer information and being up to date is important to have good research and planning based on those data to get better results.
After the value of customer is weighted, customers are classified. In this framework, Peppers and Rogers classified customers as follows: (Peppers and Rogers 1999)
1. Most valuable customers
2. Most expected to grow customers 3. Under zero customers.
which will have classification for the first time. This structure may be different for every business.
Good customer segmentation; The creation of customer-specific campaign, studies to be performed (new products, marketing analysis, etc.) contribute to the identification of audience. Besides those, it helps to label the customer and identifies the value and place of the customer for business. Profit potential analysis to the business and investment planning plays an active role in directing the correct use of existing resources and the right investment.
During this distinction as the guiding criteria that should be considered first customers were the last time, what is often and how much information they've bought your product or service. At this point, the main purpose should make customer loyal to business, return the potential customers into valuable customers and if customers which give damage to business could not be turned into potential customers, get rid of those customers.
There are two groups of needs to differentiate customers according to their needs. First group is the requirements. This means that customer's needs are the same with other another customer's, so it is a conflict (general requirements). At first, it is important to meet the general requirements.
Second group is the personal requirements. As an example of that, a business' knowing your marriage anniversary and offers you special campaigns.
2.4 Acquisitions
Businesses which know their customers and identifies their needs, appetites and preferences in a right way could see concrete results in their profitability. Sales revenue from the improvement in costs, the impact of CRM in many areas has increased quality of proposals of customer satisfaction. CRM also has an impact on cross-sales ratio and true customer loyalty or indirectly. (Aydin 2006) Finding new customers in addition to the effect of the protection of existing customers and provides the opportunity to cross-sell to existing customers.
21
Chapter 3
3.1 Cross Selling
Overall cross-selling is defined as "to sell a new product or service to the same customer". In CRM, cross selling is not limited with this definition. In CRM, it is the right time to present itself to cross-sell a product that's likely to get customers. Also in CRM, cross selling is not just performed "to sell more" but also to increase the long term loyalty of customer and lifelong value.
Cross-selling targets to seize the market in the long term rather than short-term results and is carried out by a management approach that aims to satisfy existing customers. Cross-selling is a sales technique has been developed starting from the fact that customer is open to the exchange during the exchange and it is an attack to customer at its most vulnerable time. For example, when you go into a store, all you want is to buy pasta, and it is very likely that you see ketchup and mayonnaise placed immediately next to the pasta. Actually, the goal is to get this layout also considering the possibility of getting ketchup to customers who unwittingly get pasta and get ketchup and / or mayonnaise. The subject of the shaving cream and lotion next to the razor blade with the same logic to put the toothpaste or toothbrush next is not by chance. All those placements are cleverly designed cross selling placements. To see the most significant cross-selling applications in the electronics store, it will be sufficient to refer to the book sales site.
For example, in the automotive industry world-famous brand's Turkey cross selling campaign shows that while buying an upper segment car, lower segment car is offered at advantageous prices.1
Research very clearly shows that the promotion techniques are now an indispensable tool in marketing and cross-selling method is way too cheap to compare with other promotional methods. With this method, the buyer and the seller can communicate simultaneously to multiple channels and different channels can be used for different purposes in the campaign. The diverse and intensive promotion in the sales market to
1
http://www.mercedes-benz.com.tr/content/turkey/mpc/mpc_turkey_website/tr/home_mpc/passengercars/home/new_cars/cr oss-selling.html
stand out from competitors in sales activities, give the message to the target audience in the right way and draw attention to other products through a product is considered to be the most accurate method of cross-selling techniques.
3.2 Cross Competition
On the same level of distribution channels, selling similar goods, but the competition between enterprises is different in terms of structure is called cross competition. A supermarket's competition with a grocery store could be an example of this. Businesses instead of competing with the same weapons against each other, differentiates and prefer to compete with different weapons.
Weapons will be referenced in the traditional methods of competition are obvious and there is a limit to the use of these weapons. In cross competition, there is chance to differentiate and use different weapons. The new production and distribution methods, new promotional techniques, could be thought as examples of these new sales policies. Companies that want to increase the loyalty of customers, tries to sell all of the products that they can sell to that customer and performs different campaigns and activities for it. The result is also connected to the customer who will go to his opponent and prevents it from sliding sales turnover of its competitors. This strategy will provide a positive resolution of competing in the long term.
3.3 Access to Customer for Cross Selling
Customer access is generally too painful to business to offer cross-selling alternatives. Companies usually use SMS, E-Mail, phone, brochures channels etc. to reach customers. There are pros and cons to return in specific risks of each channel. As the bids are ineffective in some customers, not coincidentally coincided with a real customer needs can be unattractive. SMS or phone through offers could cost high. There is problem of Junk for mail campaigns. Several studies carried out for the opening of the nose again, and ultimately increase costs.
All across the assumptions that channel customer communication channels are no way or that way. This is the way to offer something. Although there are different channels to reach customers in the US national of fixed and mobile phone according to the
Do-23 Not-Call legislation in 2008, "Do not call" register the list of citizens, are not called for any product sales. May 1, 2015 the date by Turkey also entered into force 6563 on Electronic Commerce and the Law on Regulating now consumers themselves unauthorized sending promotional SMS and email into Mail about a complaint to such a variety of sanctions on the company.
Mentioned new legislation enters into force recently in Turkey. July 2015 - April 2016 between about 180 thousand complaints made these in line with and a fine of 1.3 million TL has been applied. (“Istenmeyen Mesajlara Ceza” 2016) These figures are in the United States are in a much larger size. America by the end of the year 2010, 200 million users has registered a do-not-call situation. And opened 105 criminal cases in so far given 118 million dollars in fines in the amount of $ 737 million is still waiting for the court. (“10 Years of Do Not Call” 2013)
In light of all these companies should tighten it to reach the customer should not be exposed to criminal sanctions and loss of customers. For this, business must find the best channel for each customer and perform a special presentation to the customer.
Chapter 4
4.1 An Overview to Banking Sector in Turkey and Competitiveness
According to Banking Regulation and Supervision Agency (BRSA) data in Turkey, in March 2016, including 3 public, 29 private, and 13 investment banking activities including 6 participation banks in a total of 51 banks are active. In the last 3 years, public banks have made application to establish participation banks and 2 of them have started their activities. In addition, one of the world's largest bank by buying in Turkey has started its activities in retail banking. (“Turkiyedeki Ilk Cinli Banka” 2015) Yet Chinese banks in Turkey 7th largest bank in the world has received permission to be established. (“Bank of China'ya izin” 2016)
All this shows that in retail banking in Turkey there is full competition with 38 retail bank, 12152 branch, 46574 ATM, and 210383 staff. Credit rating agencies states that banks in Turkey is expected to be in more competition in the coming years. (“S&P: Turk bankalari” 2015) However, the sector is not yet fully stabilized competition culture positive results in terms of financial indicators of the bank. (“JCR/Okmen: ECB'nin politikalari” 2015)
As well as, located in Turkey's 12th largest bank which is a British bank decided to leave Turkey in the last one year. However, the bids and evaluations given up as a result of bank sales, profitability heading towards profitability has decided to suspend its activities in the area is low. (“Sok! Satilamayan HSBC” 2016) Bank has invested heavily in credit cards, but could not find the return money for them. The Bank's 2014 global annual report on Turkey's difficulties, the geopolitical risks in the country, civil demonstrations and was linked to the Central Bank to limit its interest credit card with the BRSA. (HSBC Group 2015)
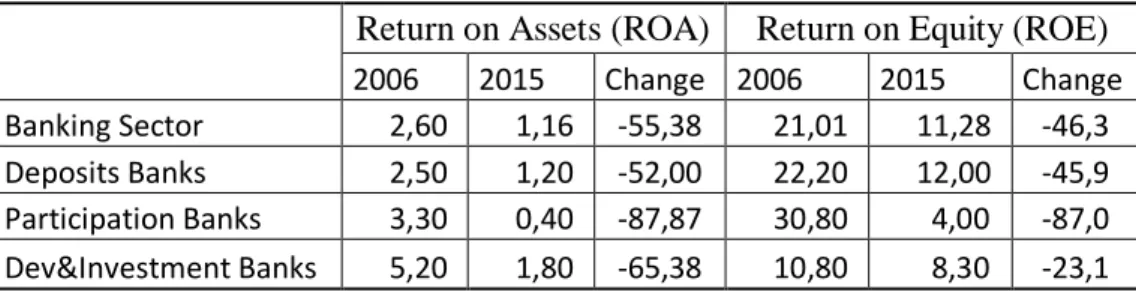
Table 1.1 Banking Sector Yield Ratios-1
Return on Assets (ROA) Return on Equity (ROE)
2006 2015 Change 2006 2015 Change
Banking Sector 2,60 1,16 -55,38 21,01 11,28 -46,3
Deposits Banks 2,50 1,20 -52,00 22,20 12,00 -45,9
Participation Banks 3,30 0,40 -87,87 30,80 4,00 -87,0
25 Table 1.2 Banking Sector Yield Ratios-2
Banking Sector Yield Ratios (%)
Return on Assets (ROA) Return on Equity (ROE) 2002 16,39 135,63 2003 2,53 18,15 2004 2,36 15,76 2005 1,72 12,14 2006 2,60 21,01 2007 2,78 24,77 2008 2,05 18,74 2009 2,63 22,92 2010 2,46 20,12 2011 1,74 15,48 2012 1,83 15,68 2013 1,60 14,19 2014 1,33 12,25 2015 1,16 11,28
Banks, especially with the decline in the return on equity of up to 50% after the year 2010, is grappling with the problem. Turkey cannot be possible to manage the process of obtaining the issuer and its subsidiaries Turkey captured the market. (“Sok! Satilamayan HSBC” 2016) Bank return on equity(ROE) ratios which have seen the historic lows as of 2015, reducing investor appetite and create a shortage of funding and costs for banks.
Many international institutions with profit margins and increased risk due to uncertainty in global markets is to take the decision out of the low market. 4th largest bank among private banks in Turkey also considers in foreign partner banks to revise their position and foreign investment partner in Turkey until the sale of all shares of abatement or, if necessary. ("UniCredit Jumps as Bank” 2016)
In the Global Banking Survey report of Ernst & Young Global Limited, there is information on both Turkey and other countries involved in research in terms of stable banking system and customer experiences. The most important factor of customer confidence in financial activities "Financial Stability" that can be seen (60%). Then
came the important factors "of interest from customers" (56%) and "Cash Withdrawal Facility (54%) unless otherwise indicated. (EY 2015)
EY Report appeared in a multi-criteria under the Enterprise Reliability title after the 2001 crisis is already taking place in Turkey by increasing the supervisory and regulatory activities are fully supervised by institutions such as The Savings Deposit Insurance Fund (SDIF), BRSA, The Banks Association of Turkey (BAT), Participation Banks Association of Turkey (PBAT). This of course tightens regulation and supervision of the competition hall. Also in recent years; ATM partners, the development of tools available to the general use of independent banks as common POS, competitive salary corridor with regulations such as customers can receive their pensions are too narrow for private banks.
EY report also shows the importance of Quality of Opinion and Recommended" to customer. Without any doubt, before we can see here the impact of the new legislation referred to in the Cross-Selling titles.
Moreover, confidence in the banking sector, especially in Turkey, political intervention in the last 2-3 years, printing, as well as with the rumors in Turkey fell in parallel with the political and economic indicators it is an indisputable fact. Many credit rating agencies published regularly expresses this situation in the reports. (“S&P says Turkey's Bank” 2015) There are many articles written in both Turkey and abroad on interventions in banks. ("Why Erdogan’s attack on Bank" 2014) All these improvements result in participation to 87% decline in profitability occurred like equity compared to 2006 occurred in the banking group.
Bulgaria's First Investment recently dropped a rumor about the country in a difficult situation that occurs, the Bank put country in a difficult position and country and bank representatives asked help from European Commission. The government has stated that speculations that give damage to the country's stability. ("Bulgaristan’da karalama kampanyası" 2014)
27 affected by the case of Turkey in terms of sociological and political aspects. Though there are legislations to protect banks, even the last years’ applications overshadow the practices of banking sector. Many event related to banking have been experienced and it has been claimed that there are situations resulted in an intervention from government in some reports and articles.
In the light of all those, it could be said that there is a tough competitiveness atmosphere for banks in retail. Here banks should choose the most appropriate way to reach customers must acquire new customers. They must sell customers new products while maintaining existing customers. They should focus on profitability in a competitive environment and must be separated from their competitors positively.
4.2 Case Study
Aaron Knott, Andrew Hayes and Scott A. Neslin (2002), in their NPTB model study their statistical model, they were mailed to the customer group with the NPT and heuristic approaches The NPTB model outperforms it heuristic, especially in terms of response rate and 1.6 times better then heuristic. (Knott, A., Hayes, A., & Neslin, S. A 2002:66)
M. Tolga Akcura and Kannan Srinivasan (2005), in their cross-selling model study, they added information-risk coefficient. Because information risk cross-selling plays an important role in the optimal strategy. (Akçura, M. T. , & Srinivasan, K 2005:1009) Alexander Hesse (2009), in his case study for ING Bank, they tried to find offers which are not only alluring for customers, but also profitable for the bank. After calculating the expected return for each bid, ING Bank chose the best one for customers to the bank. (Hesse, A. 2009)
Vladimir K. Kaishev, Jens Perch Nielsen and Fredrik Thuring, they studied optimal selection of cross-sale prospects. And they tried to calculate cross-sales profit. (Kaishev, V. K., Nielsen, J. P., & Thuring, F. 2013)
In this thesis, a private bank's cross-selling strategy, which is also in the top 10 retail banking in Turkey were discussed. In order to increase the provision of customer
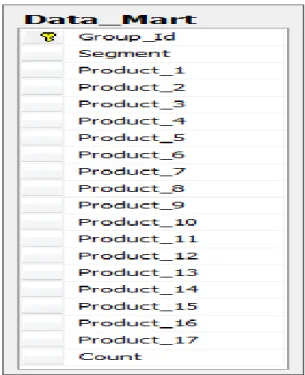
loyalty and profitability of the Bank, each year, Bank sets a target rate of cross-selling to itself. This target is followed in region / branch / portfolio basis. Instead of an active and aggressive methods for the realization of the given targets are followed more traditional methods. In today's environment it hardens the competitive environment, the bank wanted to leave positive from other banks, it is necessary to use an effective strategy. The Bank is willing to learn new strategies and experience in this field itself. In order to manage cross-selling existing bank information from one place DataMart for months about creating cross-selling at the end of each month. This data includes 9 million customers' information on over 70 products. It could be seen with this data that which customer has which product, active or not have it. Please refer to Table A.1 for raw data pattern. (Because of data protection product names are masked.)
This information is stored on the data as follows; 0: Customer do not have the product
1: Customer has the product but do not use it actively 2: Customer has product and use it actively
In line with the Bank's target of selling additional products to each customer, it wants to increase the cross-selling rate. Bank wants to know what products it should offer to each customer. To find this information, mainly in the same segments of customers which products are requested by the customer will be offered the preferred information to be used. But also the added value of the bank's products when proposals will be added to the calculation.
The yield of each product is not the same, it should be noted that the product actually creates a financial cost to the bank. Proposals in terms of cost is the same, when the customer gets discussed, the possibility of the same products with the products of the bank customers will be offered a maximum gain acquisition is willing to provide. It is a must to have a decision criterion actively in the model developed in this concept. Otherwise when the customer returns the product being offered less return / cost ratio will decrease. It is not allowed to offer customers lower products while they can provide greater returns with the same cost.
29 there could be an atmosphere that resulted in a loss of customers. The cost of short 2nd or subsequent offer will not be the same as the first proposal. Desired case can be made multiple offers for the same customer, but are required to be entered manually success factor for this. For example; the success rate for the first offer can be entered as 1.00, 0.5 for the second proposal, this ratio can be entered manually as 0.25 in the third proposal.
All this work is the most closely followed throughout the cross-selling and is considered rich with potential customers in terms of individual business units. The bank tries to find an answer to "in which the customer should buy the product, I provide statistical maximum benefit?" question and focus on it.
During the studies, individual business segment products are identified as first. 17 items selected for the individual business segments, for the data of about 3.2 million active retail customers are discussed cross-selling of these products. For each customer, 17, as well as knowledge of customer segments with products that information was included in the data. The bank has 3 segments at that time. Those are coded as 1, 2, and 3. The details of segment information will be described in the following pages. Also kept in the form of the amendment made to the product information and data made available to the infrastructure to be developed. These;
0: the product the customer is not active, 1: active products of customers.
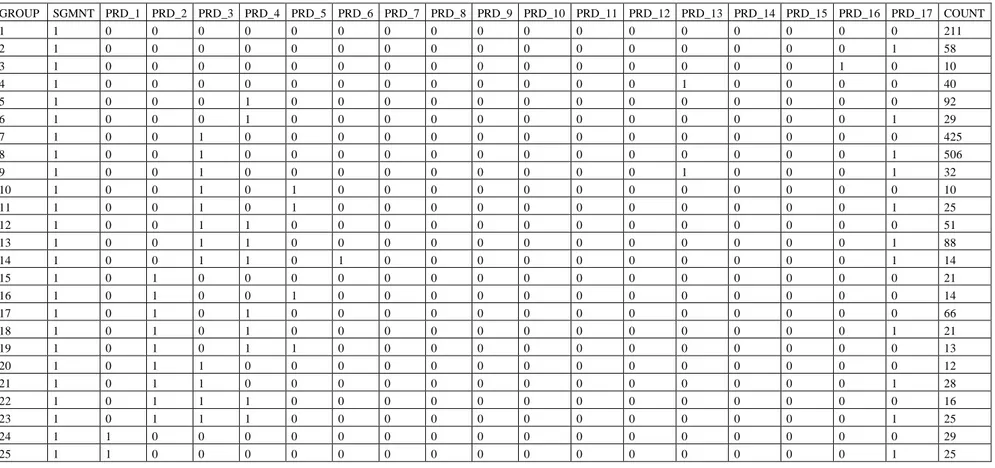
As a result we found 564 different customer groups. Please refer to Table A.2 for edited data by types of clients.
Figure 1.1 Table that was created for edited data by types of clients.
17 individual product discussed the customer activity is regulated by the appropriate product profitability information in the light of this criterion. Some products may correspond to more than one item profitability. Following this embodiment, segment information in the last one year in some profitability of products is discussed, this value is divided by 12. Thus, the monthly average reached profitability information for each product. Then we divide average profitability to the number of active customers. Thus, we found to products' yield for each customer segment. Please refer to Table A.3 and Table A.4 for counts of clients by products and the average yield for a customer's by products.
31 4.3 Segmentation Structure of Bank
Segmentation is created with participation of different branches of bank. Determining the appropriate segment of the banking business unit is responsible for managing and marketing strategy criteria. The CRM team with the removal of these strategies in the IT infrastructure and systems requirements, is responsible for planning and coded. It also provides for coordination with other IT departments if necessary.
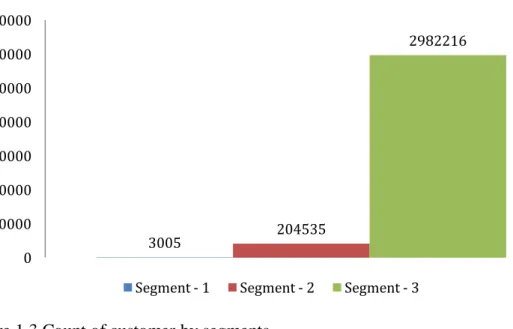
In line with the sectors management strategies, segment appointments are performed for individual business customers with the purpose of providing differentiated product and service. The assignment process is created for each month of the relevant month on a regular basis. There are three segments of individual businesses, these are: Segment-1, segment-2, segment-3
Figure 1.3 Count of customer by segments 4.3.1 Segment-1
In many banks there are virtual / artificial branches for special customers. Customers from other branches to be managed in such a way that the special would be difficult to follow in terms of customer satisfaction and in terms of the bank are monitored. Segment-1 criterion for customers who meet the following criteria in customers with active accounts in this particular branch is determined as segment-1.
Customers who open accounts in private banking branches
Making transactions in the relevant period, on forex or derivative products Related months as branch information "Retail Banking" and the registration status of
3005 204535 2982216 0 500000 1000000 1500000 2000000 2500000 3000000 3500000
active customers "segment-1" is assigned to the segment. 4.3.2 Segment-2
Related months branch "Retail Banking" and recording status and active segment "Segment-1" as the unmarked customers with the following hierarchy within "Segment-2" assignment is carried out. (Customer, what to mark the first item that fit the criteria.)
- Asset
Customers with Asset size of £ 100,000 and above - Credit
Opening amounting to 100,000TL and higher mortgage / loans or auto loans to customers with over 75,000TL
- Profession
Current profession upper / middle-level public administrators, doctors, pilots, lawyers, notaries and so on. Customers who are members of the executive branch.
4.3.3 Segment-3
Related months branch "Retail Banking", recording status and non-active segment "Private Banking" or "Segment-1" is unchecked customers.
4.4 Developed Probabilistic Model
As it is asked to understand which product should be sold to which customer, the possibility of customer's buying rate of the product is calculated. Various criteria could be added for minimum error probability in this approach. Given the available data of the bank, adding that the rate of account segmentation structure was found to be more accurate.
Each product for the Bank does not have the same value and importance. While finding the gain of every product, there is also a source separated for this product and a cost is formed. For this purpose, the product offers a return on product profitability while also considering models to be established whether the product is added. Again,
33 different criteria can be included in the calculation for minimum error. Bank segmentation breakdown is still used in the calculation of return products.
Model is assumed not repeat the same product sold to existing customers. It is also added to the model. Below model is established;
if customer j has i 1 else 0
Probability of selling product k assuming customer has product i
Average revenue of product k for each customer
if customer j buys product k 1 else 0 (decision variable)
Count of customers who have product i and k
Count of customers who have product i
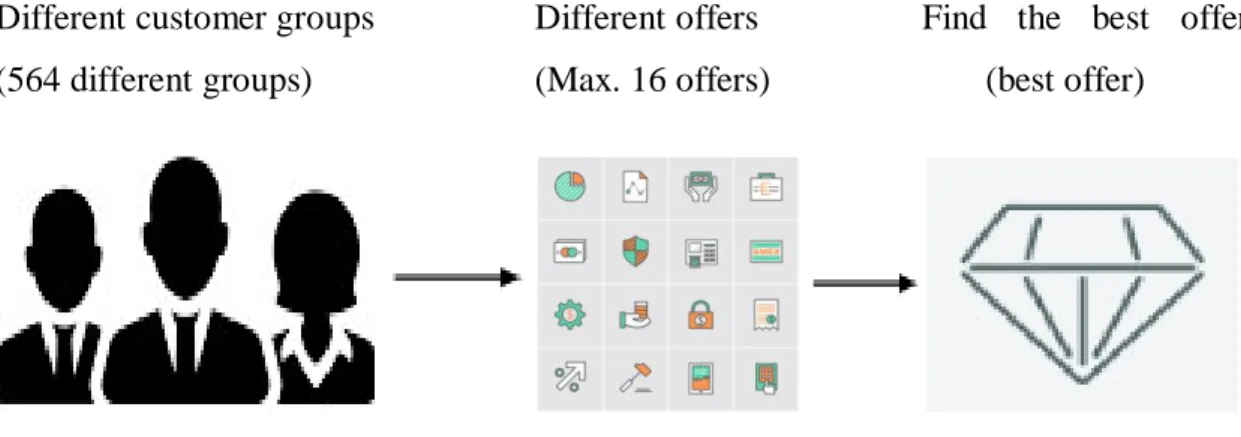
The application uses existing customers' data and products' average revenue to produce best offers for each customer groups.
Different customer groups Different offers Find the best offer (564 different groups) (Max. 16 offers) (best offer)
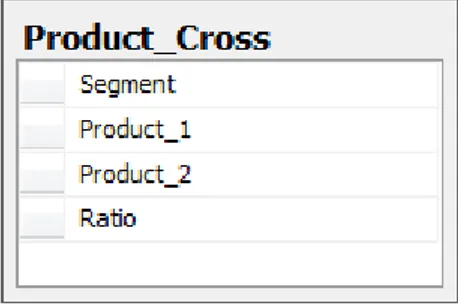
First established model was applied to the data. For every "i" product, the possibility of having "k" product and average profit information on "k" product is multiplied. Found results are inserted in “Product Cross" table. Please refer to table A.5 for example of composed data and A.6 for algorithm.
Figure 1.5 Table that was created for matrix of product ownership probability
Following this calculation for each row is calculated bid that may occur. This means that, offer value of every "k" product for every "i" product that customer has is inserted in "All Offer" table line. This table contains all the possible bid situations. Also during the calculation of the "k" with the average yield of the product multiplied by the number of customers at that line, "Calculated_Expected_Yield" field is calculated. This field indicates the size of the offer to be made to us in return. In this calculation was prepared with different offers over 22000. Please refer to table A.7 for example of all offer data and A.8 for algorithm.
Figure 1.6 Table that was created for all offer.
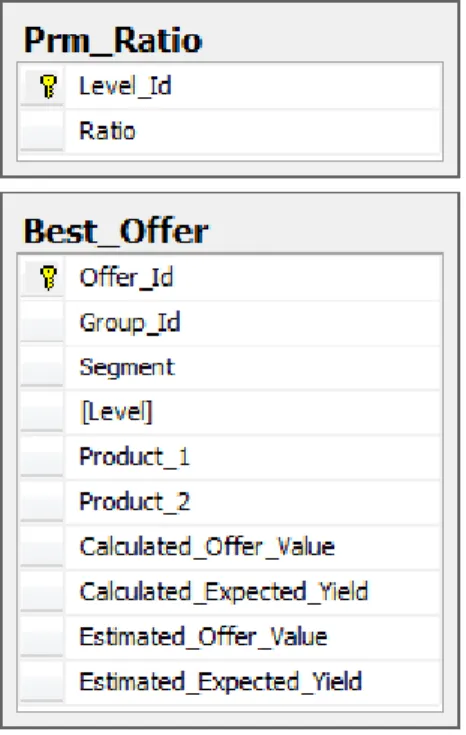
In the final stage, max bids or offers were calculated for each line. Parametrically from the user, for each line, the preparations of many bids are received information as required. In addition, the percentage of these proposals will be expected to occur
35 information. This information “Prm_Ratio” table is kept in. Expected realization percentage is meant to also offer cost. The results are inserted in "Best Offer” table. Please refer to table A.9 for example of best offer data and A.10 for algorithm.
Figure 1.7 Tables were created for all offer and parametric ratio.
Bank could see which product should be offered to which customer with the help of found results and simulate the expected yield. It is observed that "Segment-1" customers comes first in found data. Despite the small number in terms of return on the portfolio as they have high, those customers mean high value for banks. We can observe the reason of banks' focusing on those customers.
In addition to the results to determine how important target segmentation for banks has emerged again. How much enriched structure segmentation and data quality improved in the bank so banks will get better results.
In the calculations we prepare 3 offers for each customers group. We accepted when offer number increases for each group, the success rate drops. That’s why we set parameters like Figure 1.8.
Figure 1.8 Parameter table values
Looking at the results, Product_17 has never been observed in the best 3 bid list for a group. It's because few customers who have ownership of the product and return the product to the negative. (Table A.3) Also Product_10 and Product_15 have not been observed in the best 3 bid list for a group. It's because few customers who have ownership of the products. (Table 1.3 and Table A.4)
On the other hand credits, credit cards and demand&term deposit accounts are at the forefront in the offers. The reason of this is the density of customers in the products and yields of these products are better than others. These results also provide us with the general trend of the customers.
Offer diversity is limited in the lower segment of customers. Only 8 different products can be in best 3 offers for “Segment-1”. “Segment-2” is 12 and “Segment-1” is 11 for Table 1.3.
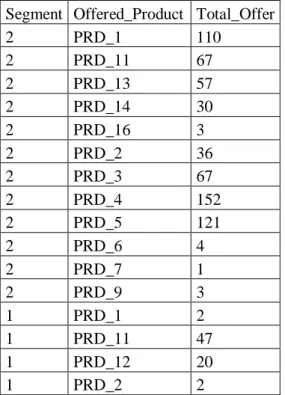
Table 1.3 Offered products and number of offers
Segment Offered_Product Total_Offer Segment Offered_Product Total_Offer
2 PRD_1 110 1 PRD_4 28 2 PRD_11 67 1 PRD_5 33 2 PRD_13 57 1 PRD_8 3 2 PRD_14 30 1 PRD_9 3 2 PRD_16 3 3 PRD_1 109 2 PRD_2 36 3 PRD_11 85 2 PRD_3 67 3 PRD_13 355 2 PRD_4 152 3 PRD_14 4 2 PRD_5 121 3 PRD_16 41 2 PRD_6 4 3 PRD_2 24 2 PRD_7 1 3 PRD_3 210 2 PRD_9 3 3 PRD_4 45 1 PRD_1 2 3 PRD_5 19 1 PRD_11 47 3 PRD_7 1 1 PRD_12 20 3 PRD_9 1 1 PRD_2 2
37
Chapter 5
5.1 Future Oriented Possible Developments
As future oriented approach, banks could keep the data of which product is bought in which line. Accordingly, banks will be able to offer more effective cross-selling offers to customers. Besides, customer segmentation could improve. Undoubtedly a stronger customer segmentation can be used effectively in cross-selling performance.
Existing products can be categorized (loans, deposits, insurance, etc.). The classification of the product after a separate checklist for each category can be created. For example; It is offered in the form of deposits on the accumulation of a certain amount of people with credit products.
This thesis has not research on the relationship between the scope of product channels. Cross-selling as a process in which we consider the many factors that play an active role, it will be inevitable inclusion of different parameters.
It is noticed that the bid costs could not be calculated exactly and it is noticed that infrastructure in the system could not be measured in the system. In addition, each bid can be successful by percentage system after the operation, a simulation can be performed better.
When all the checks carried out this development and is expected to increase the cross-selling performance.
5.2 Result
Consequently, it is desired to provide the maximum return with this model. Taking every product has a financial cost into account, the developed model is expected to contribute in yield/cost ratio. The model is composed of customer products, similar choices and product yields.
Periodic campaigns or target audience for the new cross selling could be identified. Customer list that is shortened and cleaned from unnecessary efforts could be reachable. Banks' prime targets and to be reached customers will be reached more quickly and that is important to Bank, so while both gaining yield, itis also be prevented that customer would not go to another bank to buy the product. All
models will be developed, which no doubt will move one step ahead of the bank in terms of competition.
In the preparation of this work leading to the telesales team at Bank, daily or periodically list of customers could play an active role. For example, tax payments are scheduled in the first and seventh month of the year in Turkey (MTV, rental income, etc.). In those periods, according to the model of customer data, there could be a bid via telesales or E-Mail for customers who have tax payment on top 3 products of the bank and customer.
39
References
[1] Goldberg, Harold. “10 Ways to Avoid CRM Pitfalls”, B to B, September 17, 2001.
[2] Gartner. 2009, Gartner Says Worldwide CRM Market Grew 12.5 Percent in
2008. 2009. Retrieved 13:15, May 3, 2016
http://www.gartner.com/newsroom/id/1074615
[3] Aydın, T. 2006. "Customer Relationship Management" undp-pff.org. Retrieved
13:35, May 1, 2016
http://www.undp-pff.org/index.php?option=com_docman&task=doc_view&gid=6.
[4] Odabaşı, Y. 2004. Satis ve pazarlamada musteri iliskileri yonetimi. Sistem Yayincilik.
[5] PEPPERS, Don; ROGERS, Martha; DORF, Bob. 1999 The one to one fieldbook: The complete toolkit for implementing a 1 to 1 marketing program. Crown Pub.
[6] 'Istenmeyen mesajlara' ceza yagdi. 2016. ntvpara.com. Retrieved 15:00, May 3, 2016 http://www.ntvpara.com/haber/istenmeyen-mesajlara-ceza-yagdi_42590. [7] 10 Years of Do Not Call Infographic. 2013 consumer.ftc.gov Retrieved 15:30,
May 3, 2016 https://www.consumer.ftc.gov/articles/0372-10-years-do-not-call-infographic
[8] Turkiye'deki ilk Cinli banka oldu. 2015. dunya.com. Retrieved 15:00, May 2, 2016 http://www.dunya.com/finans/bankacilik/turkiyedeki-ilk-cinli-banka-oldu-263314h.htm.
[9] Bank Of China'ya izin cikti. 2016. dunya.com. Retrieved 16:00, May 1, 2016 http://www.dunya.com/dunya/yabanci-sirketler/bank-of-chinaya-izin-cikti-298769h.htm.
[10] S&P: Turk bankalari daha fazla rekabetle karsi karsiya. 2016.
bloomberght.com. Retrieved 16:30, May 1, 2016
http://www.bloomberght.com/haberler/haber/1733923-s-p-turk-bankalari-daha-fazla-rekabet-ile-karsi-karsiya
[11] JCR/Okmen: ECB'nin politikaları Turk bankacilik sektorune yariyor. 2016.
fortuneturkey.com. Retrieved 17:00, May 2, 2016
http://www.fortuneturkey.com/jcr-okmen-ecbnin-politikalari-turk-bankacilik-sektorune-yariyor-27695
[12] Sok! Satilamayan HSBC Turkiye'de 180 sube kapatiyor. 2016. patronlardunyasi.com. Retrieved 17:30, May 2, 2016 http://www.patronlardunyasi.com/haber/Sok-Satilamayan-HSBC-Turkiye-de-180-sube-kapatiyor/177557
[13] HSBC Group. 2015. Annual Report and Accounts 2014. Retrieved 18:30, May
2, 2016
http://www.hsbc.com/~/media/hsbc- com/investorrelationsassets/annual-results-2014/hsbc-holdings-plc/annual-report-and-accounts-2014
[14] Bankalarda kârlilik tarihi dip seviyede! 2016. dunya.com. Retrieved 16:00, May 4, 2016 http://www.dunya.com/finans/bankacilik/bankalarda-karlilik-tarihi-dip-seviyede-289227h.htm
[15] UniCredit Jumps as Bank Said to Weigh Fineco Stake Sale. 2016.
bloomberg.com. Retrieved 18:30, May 20, 2016
http://www.bloomberg.com/news/articles/2016-05-19/unicredit-said-to-weigh-sale-of-fineco-stake-to-raise-capital
[16] EY. 2015. EY Global Consumer Banking Survey 2014. Retrieved 19:30, May 3, 2016 http://www.ey.com/Publication/vwLUAssets/EY_- _Global_Consumer_Banking_Survey_2014/$FILE/EY-Global-Consumer-Banking-Survey-2014.pdf
[17] S&P says Turkey's Bank Asya takeover shows political risk potential. 2015.
reuters.com. Retrieved 17:30, May 2, 2016
http://www.reuters.com/article/turkey-sp-asya-katilim-idUSL5N0W61BU20150304
[18] Why Erdogan’s attack on Bank Asya matters. 2014. euromoney.com.
Retrieved 17:30, May 3, 2016
http://www.euromoney.com/Article/3404326/Why-Erdogans-attack-on-Bank-Asya-matters.html
[19] Bulgaristan’da karalama kampanyasi bankacilik sektorune golge dusurdu. 2014. tr.euronews.com. Retrieved 17:30, May 5, 2016
http://tr.euronews.com/2014/06/30/bulgaristanda-karalama-kampanyasi-bankacilik-sektorune-golge-dusurdu/
[20] Knott, A., Hayes, A., & Neslin, S. A. 2002. “Next‐ product‐ to‐ buy models for cross‐ selling applications.” Journal of Interactive Marketing, 16(3): 59-75.
41 [21] Akçura, M. T. , & Srinivasan, K. (2005). “Research note: customer intimacy
and cross-selling strategy.” Management Science, 51(6): 1007-1012.
[22] Hesse, A. (2009). “Case study: ING delivers personalized product offers across channels in real time.” Best Practices in Multichannel Marketing, Sales, and Service Series.
[23] Kaishev, V. K., Nielsen, J. P., & Thuring, F. (2013). "Optimal customer selection for cross-selling of financial services products." Expert Systems with Applications, 40(5): 1748-1757.
Appendices
In this appendix, we give the detailed information about the case study problem taken from the literature. The information about which product is offered to which client groups. Also, other parameters regarding the product ownership, product revenues and cost of offer are all given in the tables below.
43 Table A.1 The raw data pattern
CLIENT SGMNT PRD_1 PRD_2 PRD_3 PRD_4 PRD_5 PRD_6 PRD_7 PRD_8 PRD_9 PRD_10 PRD_11 PRD_12 PRD_13 PRD_14 PRD_15 PRD_16 PRD_17 1 1 0 0 2 0 0 0 0 2 0 0 0 0 0 0 0 0 0 2 1 0 0 0 0 0 0 0 0 0 0 0 0 0 0 0 0 1 3 1 0 0 0 0 0 0 0 2 0 0 0 0 0 0 0 1 0 4 1 0 0 0 0 0 0 0 0 0 0 0 0 1 0 0 0 0 5 1 0 0 0 1 0 0 0 0 0 2 0 0 0 0 0 0 0 6 1 0 0 0 1 0 0 0 0 0 0 0 0 0 2 0 0 1 7 1 0 0 1 0 0 0 0 0 2 0 0 0 0 0 0 0 0 8 1 0 0 1 0 0 0 0 0 0 0 0 0 0 0 0 0 1 9 1 0 0 1 0 0 0 2 0 0 0 0 0 1 0 0 0 1 10 1 0 0 1 0 1 0 0 0 0 0 0 0 0 0 0 2 0 11 1 0 0 1 0 1 0 0 0 0 0 0 0 0 0 0 0 1 12 1 0 0 1 1 0 0 0 0 0 0 0 0 0 0 0 0 0 13 1 0 0 1 1 0 0 0 0 0 0 0 0 0 0 0 0 1 14 1 0 0 1 1 0 2 0 0 0 1 0 0 0 0 0 0 1 15 1 0 1 0 0 0 0 0 0 0 0 0 0 0 2 0 0 0 16 1 0 1 0 0 1 0 0 0 0 0 0 0 0 0 0 0 0 17 1 0 1 0 1 0 0 0 0 0 0 0 0 0 0 0 0 0 18 1 0 1 0 1 0 0 0 0 0 0 0 0 0 2 0 0 1 19 1 0 1 0 1 1 0 0 0 0 0 0 0 0 0 0 0 0 20 1 0 1 1 0 0 0 0 0 0 0 0 1 0 0 0 0 0 21 1 0 1 1 0 0 0 0 0 0 2 0 0 0 0 0 0 1 22 1 0 1 1 1 0 0 1 0 0 0 0 0 0 0 0 0 0 23 1 0 1 1 1 0 0 0 0 0 0 0 0 0 0 0 0 1 24 1 1 0 0 0 0 0 0 0 0 0 0 0 0 2 0 0 0 25 1 1 0 0 2 0 0 0 2 0 0 0 2 0 0 0 0 1
Table A.2 Edited data by type of clients GROUP SGMNT PRD_1 PRD_2 PRD_3 PRD_4 PRD_5 PRD_6 PRD_7 PRD_8 PRD_9 PRD_10 PRD_11 PRD_12 PRD_13 PRD_14 PRD_15 PRD_16 PRD_17 COUNT 1 1 0 0 0 0 0 0 0 0 0 0 0 0 0 0 0 0 0 211 2 1 0 0 0 0 0 0 0 0 0 0 0 0 0 0 0 0 1 58 3 1 0 0 0 0 0 0 0 0 0 0 0 0 0 0 0 1 0 10 4 1 0 0 0 0 0 0 0 0 0 0 0 0 1 0 0 0 0 40 5 1 0 0 0 1 0 0 0 0 0 0 0 0 0 0 0 0 0 92 6 1 0 0 0 1 0 0 0 0 0 0 0 0 0 0 0 0 1 29 7 1 0 0 1 0 0 0 0 0 0 0 0 0 0 0 0 0 0 425 8 1 0 0 1 0 0 0 0 0 0 0 0 0 0 0 0 0 1 506 9 1 0 0 1 0 0 0 0 0 0 0 0 0 1 0 0 0 1 32 10 1 0 0 1 0 1 0 0 0 0 0 0 0 0 0 0 0 0 10 11 1 0 0 1 0 1 0 0 0 0 0 0 0 0 0 0 0 1 25 12 1 0 0 1 1 0 0 0 0 0 0 0 0 0 0 0 0 0 51 13 1 0 0 1 1 0 0 0 0 0 0 0 0 0 0 0 0 1 88 14 1 0 0 1 1 0 1 0 0 0 0 0 0 0 0 0 0 1 14 15 1 0 1 0 0 0 0 0 0 0 0 0 0 0 0 0 0 0 21 16 1 0 1 0 0 1 0 0 0 0 0 0 0 0 0 0 0 0 14 17 1 0 1 0 1 0 0 0 0 0 0 0 0 0 0 0 0 0 66 18 1 0 1 0 1 0 0 0 0 0 0 0 0 0 0 0 0 1 21 19 1 0 1 0 1 1 0 0 0 0 0 0 0 0 0 0 0 0 13 20 1 0 1 1 0 0 0 0 0 0 0 0 0 0 0 0 0 0 12 21 1 0 1 1 0 0 0 0 0 0 0 0 0 0 0 0 0 1 28 22 1 0 1 1 1 0 0 0 0 0 0 0 0 0 0 0 0 0 16 23 1 0 1 1 1 0 0 0 0 0 0 0 0 0 0 0 0 1 25 24 1 1 0 0 0 0 0 0 0 0 0 0 0 0 0 0 0 0 29 25 1 1 0 0 0 0 0 0 0 0 0 0 0 0 0 0 0 1 25
45 Table A.3 Average yield for a customer's by products
PRODUCT SEGMENT AVERAGE_YIELD PRODUCT SEGMENT AVERAGE_YIELD PRODUCT SEGMENT AVERAGE_YIELD
PRD_1 1 495,93 PRD_1 2 67,44 PRD_1 3 11,14 PRD_2 1 649,29 PRD_2 2 181,05 PRD_2 3 21,74 PRD_3 1 23,48 PRD_3 2 48,78 PRD_3 3 22,81 PRD_4 1 2004,30 PRD_4 2 169,11 PRD_4 3 21,76 PRD_5 1 2920,82 PRD_5 2 266,36 PRD_5 3 37,91 PRD_6 1 0,00 PRD_6 2 215,15 PRD_6 3 29,67 PRD_7 1 0,00 PRD_7 2 160,70 PRD_7 3 7,85 PRD_8 1 17566,32 PRD_8 2 145,25 PRD_8 3 12,76 PRD_9 1 345,11 PRD_9 2 37,32 PRD_9 3 3,95 PRD_10 1 1082,54 PRD_10 2 109,45 PRD_10 3 32,59 PRD_11 1 7246,92 PRD_11 2 595,95 PRD_11 3 85,47 PRD_12 1 13966,31 PRD_12 2 0,00 PRD_12 3 0,00 PRD_13 1 0,00 PRD_13 2 106,21 PRD_13 3 31,46 PRD_14 1 0,00 PRD_14 2 117,53 PRD_14 3 28,92 PRD_15 1 0,00 PRD_15 2 131,06 PRD_15 3 27,32 PRD_16 1 0,00 PRD_16 2 22,75 PRD_16 3 6,37 PRD_17 1 0,00 PRD_17 2 0,00 PRD_17 3 -123,22
Table A.4 Count of customers by products
PRODUCT SEGMENT COUNT PRODUCT SEGMENT COUNT PRODUCT SEGMENT COUNT
PRD_1 1 1198 PRD_1 2 58482 PRD_1 3 595984 PRD_2 1 550 PRD_2 2 5631 PRD_2 3 20225 PRD_3 1 153 PRD_3 2 90380 PRD_3 3 786179 PRD_4 1 2284 PRD_4 2 27663 PRD_4 3 126267 PRD_5 1 786 PRD_5 2 6909 PRD_5 3 10598 PRD_6 1 0 PRD_6 2 303 PRD_6 3 1211 PRD_7 1 0 PRD_7 2 149 PRD_7 3 3635 PRD_8 1 37 PRD_8 2 4286 PRD_8 3 28235 PRD_9 1 1779 PRD_9 2 19712 PRD_9 3 106441 PRD_10 1 116 PRD_10 2 397 PRD_10 3 258 PRD_11 1 129 PRD_11 2 1455 PRD_11 3 5248 PRD_12 1 26 PRD_12 2 0 PRD_12 3 0 PRD_13 1 0 PRD_13 2 21638 PRD_13 3 706517 PRD_14 1 0 PRD_14 2 14680 PRD_14 3 38847 PRD_15 1 0 PRD_15 2 1444 PRD_15 3 6913 PRD_16 1 0 PRD_16 2 30598 PRD_16 3 641714 PRD_17 1 0 PRD_17 2 0 PRD_17 3 1252
47 Table A.5 Matrix of product ownership probability
SEGMENT PRODUCT_1 PRODUCT_2 RATIO
1 PRD_1 PRD_2 0.279 1 PRD_1 PRD_3 0.068 1 PRD_1 PRD_4 0.878 1 PRD_1 PRD_5 0.310 1 PRD_1 PRD_8 0.023 1 PRD_1 PRD_9 0.795 1 PRD_1 PRD_10 0.045 1 PRD_1 PRD_11 0.096 1 PRD_1 PRD_12 0.022 2 PRD_1 PRD_2 0.052 2 PRD_1 PRD_3 0.381 2 PRD_1 PRD_4 0.212 2 PRD_1 PRD_5 0.029 2 PRD_1 PRD_6 0.000 2 PRD_1 PRD_7 0.000 2 PRD_1 PRD_8 0.044 2 PRD_1 PRD_9 0.217 3 PRD_1 PRD_2 0.014 3 PRD_1 PRD_3 0.254 3 PRD_1 PRD_4 0.065 3 PRD_1 PRD_5 0.003 3 PRD_1 PRD_6 0.000 3 PRD_1 PRD_7 0.002 3 PRD_1 PRD_8 0.015 3 PRD_1 PRD_9 0.082
49 Table A.7 Example data for all offer
OFFER_ID GROUP_ID SEGMENT PRODUCT_1 PRODUCT_2 Calculated_Offer_Value Calculated_Expected_Yield
738 25 1 PRD_9 PRD_4 1.775,81 50.107,48 2212 62 2 PRD_16 PRD_14 26,56 4.701,04 4423 127 2 PRD_5 PRD_14 0,35 1.175,26 5160 147 2 PRD_2 PRD_14 4,47 10.694,87 5897 166 2 PRD_1 PRD_4 35,85 14.882,03 7371 198 2 PRD_9 PRD_16 2,18 58.530,60 8108 213 2 PRD_3 PRD_15 0,52 1.310,55 8845 227 2 PRD_4 PRD_13 4,25 2.230,31 11056 272 3 PRD_8 PRD_5 0,08 530,74 11793 298 3 PRD_16 PRD_14 0,81 51.822,85 12530 321 3 PRD_16 PRD_1 2,59 1.493,16 13267 341 3 PRD_11 PRD_9 0,17 86,83 14004 366 3 PRD_4 PRD_8 0,09 22.124,11 14741 385 3 PRD_4 PRD_11 0,51 940,17 15478 407 3 PRD_2 PRD_5 3,34 492,83 16215 428 3 PRD_3 PRD_5 0,04 24.527,77 16952 446 3 PRD_3 PRD_2 0,04 1.673,90 17689 464 3 PRD_1 PRD_2 0,30 693.104,54 18426 479 3 PRD_1 PRD_13 7,77 2.233,80 19163 498 3 PRD_1 PRD_15 0,06 655,75 19900 513 3 PRD_13 PRD_14 0,03 6.622,45 20637 530 3 PRD_2 PRD_5 3,34 417,01 21374 545 3 PRD_16 PRD_14 0,81 4.222,17 22111 560 3 PRD_3 PRD_13 8,97 1.352,87
51 Table A.9 Example data for best offer
OFFER_ID GROUP_ID SEGMENT PRODUCT_1 PRODUCT_2 Calculated_Offer_Value Calculated_Expected_Yield Estimated_Offer_Value Estimated_Expected_Yield
4 2 1 PRD_9 PRD_4 1775.809 116249.342 1775.809 116249.342 5 2 1 PRD_9 PRD_5 800.304 169407.502 400.152 84703.751 10 2 1 PRD_9 PRD_11 471.050 420321.476 117.763 105080.815 1137 34 1 PRD_5 PRD_11 1188.495 326111.490 1188.495 326111.490 1111 34 1 PRD_1 PRD_11 695.705 326111.490 347.853 163055.979 1150 34 1 PRD_9 PRD_11 471.050 326111.490 117.763 81528.219 1371 39 1 PRD_9 PRD_4 1775.809 60128.970 1775.809 60128.970 1332 39 1 PRD_1 PRD_4 1759.775 60128.970 879.888 30064.502 7640 204 2 PRD_4 PRD_5 26.636 9056.070 26.636 9056.070 7634 204 2 PRD_3 PRD_13 14.019 3610.970 7.010 1805.614 7656 204 2 PRD_8 PRD_9 13.508 1268.710 3.377 317.178 5081 145 2 PRD_5 PRD_4 67.984 9639.498 67.984 9639.498 5095 145 2 PRD_11 PRD_4 61.896 9639.498 30.948 4819.749 5093 145 2 PRD_11 PRD_1 48.217 3843.909 12.054 960.957 10582 260 2 PRD_2 PRD_11 122.170 53039.461 122.170 53039.461 10608 260 2 PRD_5 PRD_11 41.716 53039.461 20.858 26519.731 12969 332 3 PRD_13 PRD_3 7.230 7731.912 7.230 7731.912 12983 332 3 PRD_14 PRD_3 3.923 7731.912 1.962 3866.941 12981 332 3 PRD_14 PRD_1 3.889 3777.477 0.972 944.126 17203 452 3 PRD_9 PRD_13 9.690 818.012 9.690 818.012 17191 452 3 PRD_3 PRD_13 8.967 818.012 4.484 409.052 17179 452 3 PRD_1 PRD_13 7.771 818.012 1.943 204.529 18483 480 3 PRD_11 PRD_2 15.109 543.475 15.109 543.475 18478 480 3 PRD_3 PRD_13 8.967 786.550 4.484 393.319