INTEGRATED SUPPLY CHAIN AND COMPETITIVE FACILITY LOCATION
MODELS
Canser Bilir
1, Sule Onsel Ekici
2Abstract - The optimization of supply chain networks plays a key role in determining the competitiveness of the whole supply chain. Therefore, during the last two decades, an increasing number of studies have focused on the optimization of the overall supply chain network. However, in most of these optimization studies, the structure of the network is considerably simplified and there is still a need for more comprehensive models that simultaneously capture many aspects that are relevant to real-world problems such as demand dynamics on the market. Facility location decisions—more specifically, decisions on the physical network structure of a supply chain network— are important factors affecting chain’s competitiveness, especially for the supply chains serving retail markets. However, supply chain network optimization models in the current literature ignore the impacts of network decisions on customer demand. Nevertheless, competitive facility location problems model only the distribution part of the supply chain, even though they have certain characteristics of supply chain networks and analyze the rival chains existing on the market. In this study, an integrated supply chain network optimization model based on the joint supply chain network optimization and competitive facility location models is proposed to analyze the results of ignoring the impacts of network decisions on customer demand. The unique unknown variable within the model is the demand. The demand at each customer zone is assumed to be determined by price and the utility function. The utility function is defined as the availability of same-day transportation from the distribution center to the customer zone.
I.
INTRODUCTION
The optimization of SC networks plays a key role in determining the competitiveness of the whole SC. Therefore, during the last two decades, an increasing number of studies have focused on the optimization of the overall SC network. However, in most of these optimization studies, the structure of the SC network is considerably simplified (e.g., a single product and a single location layer are usually assumed), and there is still a need for more comprehensive models that simultaneously capture many aspects that are relevant to real-world problems such as demand dynamics on the market.
Facility location decisions—more specifically, decisions on the physical network structure of a SC network—are important factors affecting chain’s competitiveness, especially for the SCs serving retail markets. However, SC network optimization models in the current literature ignore the impacts of SC network decisions on customer demand. Nevertheless, competitive facility location problems model only the distribution part of the SC, even though they have certain characteristics of SC networks and analyse the rival chains existing on the market (Bilir et al., 2015).
In this study, a new model has been proposed in which the concept of SC network optimization modelling is incorporated with competitive facility location factors (e.g., changing demands that are dependent not only on price but also on customer service related functions). The aim of this model is to include the impact of a SC’s physical network structure on customer demand.
The remainder of the paper is organized as follows: the next section provides a brief literature review. Section 3 defines a real-world problem to which the proposed model is applied. Section 4 focuses on the proposed model and its objectives, variables, and parameters. The paper ends with final conclusions of the study and provides further research suggestions.
1 Istanbul S. Zaim University, Industrial Engineering Department, Halkali Cd. Kucukcekmece, 34303, Istanbul, [email protected] 2 Dogus University, Engineering Faculty, Industrial Engineering, Zeamet Sok., No:21 Kadikoy , 34722, Istanbul [email protected]
© XIV. International Logistics and Supply Chain Congress
II.
LITERATURE REVIEW
In order to identify different characteristics of the various models and common trends, we conducted a comprehensive literature review of recently developed (from 2009 to 2013) SC network optimization models. In this review, our focus was on identifying studies that included a strategic-level SCN model. Models that considered the reconfiguration or relocation of the SCN nodes and arcs (0-1 decisions) are considered as strategic-level models.
Supply chains are dynamic networks consisting of multiple transaction points with complex transportation, information transactions and financial transactions between entities. Therefore, SC modelling involves several conflicting objectives, at both the individual entity and SC levels. Our survey on SC network model objectives showed that the majority of SC network optimization models are solely based on cost minimization (e.g., Nagurney & Nagurney, 2012; Lundin, 2012; Melo et al., 2012) or profit maximization objectives (e.g., Kabak & Ulengin, 2011; Rezapour & Farahani, 2010; Yamada et al., 2011), even though the number of multi-objective models is increasing and there appears to have been a major shift from cost minimization to profit maximization objectives (Bilir et al., 2015).
Indeed, 24 % of studies in the SC literature from 2009 to 2014 feature multi-objective functions. When compared to 9 % of the articles reviewed by Melo et al. (2009), it can be concluded that multi-objective models are becoming increasingly popular. Multi-objective models typically include a cost minimization or profit maximization function, together with customer service, environmental effects or risk mitigation related objectives (e.g., Olivares-Benitez et al., 2013; Shankar et al. 2013; Akgul et al., 2012; Prakash et al., 2012).
The existence of competition within the market (both among firms and via other SCs providing the same or substitutable goods) is an important factor that must be considered when designing a SC network.
The literature survey that we have conducted regarding competition modelling for SCs identified only seven papers (Nagurney, 2010a; Nagurney & Yu, 2012; Masoumi et al., 2012; Yu & Nagurney, 2013; Zamarripa et al., 2012; Rezapour & Farahani, 2010; Rezapour et al., 2011) explicitly modelling competition within the market. Among these papers, the demand is simultaneously modelled as a function of both the retailer’s and the competitor’s price (oligopolistic competition). These authors developed an equilibrium model to design a centralized SC network operating in markets under deterministic price-dependent demands and with a rival SC present. The competing chains provide products, either identical or highly substitutable, that compete for participating retailer markets. Using this approach, the authors were able to model the joint optimizing behaviour of these chains, derive the equilibrium conditions, and establish and solve the finite-dimensional variational inequality formulation. In six other models (Yamada et al., 2011; Cruz et al., 2011; Cruz, 2009; Amaro & Barbosa—Póvoa, 2009; Meng et al., 2009; Yang et al., 2009), demand is modelled as a function of only the retailer’s price. Only one study modelled demand as a function of selected marketing policy (e.g., inventory-based replenishment policy, made-to-order policy or vendor managed inventory policy) (Carle et al., 2012). None of the reviewed papers included customer service related factors—or, more specifically, the location or number of SC network points—in their demand models. However, the physical network structure of a SC clearly influences its performance and is an important factor that affects a chain’s competitiveness, especially for retail markets. SC risk management is also an important part of SC network configuration and optimization. SC risk management involves designing a robust SC network structure and managing the product flow throughout the configured network in a manner that enables the SC to predict and address disruptions (Baghalian et al., 2013). The uncertainties associated with disruptive events such as heavy rain, excessive wind, accidents, strikes and fires may dramatically interrupt normal operations in SCs. Hendricks and Singhal (2005) quantified the negative effect of
SC disruptions on long-term financial performance (e.g., profitability, operating income, sales, assets and inventories).
In the literature survey, nine models (Cruz et al., 2011; Baghalian et al., 2013; Lundin, 2012; Yu and Nagurney, 2013; Cruz, 2009; Masoumi et al., 2012; Bassett and Gardner, 2010; Pan and Nagi, 2010; Kumar and Tiwari, 2013) explicitly included SC risk modelling (defined as SC robustness or SC risk models). In those models, the robustness of the models is quantified in SC risk equations to identify how it changes through the changes in the SC network.
A careful analysis of the SC network modelling literature finds that almost all SC network models assume that customer demands (either deterministic or stochastic) are not substantially influenced by the configuration of the SC network itself. However, the physical network structure of a SC clearly influences its performance and is one of the most important factors affecting a SC’s competitiveness, especially for SCs serving retail markets. This disconnect between models and reality represents a gap in the literature and an opportunity for future research. In this paper, the main objective is the integration of competitive facility location factors (e.g., changing demands dependent not only on price but also on customer service related functions) into SC network optimization model. As SC networks are multi-objective in nature, we define our model as multi-objective. Such multiple objectives might include profit maximization, sales maximization and SC risk minimization. Cost minimization and profit maximization are traditional objectives in SC network optimization problems. Sales maximization may also be utilized within the competitive facility location modelling framework as companies aim to increase (or at least maintain) their sales by reconfiguration of their SC network and possibly by adding new SC network point(s) (Plastria, 2001). The third objective proposed in the multi-objective framework is a risk minimization function. As SC risks have significant effects on the long- and short-term operational and financial performance of the SC (Hendricks and Singhal 2005), strategic-level SC network decisions should be modelled with a risk metric to help understand how network decisions influence SC risks.
The principal contribution of the proposed direction for future SC network optimization model research is the improved modelling of demands, which are affected by the price and service characteristics of SCs. The price and service, in turn, are substantially influenced by strategic-level SC network model decisions. As a second contribution of the proposed framework, SC risk will be included in modelling strategic-level SC decisions. Among the many published multi-objective SC network optimization models, only a few include SC risks as an objective.
© XIV. International Logistics and Supply Chain Congress
III.
MODEL DEFINITION
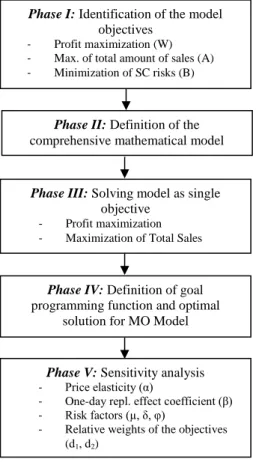
In this research, the model is built as deterministic MILP with three echelon SC networks, with multiple products and a single period. The objectives of the model are to optimize SC configuration and to analyse how the location and number of DCs will influence SC performance metrics. The demand at each customer zone is assumed to be determined by the price and the utility function defined as DC-one day transportation coverage availability. The SC structure consists of three echelons: (1) Suppliers, (2) Distribution Centres (DC), and (3) Customer Zones. Figure 1 summarizes our methodology on the definition and the analysis of the proposed model.
In Phase I, three objectives of the model are identified; profit maximization, maximization of total sales (Plastria, 2001) and SC risk minimization (Hendricks and Singhal 2005). Phase II defines the mathematical model which integrates the concept of the competitive facility location model into SC Network optimization models. The details of the proposed model may be found under “model overview” section. Phase III provides the results of the models defined as single objective separately for profit maximization, sales maximization, and risk minimization. Meanwhile, phase IV involves a multi-objective optimization model which is constructed and solved to compare with the results of single objective models. In that phase, goal programming algorithm is utilized to solve the multi-objectivity. In the last phase, a sensitivity analysis has been conducted to test the applicability of the model with respect to various parameter coefficients; price elasticity, one– day replenishment coverage impact, risk factors (disruption probabilities), relative weights of the objectives.
3.1. Model Overview
Model Objectives: The proposed model has three objectives. The first objective is the maximization of the total profits. The second objective is the maximization of the total amount of sales, which are dependent on the price and the distance between the DC and the customer zone. Sales volume is not calculated as the sum of the total products distributed to customer zones, as the model may choose not to fill some of the demand when it is not profitable. The third objective of the proposed model is the minimization of SC risks.
Decision Variables: There several decision variables that need to be determined: Number of DCs and their locations
Capacity of each DC
The inbound and outbound traffic network DC – customer zone allocation
Demand fill rate
Demand Function: In the SC network modelling literature, demand is generally either defined as deterministic or defined as a product of price. As the main purpose of the present study is to prove that adding a utility (attraction) function, which is also affected by strategic level SC decisions, to the demand model may have
Phase I: Identification of the model
objectives - Profit maximization (W) - Max. of total amount of sales (A) - Minimization of SC risks (B)
Phase II: Definition of the
comprehensive mathematical model
Phase III: Solving model as single
objective - Profit maximization - Maximization of Total Sales
Phase IV: Definition of goal
programming function and optimal solution for MO Model
Phase V: Sensitivity analysis
- Price elasticity (α)
- One-day repl. effect coefficient (β) - Risk factors (µ, δ, φ)
- Relative weights of the objectives (d1, d2)
Figure 1. Methodology on the definition and analysis of the
substantial influence on SC network optimization decisions, the demand model is built to include both price elasticity and utility function. Demand is defined as the product of both the sales price and the responsiveness of the SC network in terms of the distance between the DC and customer zones. In this study, the demand function includes two independent variables:
Demand to Price elasticity coefficient (α);
Availability of the one–day replenishment coverage affect (β); it is assumed that if the distance between the DC and retail outlet is less than a specified distance, the right product will be provided from the DC in one day. Therefore, this availability will have a positive impact on the sales of the products by a predefined coefficient (β).
Risk Function: To formulate SC risks, a path-based formulation, as proposed by Baghalian et al. (2013), is utilized. In path-based formulation, possible disruptions in DCs (DC operations), inbound and outbound connecting links (transportation links) are considered and formulated as the probability of disruption occurrence in SC network nodes and links. Path-based formulation helps the analyser to visualize the effects of partial disruption cases.
Predetermined probabilities of disruptions at DCs (DC operations), inbound and outbound connecting links (transportation links) are formulated in risk value calculations. According to path-based supply side risk calculation, the SC risk value of one DC network (current network) is calculated as follows:
SC risk value = (1-µ)*(1-δ)*(1-φ) = 0,995*0,99*0,98=0,965 (1)
The first term in the formulation (µ) is the probability of transporting the required goods to the DC without any disruptions from suppliers. µ assumed to be 0.5 % in the base scenario. The second term in the formulation (δ) is the probability of handling goods at the DC without any disruptions. δ is assumed to be 1 % in the base scenario. The third term in the formulation (φ) is the probability of transporting the required goods from the current DC to customer zones without any disruptions. φ is assumed to be 2 % in the base scenario. If more than one DC is utilized within the SC network, the probability of disruption occurrences at each node and link is assumed to be same. However, the disruption occurs at the SC network only if all alternatives at any single node or echelon are disrupted.
Disruption costs: When the SC network does not operate due to disruptions, there will also be a loss of sales. Therefore, shortage costs for each product type are also defined in the model. Shortage costs are defined as the net difference between the sales price and the unit cost of the product. Disruption costs are calculated as the total sales times the disruption probability of the whole SC network multiplied by shortage costs.
3.2. Notations and Formulation for the Model
Indices i Products, i=1,……….I j Product suppliers, j=1,……….J k Distribution centres, k=1,……….K z Customer zones, z=1,………Z m Number of DCs, m=1,………M n Alternative cities, n=1,…….N© XIV. International Logistics and Supply Chain Congress
Inputs
Fk Fixed costs for DC k
Ck Capacity for DC k
TIijk Inbound transportation costs for product (i) from supplier (j) to DC (k)
TOikz Outbound transportation costs for product (i) from DC (k) to customer zone (z)
ICmi Inventory costs per item in case of m DC(s)
Ui Unit purchasing cost of the product (i)
Si Shortage cost of the product (i)
SRij Supply rate for the product i from supplier j
α Price elasticity coefficient
β One-day replenishment coverage area elasticity coefficient
µ Probability of disruption at the transportation link from suppliers to DC(s). δ Probability of disruption at handling goods at DC(s).
φ Probability of disruption at the transportation link from DC(s) to customer zones P0i Base (current) price of product (i)
DCKkz “1” if the distance between DC k and customer zone z is less than 600 km; otherwise, “0”
D0iz Current demand of product (i) at customer zone (z)
DCnk “1” if DC k is at city n; otherwise, “0”
Outputs - Decision Variables
Xikz Total amount of product i distributed from DC k to customer zone z
Yijk Total amount of product i distributed from supplier j to DC k
Diz Demand of product i at customer zone z
TIC Total cost of inventory (changes depending on the total amount of sales and the number of DCs within the SC network)
LS Total lost sales LSC Total lost sales costs W Total profit
A Total amount of sales B SC risk value
Binary Variables
DCk “1” if DC i is open; otherwise, “0”
DCSkz “1” if DC k serves customer zone z; otherwise, “0”
Om “1” if only m number of DC(s) is / are open; otherwise, “0”
Objective 1: Maximization of total profit
𝑊 = [(∑ 𝑃𝑖∗ ∑ (𝑋𝑖𝑘𝑧𝑘𝑧 ) − 𝐿𝑆𝐶] 𝑖 ] − [∑ (∑ (𝑋𝑖𝑘𝑧 ) ∗ 𝑈𝑖) 𝑘𝑧 𝑖 ] + [∑ (𝑌𝑖𝑗𝑘 𝑖𝑗𝑘) ∗ (𝑇𝐼𝑖𝑗𝑘) ] + [ ∑𝑖𝑘𝑧(𝑋𝑖𝑘𝑧) ∗ (𝑇𝑂𝑖𝑘𝑧)] + [∑ (𝐹𝑘 𝑘) ∗ (𝐷𝐶𝑘)] + [𝑇𝐼𝐶] (2)
Objective 2: Maximization of total amount of sales
𝐴 = ∑(𝑋𝑖𝑘𝑧) 𝑖𝑘𝑧
− 𝐿𝑆 (3)
𝐵 = ∑(1 − µ𝑚) ∗ (1 − δ𝑚) ∗ (1 − φ𝑚) ∗ S𝑚 (4) 𝑚 Subject to: 𝐷𝑖𝑧= 𝐷0𝑖𝑧+ 𝛼 ∗ [(𝑃𝑖− 𝑃0𝑖) ∗ 𝐷0𝑖𝑧 𝑃0𝑖 + 𝛽 ∗ ∑ 𝐷𝐶𝑆𝑘𝑧∗ 𝐷𝐶𝐾𝑘𝑧∗ 𝑘 𝐷0𝑖𝑧 ∀ 𝑖, 𝑧 (5) ∑ 𝑌𝑖𝑗𝑘 ≤ ∑ 𝑋𝑖𝑘𝑧 𝑧 𝑗 ∀ 𝑖, 𝑘 (6) ∑ 𝑋𝑖𝑘𝑧∗ 𝐷𝐶𝑆𝑘𝑧 𝑘 ≤ 𝐷𝑖𝑧 ∀ 𝑖, 𝑧 (7) ∑ 𝑌𝑖𝑗𝑘 𝑘 = ∑ 𝑋𝑖𝑘𝑧 𝑘𝑧 ∗ 𝑆𝑅𝑖𝑗 ∀ 𝑖, 𝑗 (8) ∑ 𝑌𝑖𝑗𝑘 𝑖𝑗 ≤ 𝐷𝐶𝑘∗ 𝐶𝑘 ∀ 𝑘 (9) ∑ 𝐷𝐶𝑆𝑘𝑧 𝑘 = 1 ∀ 𝑧 (10) 𝑋𝑖𝑘𝑧 ≤ 𝐷𝐶𝑆𝑘𝑧∗ 100000000 ∀ 𝑖, 𝑘, 𝑧 (11) ∑ 𝐷𝐶𝑘 𝑘 = ∑ 𝑂𝑚∗ 𝑚 𝑚 (12) ∑ 𝑂𝑚= 1 𝑚 (13) ∑(∑ 𝑋𝑖𝑘𝑧 𝑘𝑧 ∗ 𝐼𝐶𝑚𝑖 𝑖 ) − 𝑇𝐼𝐶 ≤ 1000000000 ∗ (1 − 𝑆𝑚) ∀ 𝑚 (14) [(∑ 𝑆𝑖∑ 𝑋𝑖𝑘𝑧 𝑘𝑧 ) ∗ (1 − µ𝑚) ∗ (1 − δ𝑚) ∗ (1 − φ𝑚)] − 𝐿𝑆𝐶 ≤1000000000 ∗(1 − 𝑆 𝑚) ∀ 𝑚 (15) 𝑖 [∑ 𝑋𝑖𝑘𝑧∗ (1 − µ𝑚) ∗ (1 − δ𝑚) ∗ (1 − φ𝑚)] − 𝐿𝑆 ≤1000000000 ∗(1 − 𝑆𝑚) ∀ 𝑚 (16) 𝑖𝑘𝑧 ∑ 𝐷𝐶𝑛𝑘∗ 𝐷𝐶𝑘 ≤ 1 ∀ 𝑛 (17) 𝑘 𝑋𝑖𝑘𝑧 , 𝑌𝑖𝑗𝑘 , 𝐷𝑖𝑧 ≥ 0 ∀ 𝑖, 𝑗, 𝑘, 𝑧 (18) 𝐷𝐶𝑘 , 𝐷𝐶𝑆𝑘𝑧 , 𝑂𝑚 = 0 𝑜𝑟 1 ∀ 𝑘, 𝑧, 𝑚 (19)
The first objective function (W) (equation 3) maximizes total profit and is divided into five components: (1) Total revenue excluding lost sales, (2) Total purchasing costs, (3) Total inbound transportation costs from suppliers to DCs, (4) Total outbound transportation costs from DCs to customer zones, (4) Fixed costs associated with DC operations, and (5) Total inventory costs.
The second objective function (A) (equation 4) maximizes total amount of sales excluding total lost sales due to disruptions. The third objective function (B) (equation 5) maximizes SC risk value, which is a function of disruption probabilities at SC nodes and links.
Equations 6 – 18 of the model represent the following:
Eq. 6 specifies the demand for each customer zone for each product.
Eq. 7 ensures that any product transferred to a customer zone goes through a DC .
Eq. 8 ensures that the total amount of products sold at each customer zone is less than the demand at that point for a specific product.
Eq. 9 matches products sold at customer zones to supplied products.
© XIV. International Logistics and Supply Chain Congress
Eq. 11 and 12 ensures that each customer zone is served by only one DC. Eq. 13 and 14 specify the number of DCs utilized within the model.
Eq. 15 calculates “Total inventory costs” based on the number of DCs utilized within the model. In the calculation, the required Customer Service Level is assumed to be 99 %.
Eq. 16 calculates “Lost sales costs” based on disruption probabilities and the number of DCs utilized within the model.
Eq. 17 calculates “Lost sales” based on disruption probabilities and the number of DCs utilized within the model.
Eq. 18 ensures that a maximum of one DC is utilized at each city. Eq. 19 ensures non-negativity for all variables.
IV.
PROBLEM DEFINITION FOR A REAL–WORLD SCENARIO
XYZ Group Company is one of the leading ready-to-wear clothing companies primarily based in Turkey. The company has approximately 150 retail stores throughout Turkey, including 3 multi-storey mega stores and over 500 sales points. The firm is one of Turkey’s first 500 Big Industrial Organizations in terms of sales volume, number of employees, and other factors.
The company currently has only one DC in Istanbul. That DC supports all sales points throughout Turkey. However, the number of sales points and the company’s total amount of sales increased sharply in recent years. It is considered that the firm needs to reconfigure its SC network and to decide whether to open additional DC(s) in alternative locations, such as İzmir or Ankara. In the case of opening a new DC, the firm also needs to decide on the capacity of the new DC.
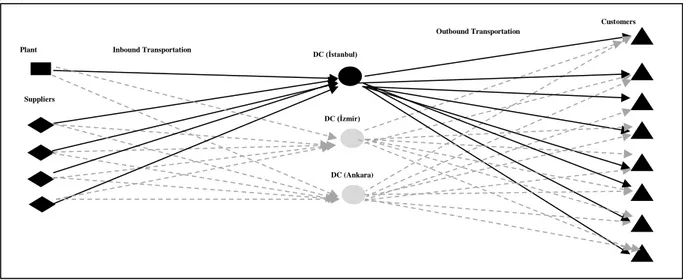
The company’s current SC structure is composed of three echelons. Figure 2 depicts the current network of the company:
Figure 2. Current SC Network of XYZ Company
Customer zones are spread throughout Turkey. The company has 209 retail outlets. The demand for the retail outlets is aggregated to 39 city locations. The company has an enormous number of SKU to provide to the customer zones. To simplify the model, SKU are aggregated to represent the company’s entire product composition. In the current SC network, only some of the stores are provided the right product within one day. If the distance between the DC and the retail outlet is less than 600 kilometres the right product will be provided from the DC in one day.
V.
CONCLUSIONS AND FURTHER RESEARCH SUGGESTIONS
This study aims to analyse and explore how strategic level SC network decisions, such as number, location, and capacity of SC nodes affect sales volume and, ultimately, strategic level SC network decisions. The developed model is the first SC network optimization model to incorporate the changes in demand, which is defined as being subject to both the price change and distance from the end-customers and which is substantially influenced by strategic level SC network optimization model decisions. The results prove that including a utility function (based on the number and the location of DCs) in demand substantially changes the value of all three performance objectives of the model. When the model proposes opening an additional DC, it generates approximately 5 % more sales volume due to the defined utility function. However, the model generates less profit due to the fixed DC costs, slightly increased inventory holding costs, and slightly increased transportation costs.
Suppliers Customers Outbound Transportation DC (Ankara) DC (İzmir) DC (İstanbul) Plant Inbound Transportation
© XIV. International Logistics and Supply Chain Congress
The model also proves that single objective models may not generate acceptable results and that SC network optimization models need to be defined as multi-objective, as SCs are multi-objective in nature.
The model results also show that the model’s performance objectives are substantially influenced by strategic level SC network decisions such as the number and location of DCs, price change level, and other factors, which have a substantial influence on all performance objectives. However, decisions such as SC network traffic decisions, DC – customer zone allocation, and demand fill rate have either minor or no influence on performance of the SC.
The model is also utilized to model SC disruption risks. The risk factor sensitivity analysis shows that controlling and lowering disruption probabilities as much as possible through SC nodes and links is crucial for the company’s success, as lower disruption probabilities may lead to lower risks, higher sales volume, and higher profitability, all of which are very important to serving customers without interruption.
To enhance the developed model, other utility (attraction) functions that are also influenced by SC network configuration decisions—such as customer service level, availability of the stores at the demand point, distance between the store and the customers—may be defined to explore how demand and, ultimately, network configurations are influenced by those decisions.
A major limitation of the study concerns the lack of research on several major parameters of the model, such as the price elasticity coefficient and the DC – customer zone one-day replenishment coverage effect coefficient. After a more deliberate study of price elasticity in the market and after implementing the one-day replenishment program, the study may be rerun with the real data gathered from the market on those coefficients.
To explore the usefulness of the model, it may also be applied to real-world scenarios from other highly competitive sectors such as food products, electronic products. The SC network of the model firm only consisted of three echelons. Defining a more complex SC network with more than three echelons and possibly including recycling centres, globalization issues, and other factors may also enhance the usefulness of the model.
In the proposed model, a simple, linear demand model that includes price elasticity and utility function is defined for the sake of simplicity. A more complex demand model may be defined to analyse how SC network optimization decisions and model objectives change. Again, to simplify the model, only supply side path-based risk formulation is utilized. The model may be defined with a more comprehensive SC risk modelling. To avoid non-linearity in revenue function, different price change values are defined as alternative scenarios, and each scenario is solved separately instead of defining sales price as a decision variable. In a future study, a non-linear model that defines sales price as a decision variable may be defined and solved by non-linear solution algorithms.
REFERENCES
(1) Akgul O., Shah N., Papageorgiou L. G., "An optimization framework for a hybrid first/second generation bioethanol supply chain”, Computers & Chemical Engineering, Volume 42, 11 July 2012, Pages 101-114
(2) Amaro A.C.S., Barbosa-Póvoa A.P.F.D., "The effect of uncertainty on the optimal closed-loop supply chain planning under different partnerships structure”, Computers & Chemical Engineering, Volume 33, Issue 12, 10 December 2009, Pages 2144-2158
(3) Baghalian A., Rezapour S., Farahani R. Z., "Robust supply chain network design with service level against disruptions and demand uncertainties: A real-life case”, European Journal of Operational Research, Volume 227, Issue 1, 16 May 2013, Pages 199-215
(4) Bassett M., Gardner L.,"Optimizing the design of global supply chains at Dow AgroSciences”, Computers & Chemical Engineering, Volume 34, Issue 2, 8 February 2010, Pages 254-265
(5) Beamon B. M. “Supply chain design and analysis: Models and methods”, Int. j. Production Economics 55 (1998) 281 – 294 (6) Bilir C., Ekici S.O., Sweeney D.C., 2015, “From a Literature Review to a Research Direction: Integrative Supply Chain Network
(7) Bogataj M., Grubbström R. W., Bogataj L., "Efficient location of industrial activity cells in a global supply chain”, International Journal of Production Economics, Volume 133, Issue 1, September 2011, Pages 243-250
(8) Carle M., Martel A., Zufferey N., "The CAT metaheuristic for the solution of multi-period activity-based supply chain network design problems”, International Journal of Production Economics, Volume 139, Issue 2, October 2012, Pages 664-677 (9) Cruz J. M., "The impact of corporate social responsibility in supply chain management: Multicriteria decision-making approach”,
Decision Support Systems, Volume 48, Issue 1, December 2009, Pages 224-236
(10) Cruz J. M., L. Zuzang,"Modeling and analysis of the multiperiod effects of social relationship on supply chain networks”, European Journal of Operational Research, Volume 214, Issue 1, 1 October 2011, Pages 39-52
(11) Hendricks K. B., and Singhal V. R. “Effect of Supply Chain Disruptions on Long-Run Stock Price Performance and Equity Risk of the Firm”, Production and Operations Management Society, 14(1), 2005, pp. 35–52
(12) Kabak O, Ulengin F. (2011); Possibilistic linear-programming approach for supply chain networking decisions, European Journal of Operational Research 209 (2011) 253 – 264
(13) Kumar S. K., Tiwari M.K., "Supply chain system design integrated with risk pooling”, Computers & Industrial Engineering, Volume 64, Issue 2, February 2013, Pages 580-588
(14) Lundin J. F., "Redesigning a closed-loop supply chain exposed to risks” International Journal of Production Economics, Volume 140, Issue 2, December 2012, Pages 596-603
(15) Masoumi A. H., Yu M., Nagurney A., "A supply chain generalized network oligopoly model for pharmaceuticals under brand differentiation and perishability”, Transportation Research Part E: Logistics and Transportation Review, Volume 48, Issue 4, July 2012, Pages 762-780
(16) Melo M. T., Nickel S., Saldanha-da-Gama F., “Facility Location and supply chain management – A review”, European Journal of Operational Research 196 (2009) 401 – 412
(17) Melo M.T., Nickel S., Saldanha-da-Gama F., "A tabu search heuristic for redesigning a multi-echelon supply chain network over a planning horizon” International Journal of Production Economics, Volume 136, Issue 1, March 2012, Pages 218-230 (18) Meng Q., Huang Y., Cheu R. L., "Competitive facility location on decentralized supply chains”, European Journal of Operational
Research, Volume 196, Issue 2, 16 July 2009, Pages 487-499
(19) Nagurney A., "Supply chain network design under profit maximization and oligopolistic competition”, Transportation Research Part E: Logistics and Transportation Review, Volume 46, Issue 3, May 2010, Pages 281-294
(20) Nagurney A., Ladimer S., Nagurney S., "Medical nuclear supply chain design: A tractable network model and computational approach”, International Journal of Production Economics, Volume 140, Issue 2, December 2012, Pages 865-874
(21) Nagurney A., Yu M., "Sustainable fashion supply chain management under oligopolistic competition and brand differentiation” International Journal of Production Economics, Volume 135, Issue 2, February 2012, Pages 532-540 & Chemical Engineering, Volume 47, 20 December 2012, Pages 183-193
(22) Olivares-Benitez E., Ríos-Mercado R. Z., González-Velarde J. L., "A metaheuristic algorithm to solve the selection of transportation channels in supply chain design”, International Journal of Production Economics, In Press, Accepted Manuscript, Available online 29 January 2013
(23) Pan F., Nagi R., "Robust supply chain design under uncertain demand in agile manufacturing”, Computers & Operations Research, Volume 37, Issue 4, April 2010, Pages 668-683Plastria F., “Static competitive facility location: An overview of optimisation approaches”, European Journal of Operational Research 129 (2001), Pages 461 - 470
(24) Plastria, 2001
(25) Prakash A., Chan F. T.S., Liao H., Deshmukh S.G., "Network optimization in supply chain: A KBGA approach”, Decision Support Systems, Volume 52, Issue 2, January 2012, Pages 528-538
(26) Rezapour S., Farahani R.Z. (2010); Strategic design of competing centralized supply chain networks for markets with deterministic demands, Advances in Engineering Software 41 (2010) 810 - 822
(27) Rezapour S., Farahani R.Z., Ghodsipou S.H., Abdollahzadeh S. (2011); Strategic design of competing supply chain networks with foresight, Advances in Engineering Software 42 (2011) 130 – 141
(28) Sabri E.H., Beamon B.M. (2000); A multi-objective approach to simultaneous strategic and operational planning in supply chain design, Omega 28 (2010) 581 - 598
(29) Shankar B. L., Basavarajappa S., Chen J. C.H., Kadadevaramath R. S., "Location and allocation decisions for multi-echelon supply chain network – A multi-objective evolutionary approach”, Expert Systems with Applications, Volume 40, Issue 2, 1 February 2013, Pages 551-562
(30) Yamada T., Imai K., Nakamura T., Taniguchi E., "A supply chain-transport supernetwork equilibrium model with the behaviour of freight carriers”, Transportation Research Part E: Logistics and Transportation Review, Volume 47, Issue 6, November 2011, Pages 887-907
(31) Yang G., Wang Z., Li X., "The optimization of the closed-loop supply chain network” Transportation Research Part E: Logistics and Transportation Review, Volume 45, Issue 1, January 2009, Pages 16-28
(32) Yu M., Nagurney A., "Competitive food supply chain networks with application to fresh produce” European Journal of Operational Research, Volume 224, Issue 2, 16 January 2013, Pages 273-282
(33) Zamarripa M. A., Aguirre A. M., Méndez C. A., Espuña A., "Improving supply chain planning in a competitive environment”, Computers & Chemical Engineering, Volume 42, 11 July 2012, Pages 178-188