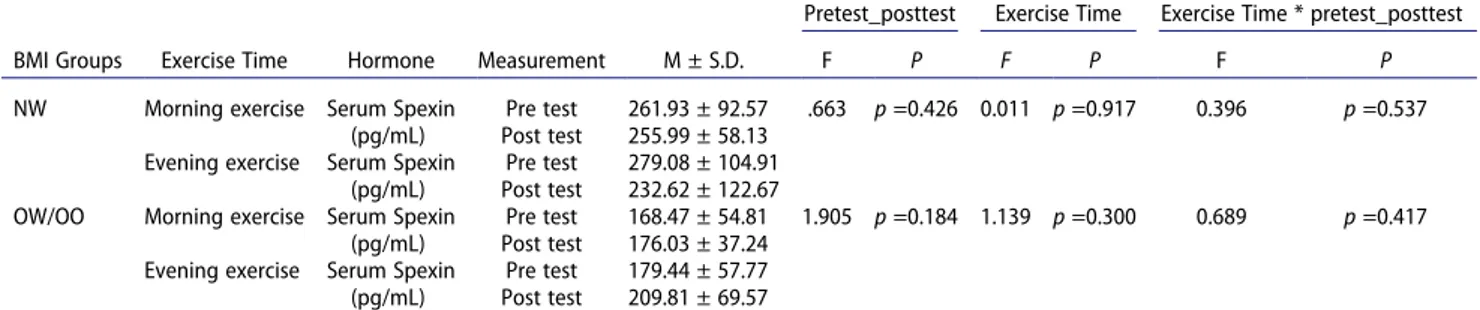
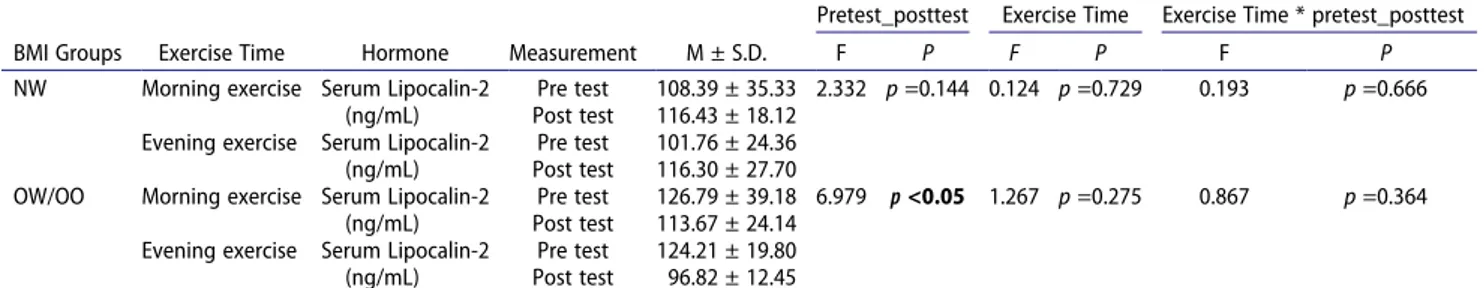
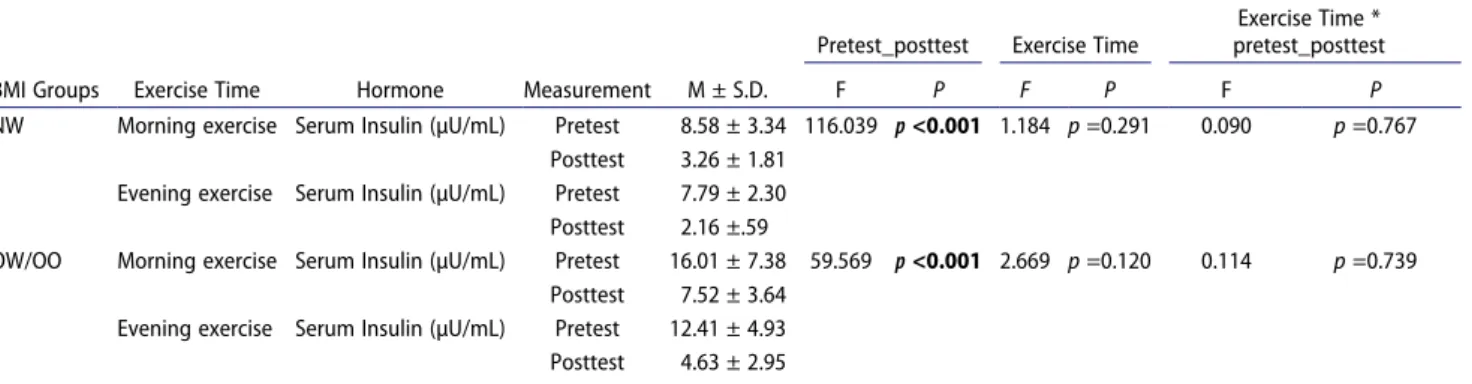
Assessment of acute aerobic exercise in the morning versus evening on asprosin, spexin, lipocalin-2, and insulin level in overweight/obese versus normal weight adult men
Tam metin
Şekil
Benzer Belgeler
It was retrospectively evaluated whether there was a difference in the severity and course of stroke in acute ischemic stroke patients diagnosed with type-2 DM and taking
Özal bunu Türk Silahlı Kuvvetlerinin 2000'li yıllara kadar nasıl planlandığının uzun uzun anlatıldığı bir dönemde, artık herkesin kabul ettiği cesur ve
什麼是根管治療?有哪些治療流程? 返回 醫療衛教 發表醫師 發佈日期
For patients with an initial IOP above 50 mmHg, the difference in the grade of corneal edema measured 30 minutes after treatment was insigni ficant between the ACP and mannitol groups
The aim of this study is to evaluate the relationship between obese or overweight mothers, their socio-demographic status and appetite on the anthropometric measurements of
When the difference between the post- test pre-test parameters are examined according to the differences between the aerobic and anaerobic training groups;
The post-hoc analysis indicated that this difference was associated with the significantly higher mean walkwork exhibited by the obese in comparison to that of the
The cloud load balancer, with auto scaling features, further increases the efficiency and optimized utilization of the computing resources.. This paper discusses how
