Comparison of nutritional composition (moisture, ash, crude protein,
nitrogen) and safety (aflatoxin, nitrate/nitrite) of organic and
conventional rice and lentil samples consumed in Ankara
Emine BAYDAN
1, Seher KÜÇÜKERSAN
2, Begüm YURDAKÖK DİKMEN
1, Farah Gönül AYDIN
1,
Sedat SEVİN
1, Emre ARSLANBAŞ
3, Mustafa Alp ÇETİNKAYA
4Ankara University, Faculty of Veterinary Medicine, 1Department of Pharmacology and Toxicology, 2Department of Animal Nutrition and Nutritional Diseases, Ankara; 3Cumhuriyet University, Faculty of Veterinary Medicine, Department of Pharmacology
and Toxicology, Sivas; 4National Food Reference Laboratory, Ankara, Turkey.
Summary: In the current study, organic and conventionally produced rice and lentil samples purchased from the supermarkets in Ankara, Turkey were analyzed for their nutritional composition, nitrate/nitrite content and aflatoxin contamination. Nitrate/nitrite concentrations were found to be significant (p<0.05) only for nitrate (higher in organic) and nitrite level (higher in conventional) in rice. No aflatoxin contamination was observed over limit of quantification (LOQ) and no difference was observed for dry matter. Ash value was found higher in organic than the conventional (p<0.05) rice; and vice versa for the lentil samples. Nitrogen and crude protein were higher in organic green lentil samples (p<0.001) than the conventional; whereas the differences of organic-conventional samples in terms of crude protein and the nitrogen content of the rice samples were insignificant (p>0.05). Since organic food market is increasing rapidly, more analysis regarding the nutrition composition and other potential risks such as mycotoxins are required to enlighten the consumers.
Keywords: Aflatoxin, conventional, lentil, nitrate/nitrite, nutritional composition, organic, rice.
Ankara’da tüketime sunulan organik ve geleneksel yöntemlerle üretilen pirinç ve mercimek
numunelerinin besin değeri (nem, ham kül, ham protein, azot) ve güvenilirliğinin (aflatoksin,
nitrat/nitrit) karşılaştırılması
Özet: Bu çalışmada, Ankara (Türkiye)’da süpermarketlerden alınan organik ve geleneksel yöntemlerle üretilen pirinç ve yeşil mercimek numunelerinin besin değeri, nitrat/nitrit içeriği ve aflatoksin kontaminasyonu araştırılmıştır. Nitrat/nitrit bakımından istatistiksel olarak anlamlı farklılık (p<0.05) pirinç numunelerinde (organik üretilenlerde nitrat daha yüksek ve geleneksel üretilenlerde nitrit daha yüksek) bulunmuştur. Tespit limiti üzerinde (LOQ), aflatoksin bakımından kirliliğe rastlanmamıştır ve numuneler arasında kuru madde bakımından da farklılık bulunmamaktadır. Ham kül değeri, organik pirinçte geleneksele göre daha yüksek (p<0.05) bulunmakla birlikte, mercimekte ise tam tersi bir durum olarak geleneksel ürünlerde daha yüksek bulunmuştur. Azot ve ham protein değerleri ise organik yeşil mercimekte (p<0.001) geleneksele göre daha yüksek bulunmuştur; ancak pirinç numunelerinde anlamlı bir farklılık bulunamamıştır (p>0.05). Hızla gelişen organik gıda sektöründe, üretilen gıdaların; besin değeri ve aflatoksinler başta olmak üzere kirleticiler bakımından değerlendirilmesi tüketicilerin bilinçlenmesi bakımından önem taşımaktadır.
Anahtar sözcükler: Aflatoksin, besin değeri, geleneksel, mercimek, nitrat/nitrit, organik, pirinç.
Introduction
Growing awareness of health and environment lead the public interest on organically produced agricultural products (18). The number of organic growers, volume of production and the variety of products have substantially increased in recent years in Turkey with huge growing diversity, compared to other European countries with a highly developed transport (11); where the domestic demand of the consumers mainly relies on the criteria mainly on the effects on human health (such as hormones, antibiotic, and chemical residues, and related
endocrine disruption) (16). However, there are reports regarding the organic products might differ on a variety of sensory qualities, and pesticide residues where limited evidence was found to support the susceptibility of microbiological contamination and other residual products in conventional foods (4). Within this context, there are studies where mycotoxin levels in organic grains were found to be lower (7, 19), higher (14) or with no difference (12) than the conventional samples. None of the other known or suspected differences between products from the two systems are sufficiently consistent
and dietarily important to be expected to cause a difference in nutritional value (5).
Despite the promotion of organic production, nutritional and toxicological value of these products are rarely discussed within the literature and sufficient data is still lacking. Therefore, updated information is required to evaluate the nutritional profiles of organic and conventional products. For this reason, the aim of the present study was to make a comparison of possible aflatoxin contamination, nitrate/nitrite levels and nutritional composition of organically and conventionally produced lentil and rice samples based on a market-oriented survey.
Materials and Methods
Sampling: Organic and conventional rice and green
lentil samples were purchased randomly from available supermarkets in Ankara, Turkey over a six month period (2012-2013) which consists 10 organic, 10 conventional green lentil and 9 organic, 9 conventional rice samples making a total of 38 samples. Production date and lot number were recorded for all samples. Before analysis; samples were grounded using 0.5 mm ring sieve, resulting in particle size less than 200 µm.
Chemicals and standards: All reagents/solvents
were of analytical or HPLC grade and obtained from Merck (Darmstadt, Germany). Standards of AFB1, AFB2, AFG1 and AFG2 were obtained from Sigma Chemical Co. (St. Louis, MO, USA). Disposable syringe filters were purchased from Cronus (PVDF, 13 mm, 0.2 µm). Stock solutions and standards for aflatoxin and nitrate/nitrite analyses were prepared according to AOAC Official Methods 991.31 and 968.07 (1).
Aflatoxin analysis: Aflatoxin B1, B2, G1 and G2
were determined by the methods described by Giray et al. (10) and Bansal et al. (2), which are in accordance to the Association of the Official Analytical Chemists (AOAC) Official Method 991.31 (1). The method was then implemented to our laboratory conditions as follows: 5 g NaCl was added to 50 g of the test sample and extracted by methanol-water (8:2,v/v) which was then diluted to 100 ml with water and cleaned up by the immunoaffinity column (VICAM AflaTest, Waters, Milford, MA, USA). Samples were transferred to the column and 10 ml distilled water was added in order to remove the matrix interfering compounds. Aflatoxins were eluted from the column by 1.5 mL methanol at 1-2 drops per second. Methanol eluate was dried under nitrogen stream at 50 °C. Samples were derivatized using the following procedure: 200 µl n-hexane and 50 µl trifluoroacetic acid were added to the dried extract and it was allowed to stand at room temperature for 5 min following vortex for 30 s. Then 950 µl phosphate buffer solution (9:1, Phosphate buffer pH 6.5: acetonitrile) was added and the mixture was vortexed for 30 s. Lower layer was filtered
through 0.2 µm syringe filter into an autosampler vial. The separation was achieved on Phenomenex, Luna C18
column (150 mm X 4.6 mm i.d., 5 µm). The column temperature was maintained at 30 °C and the detector of HPLC (Shimadzu LC-20AT prominence system with a RF-20A fluorescence detector-Tokyo, Japan) was set at 360-440 nm for excitation-emision wavelengths. The analysis was carried out using isocratic mobil phase consisted of water-methanol-acetonitrile (6:2:2, v:v:v). Flow rate was 1 ml min-1 and the injection volume was 20 µL with autosampler. Standard curves of aflatoxins were worked with 6 concentrations, ranging between 0.625-20 µg L-1 (0.625, 1.25, 2.5, 5, 10, 20 µg L-1). Calibration curves were described in lineer regression equations which was calculated for six (0.625-20 µg L-1) concentrations of both the standards and spiked samples, performed in triplicates and by three injections.
Nitrate and nitrite determination: Analysis of
nitrates and nitrites was conducted by the method based on the reaction of Griess described in AOAC Official Method 968.07 (1) which is commonly accepted (9, 23). After nitrate was reduced to nitrite, it was
measured at a wavelength of 550 nm as
spectrophotometric (Shimadzu UV1601 UV-VIS spectrophotometer-Tokyo, Japan). The results were compared by the standards of sodium nitrite and sodium nitrate (0.1, 0.2, 0.4, 0.6, 1 µg/ml) solutions and the recovery values for nitrite and tested at the same concentrations for both matrices.
Nutritional composition analysis: Dry matter, ash,
crude protein were determined according to the standard methods of the AOAC (1). Protherm (PAF 110/S) ashing furnace (Ankara, Turkey) and Termal (A1168OT) incubator (Termal Laboratory Devices, Istanbul, Turkey) were used for the analysis. The nitrogen contents were measured using a Kjeldahl digestion unit consisting of Kjeldatherm block digestion units (702001 KBL 20S), a programmable distillation unit with a titration unit (Vapodest 45s) and a scrubber unit, all manufactured by Gerhardt (Königswinter, Germany). The nitrogen value was converted to protein by multiplying to a factor of 6.25.
Statistical analysis: The data were expressed as
arithmetic means and standart error (
x
±S
x
). Statistical analyses were performed by SPSS 14.01 version for Windows (SPSS Inc, Chicago II, USA). Before performing any significance test, all variables were analyzed for normality using (by) Shapiro-Wilk test and for homogenity of variances using (by) Levene test, as parametric test assumptions. Organic and non-organic rice and green lentil groups were compared for its nutritional content and nitrate/nitrite levels using Student t-test or Mann Whitney U test where appropriate. Differences were considered as significant when the p value was less than 0.05.Results
Aflatoxin analysis: Retention times (Rt) for B1, B2,
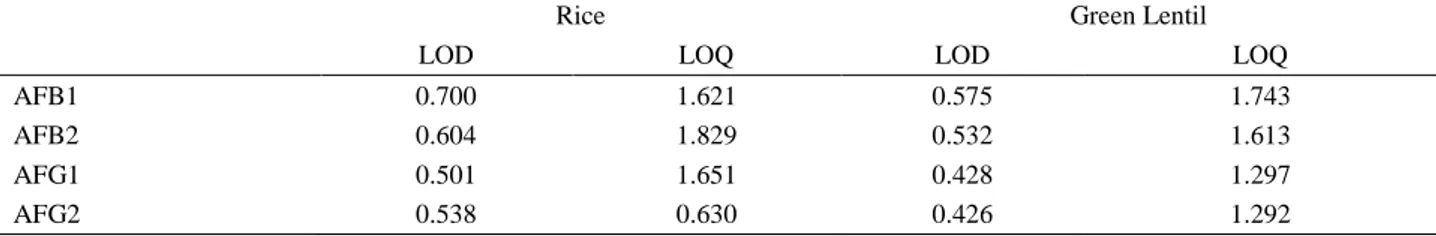
G1, and G2 were found as follows; 2.052±0.003, 2.597±0.005, 3.629±0.023, 3.610±0.009 min respectively with no interference from exogeneous substances at the Rt’s, defining the selectivity of the method for both rice and green lentil matrices. LOD and LOQ values are described in Table 1. Regression equations revealed good correlation coefficients (all > 99.47%) over the examined range. Mean recoveries for the spiked rice and green lentil samples for AFB1, AFB2, AFG1 and AFG2 were found as 85.14-91.77%, 78.19-91.08%, 83.88-89.15%, 85.35-92.38, respectively. RSD values (all below 14.59%) of intra-day and inter-day variation also confirmed the efficacy of the methods for the analysis. No contamination was observed for both matrices in organic and conventional samples.
Many consumers are attracted to organic foods in hope of finding a healthy and environmentally friendly alternative, globally (14). In spite of many advantages, within the context of limited literature, researchers have suggested that organic crops are more susceptible to mycotoxin contamination due to the forbidden use of antifungal pesticides (3); however limited information is available regarding aflatoxin contamination in organic products. Döll et al. (7) studied Fusarium mycotoxins in conventionally and organically grown grain from Thuringia in Germany where DON was detected in 147 out of 265 analysed samples. Blajet-Kosicka et al. (3) studied the co-occurrence and evaluation of mycotoxins in organic and conventional rye grain and products; where it was concluded that the concentration of DON, HT-2 and T-2 was significantly higher in conventional
products; with a contamination rate (%) 79, 37; 42, 21; 38, 27, respectively for conventional and organic products.
The presence of mycotoxins is a significant problem worldwide and monitored regularly by local authorities in Turkey (National Residue Monitoring Programs) (21). Since aflatoxin legislation is intended to implement the ALARA principle (As Low As Reasonable Achievable), especially regarding juvenile consumers, maximum residue limits (MRLs) implementation for these compounds are becoming increasingly strict (28) in EU defined by Commission Regulation No.1881/2006 which is reflected to Turkish legislations as well. MRLs for aflatoxin B1 for cereals and all products derived from
cereals are described as 2 μg kg-1 and for the sum of B 1,
B2, G1 and G2 as 4 μg kg-1. In baby-food including infant
formula, even stricter limits were declared (0.025 μg kg–1). In the present study, with respect to the limit of detection values and regulatory limits, aflatoxin contamination was not detected, yet no difference between organic and conventional products were observed. This could be related to the maintenance and the implementation of several measures of “good agricultural practices” especially for organic production.
Nitrate/nitrite levels: Regression equations for
standards revealed good correlation coefficients (r2= 0.9994 for nitrate, r2= 0.9992 for nitrite) at the linear range 0.1-1 µg ml-1. Recovery values for the spiked samples were found in percentage as 95.24±2.84% for rice and 76.28±11.82% for green lentil with coefficient of variation values (RSD) in percentage (%) ranging 0.24-2.90 for rice and 0.27-1.79 for green lentil at the tested concentrations for both nitrate and nitrite.
Table 1. LOD and LOQ values (µg kg-1
) of aflatoxins for rice and green lentil matrices. Tablo 1. Pirinç ve yeşil mercimek matrikslerinde aflatoksin için LOD ve LOQ değerleri (µg kg-1
).
Rice Green Lentil
LOD LOQ LOD LOQ
AFB1 0.700 1.621 0.575 1.743
AFB2 0.604 1.829 0.532 1.613
AFG1 0.501 1.651 0.428 1.297
AFG2 0.538 0.630 0.426 1.292
Table 2. Nitrate/nitrite levels of organic and conventional samples (mg kg-1). Tablo 2. Organik ve geleneksel ürünlerde nitrat/nitrit düzeyleri (mg kg-1).
Sample Production type p Content n Organic
x
±S
x
Conventionalx
±S
x
Rice Nitrate 9 5.82±1.75 3.43±1.77 0.031* Nitrite 9 0.63±0.41 1.11±0.63 0.047*Green Lentil Nitrate 10 44.98±20.66 49.09±26.55 0.704
Nitrite 10 0.93±0.30 0.87±0.44 0.690
Sensitivity threshold of the assay was 30.74 and 48.79 ng ml-1 and the intra- and interday assay variation varied 0.28-3.14% vs. 1.91-6.58% and 0.18-2.40% vs. 0.55-7.79% for nitrite and nitrate, respectively. Nitrate/nitrite concentrations of the samples are shown in Table 2. The differences of the nitrate/nitrite concentrations between the conventional and the organic products were found to be significant (p<0.05) only for nitrate and nitrite level in rice.
When a plant is presented with a lot of nitrogen, it increases protein production and the excess is accumulated as nitrates and stored predominately in the green leafy part of the plant. Since the nitrogen content of the organically managed soils are lower than the chemically fertilized soils, it would be expected that organic crops and products would have, less nitrates and less protein compared to the conventional ones (30). This is supported by several literature conducted in various matrices (8, 20, 22, 26). Interestingly, the nitrate levels in conventional rice samples were found to be lower than the organic samples (3.43±1.77; 5.82±1.75 as ppm, p<0.05 respectively; Table 2) in this study. In contrast, organic rice nitrite levels were significantly lower than in conventional (1.11±0.63; 0.63±0.41 as ppm, p<0.05 respectively; Table 2). This suggests that the slower conversion of nitrate to nitrite in organic products. In the current study, eventhough the nitrate levels in conventional green lentil samples were found to be slightly higher than organic ones, in general no statistically significant difference were found for both groups (p>0.05; Table 2). Few literature information is available for nitrate/nitrite concentrations for conventional rice and lentil only. In the study by Ezeagu (9), nitrate/nitrite levels in raw and cooked cereals (rice and maize) were investigated where nitrate levels in raw rice samples ranged 120.0-308.0 mg kg-1 (average 207.7 mg kg-1) and nitrite were found as 0.006-0.05 mg kg-1 (average 0.047 mg kg-1). In another study on the nitrite
levels of ready-made soups, nitrite content was found 12-225 mg kg-1 (median 38 mg kg-1) in lentil based soups (8). In the study by Singh and Prakash (25) nitrate content of control rice samples were found as 5.10±0.35 µmol NO3- g fresh weight-1. In another study, regarding
the nitrate and nitrite content of the home-prepared complementary infant foods in Nigeria, nitrate (mgNO3
-N 100 g-1 ) and nitrite (mgNO2 -
N 100 g-1) contents were found as 4.1±0.4 and 16.0± 2.8, respectively (27). Current study, revealed similar results for nitrate and nitrite concentrations in green lentil with the study of Erkekoglu et al. (8); however compared to other available literature, these levels were found to be lower probably due to the differences of geographical location where cereal content were grown.
The acceptable daily intake (ADI) of nitrate laid down by the European Scientific Committee on Food is 3.65 mg kg-1 body weight for adults (Commission Regulation 2006/1881/EC) and 200 mg/kg for infants and young children (Directive 2006/125/EC). Estimated theoretical maximum levels of nitrate and nitrite according to the Codex General Standard for Food Additives (GSFA) were set as 360 ppm and 420 ppm, respectively (13). In the current study, nitrate/nitrite levels for all of samples were found to be lower than these recommended values.
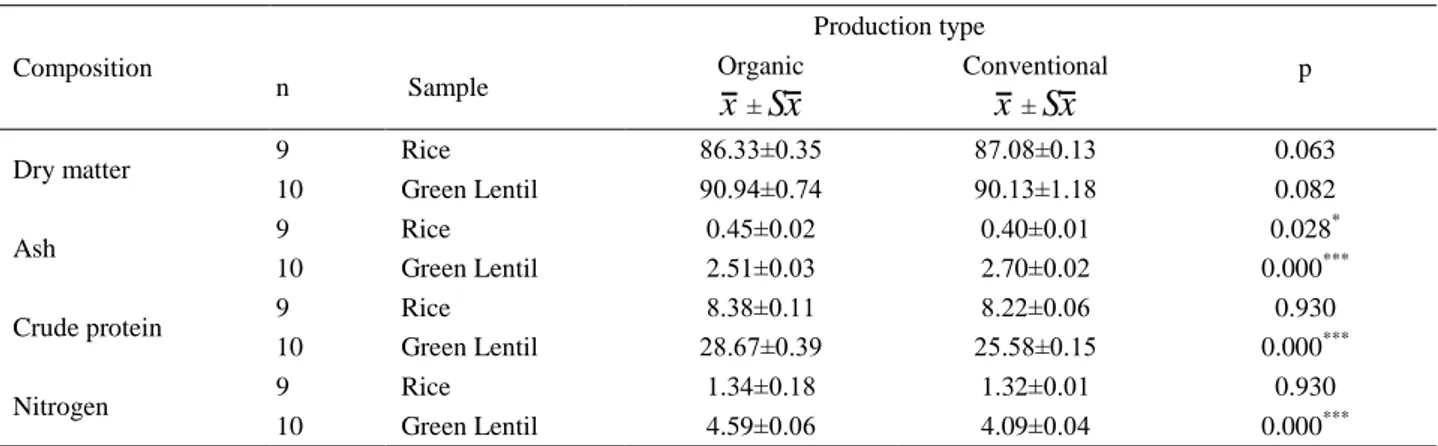
Nutritional composition: Nutritional analysis of
green lentil and rice samples was carried out on dry matter (DM) basis and the results were shown in Table 3. In terms of dry matter, no statistically significant difference was found for both rice and lentil samples. The ash (%) value of the rice samples was found to be higher in organic rice than conventional samples (p<0.05); and vice versa for the lentil samples (p<0.001). Nitrogen (p<0.001) and crude protein (p<0.001) were found to be higher in organic green lentil samples than the conventional ones; whereas the differences of organic-conventional samples in terms of crude protein
Table 3. Nutritional composition of conventional/organic samples (g 100 g-1 DM basis). Tablo 3. Geleneksel/organik ürünlerin (g 100 g-1
KM üzerinden) besin değerleri.
Composition Production type p n Sample Organic
x
±S
x
Conventionalx
±S
x
Dry matter 9 Rice 86.33±0.35 87.08±0.13 0.063
10 Green Lentil 90.94±0.74 90.13±1.18 0.082
Ash 9 Rice 0.45±0.02 0.40±0.01 0.028
*
10 Green Lentil 2.51±0.03 2.70±0.02 0.000***
Crude protein 9 Rice 8.38±0.11 8.22±0.06 0.930
10 Green Lentil 28.67±0.39 25.58±0.15 0.000***
Nitrogen 9 Rice 1.34±0.18 1.32±0.01 0.930
10 Green Lentil 4.59±0.06 4.09±0.04 0.000***
and the nitrogen content of the rice samples were found to be statistically insignificant (p>0.05).
In a review regarding the comparison of the composition (nutrients and other substances) of organically and conventionally produced foodstuffs by Dangour et al. (6); significant differences with regards to nitrogen values were described; where nitrogen was found to be higher in conventional crops. On the contrary, nitrogen values for both rice (p>0.05) and green lentil (p<0.05) samples were found to be higher in organic samples, correlated to the crude protein content in the current study. In contrast to the study of Shier et al. (24); where the ash values was significantly greater in conventional wheat samples compared to organic ones after ashing at 550˚C, in the current study for rice, conventional samples was found to be lower (p<0.05) and vice versa for green lentil (p<0.001).
According to results of this study, levels of crude protein and nitrogen in organic green lentils were higher than that of conventionally produced samples (p<0.05). Regarding the nutritional composition, protein (25.58 for conventional and 28.67 for organic samples as mean g 100 g-1 DM basis) and ash composition (2.42 for conventional and 2.28 for organic samples as mean g 100 g-1 DM basis) of the green lentil samples in the current study were found to be similar to Canadian green lentils (26.3 for protein and 2.8 for ash composition as mean g 100 g-1 DM basis), Australian green lentils (24.0 for protein and 2.2 for ash composition as mean g 100 g-1 DM basis) (29) and protein levels (23.30-25.20 g/100 g) of lentil produced in Bangladesh (15).
Discussion and Conclusion
Since the composition of the food product is influenced by many factors, definitive conclusions, from the interpretation of the investigations of nutritional value of organic/conventional products, are difficult to accomplish. Meanwhile, present study revealed that the nitrate/nitrite concentrations were found to be significantly different only for nitrate (higher in organic) and nitrite (higher in conventional) level in rice; where no aflatoxin contamination was observed and no difference was observed in terms of dry matter for both samples. Ash value of the rice samples was found to be higher in organic rice than conventional samples; and vice versa for the lentil samples. Nitrogen and crude protein were found to be higher in organic green lentil samples than the conventional ones; whereas the differences of organic-conventional samples in terms of crude protein and the nitrogen content of the rice samples were found to be statistically insignificant. Overall, the results indicated that the importance of constant monitoring of organic/conventional food samples for
their nutrition composition and food related potential risks to avoid the misguidance of the consumers.
Acknowledgements
Resources provided by Ankara University, Faculty of Veterinary Medicine are gratefully acknowledged.
References
1. AOAC (Association of Official Analytical Chemists) (2000): Official methods of analysis of AOAC International; 17th ed., Washington (DC).
2. Bansal J, Pantazopoulos P, Tam J, et al. (2011): Surveys of rice sold in Canada for aflatoxins, ochratoxin A and fumonisins. Food Addit Contam Part A Chem Anal Control Expo Risk Assess, 28, 767-774.
3. Blajet-Kosicka A, Twaruzek M, Kosicki R, et al. (2014): Co-occurrence and evaluation of mycotoxins in organic and conventional rye grain and products. Food Control,
38, 61-66.
4. Bourn D, Prescott JA (2002): Comparison of the nutritional value, sensory qualities, and food safety of organically and conventionally produced foods. Crit Rev Food Sci Nutr, 42, 1-34.
5. Brandt K, Molgaard JP (2001): Organic agriculture: Does it enhance or reduce the nutritional value of plant foods? J Sci Food and Agric, 81, 924-931.
6. Dangour A, Dodhia S, Hayter A, et al. (2014): Comparison of composition (nutrients and other substances) of organically and conventionally produced foodstuffs: a systematic review of the available literature. Report for the Food Standards Agency Nutrition and Public Health Intervention Research Unit. London School of Hygiene &TropicalMedicine;
http://multimedia.food.gov.uk/multimedia/pdfs/organicrevi ewappendices.pdf. 2009. (25 December 2014).
7. Döll S, Valenta H, Kirchheim U, et al. (2000): Fusarium mycotoxins in conventionally and organically grown grain from Thuringia, Germany. Mycotoxin Res, 16, 38-41. 8. Erkekoğlu P, Sipahi H, Baydar T (2009): Evaluation of
nitrite in ready-made soups. Food Anal Methods, 2, 61-65. 9. Ezeagu IE (2006): Contents of nitrate and nitrite in some Nigerian food grains and their potential ingestion in the diet - a short report. Pol J Food Nutr Sci, 15, 283-285. 10. Giray B, Girgin G, Engin AB, et al. (2007): Aflatoxin
levels in wheat samples consumed in some regions of Turkey. Food Control, 18, 23-29.
11. Gubbuk H, Polat E, Pekmezci M (2004): Organic fruit production in Turkey. J Fruit Ornam Plant Res, 12, 23-29. 12. Hoogenboom LA, Bokhorst JG, Northolt MD, et al.
(2008): Contaminants and microorganisms in Dutch organic food products: A comparison with conventional products. Food Addit Contam Part A Chem Anal Control Expo Risk Assess, 25, 1195-1207.
13. IPCS INCHEM (2014): Nitrate and nitrite report. International Programme on Chemical Safety. WHO Food Additives Series No. 50;
http://www.inchem.org/documents/jecfa/jecmono/v50je07. htm. (25 December 2014).
14. Malmauret L, Parent-Massent D, Hardy JL, et al. (2002): Contaminants in organic and conventional food stuffs in France. Food Addit Contam, 19, 524-532. 15. Mondal MMA, Puteh AB, Malek MA, et al. (2013):
Contribution of morpho-physiological traits on yield of lentil (Lens culinaris Medik.). Aust J Crop Sci, 7, 1167-1172.
16. Oraman Y, Unakitan G (2010): Analysis of factors influencing organic fruit and vegetable purchasing in Istanbul, Turkey. Ecol Food Nutr, 49, 452-466.
17. Perez-Llamas F, Navarro I, Marin J, et al. (1996): Comparative study on the nutritive quality of foods grown organically and conventionally. Alimentaria, 34, 41-44. 18. Pusseimer L, Larondelle Y, Van Peteghem C, et al.
(2006a): Chemical safety of conventionally and organically produced foodstudds: A tentative comparison under Belgian conditions. Food Control, 17, 14-21. 19. Pussemier L, Piérard JY, Anselme M, et al. (2006b):
Development and application of analytical methods for the determination of mycotoxins in organic and conventional wheat. Food Addit Contam, 23, 1208-1218.
20. Rembialkowska E (1999): Comparison of the contents of nitrates, nitrites, lead, cadmium and vitamin C in potatoes from conventional and ecological farms. Pol J Food Nutr Sci, 8, 17-26.
21. RTMFAL. Republic of Turkey Ministry of Food, Agriculture and Livestock (2014): National Residue
Monitoring Program 2014
http://www.tarim.gov.tr/Sayfalar/Icerikler.aspx?IcerikId=0 5a81017-4344-4b80-a6b2-dbae7aa8288f. (25 December 2014).
22. Santos JS, Beck L, Walter M, et al. (2005): Nitrate and nitrite in milk produced by conventional and organic systems. Ciênc Tecnol Aliment, 25, 304-309. [Abstract in English].
23. Sen NP, Donaldson B (1978): Improved colorimetric method for determining nitrate and nitrate in foods. J Assoc Off Anal Chem, 61, 1389-1394.
24. Shier NW, Kelman J, Dunson JW (1984): A comparison of crude protein, moisture, ash and crop yield between organic and conventionally grown wheat. Nutr Rep Int, 30, 71-76.
25. Singh P, Prakash S (1987): Nitrate assimilation in rice shoot as affected by herbicide. Proc Indian Natl Sci Acad B Biol Sci, 53, 551-555.
26. Stertz SC, Rosa MIS, De Freitas RJS (2005): Nutritional quality and contaminants of conventional and organic potato Solanum tuberosum L., Solanaceae in metropolitan region of Curitiba - Parana - Brazil. B Ctr Pesqui Proc Al,
22, 383-396. [Abstract in English].
27. Umah JA, Ketiku AO, Schridhar MKC (2003): Nitrate, nitrite and ascorbic acid content of commercial and home - prepared complementary, infant foods. Afr J Biomed Res, 6, 15-20.
28. Völkel I, Schröer-Merker E, Zerny CP (2011): The carry-over of mycotoxins in products of animal origin with special regard to its implications for the European Food Safety Legislation. Food Nutr Sci, 2, 852-867.
29. Wang N, Daun JK (2004): The chemical composition and nutritive value of Canadian pulses. Canadian Grain Commission. Report on lentil;
http://www.pulsecanada.com/uploads/c4/91/c491f652f0cf5 3390d9a5b86aa63aeea/The-Chemical-Composition-and-Nutritive-Value-of-Canadian-Pulses.pdf. (25 December 2014).
30. Worthington V (2001): Nutritional quality of organic versus conventional fruits, vegetables and grains. J Altern Complement Med, 7, 161-173.
Geliş tarihi: 24.08.2015 / Kabul tarihi: 16.12.2015
Address for correspondence:
Prof.Dr. Emine Baydan
Ankara University, Faculty of Veterinary Medicine, Department of Pharmacology and Toxicology 06110 Dışkapı, Ankara, Turkey.