Tar. Bil. Der. Dergi web sayfası: www.agri.ankara.edu.tr/dergi Journal homepage: www.agri.ankara.edu.tr/journal
Soil Particle Size Distribution and Solid Fractal Dimension as
Influenced by Pretreatments
Hikmet GUNALa, Sabit ERSAHINb, Buket Y. UZc, Mesut BUDAKd, Nurullah ACIRa
a
Gaziosmanpasa University, Faculty of Agriculture, Department of Soil Science and Plant Nutrition, 60240, Tokat, TURKEY b
Karatekin University, Faculty of Forestry, Department of Soil Science and Ecology, Cankiri, TURKEY c
Akdeniz University, Faculty of Agriculture, Antalya, TURKEY d
Hakkari University, Junior Technical College, Department of Horticulture, Hakkari, TURKEY
ARTICLE INFO
Research Article Agricultural Technologies
Corresponding author: Hikmet GUNAL, e-mail: [email protected], Tel: +90(356) 252 16 16/2177 Received: 26 June 2011, Received in revised form: 15 December 2011, Accepted: 28 December 2011
ABSTRACT
Soil particle-size distributions can provide valuable information on the processes and products of soil formation. The purpose of this study was to assess the pretreatment effect on the particle size distribution and corresponding fractal dimension of particle size (Ds). Twenty nine soil samples were collected from diverse climatic and
pedogenic conditions with diverse particle size distributions, calcium carbonate and organic matter contents. To evaluate the effect of pretreatment on soil particle-size distribution, four different types of particle size distributions and fractal dimension values were obtained. Treatments included, 1) no pretreated, 2) organic matter removed with H2O2, 3) calcite (CaCO3) removed with NaOAc, and 4) organic matter and calcium carbonate removed. Clay
content ranged from 12.5 to 66.5%, organic matter varied from 0.05 to 4.25%, and calcium carbonate content ranged from 5.57 to 60.09%. The difference in clay content before (42.36%) and after (44.61%) pretreatment of organic matter was significant (P<0.05) but the same pretreatment didn’t yield any significant differences in sand, silt and fractals. However, fractal and sand content obtained after calcium carbonate removal were significantly different from those of non-pretreated samples (P<0.01 and P<0.05, respectively). Dissolving calcium carbonate probably removed the clay sized calcium carbonate particles which were considered within the clay fraction. Therefore, the lowest mean fractal values (Dsc=2.8343 and Dsoc=2.8336) were obtained after calcium carbonate
removal. The study results revealed that pretreatments affected the rates of particle size distributions. However, the differences in clay, silt, and sand contents obtained when pretreated together with H2O2 and NaOAc were not
significantly different.
Keywords: Organic matter; Calcium carbonate; Pretreatment; Soil texture; Fractal dimension
Ön Muameleden Etkilenen Toprak Parçacık Büyüklük
Dağılımı ve Katı Fraktal Boyutları
ESER BİLGİSİ
Araştırma Makalesi Tarım Teknolojileri
Sorumlu Yazar: Hikmet GUNAL, e-posta: [email protected], Tel: +90(356) 252 16 16/2177 Geliş tarihi: 26 Haziran 2011, Düzeltmelerin gelişi: 15 Aralık 2011, Kabul: 28 Aralık 2011
TARI M B İL İMLER İ DERG İS İ
JOUR
NAL
OF
AGRICULTURAL
SCIENCES
17 (2011 ) 217 ‐22 9
ÖZET
Toprak parçacık büyüklük dağılımı toprak oluş işlemleri ve ürünleri hakkında önemli bilgiler sağlamaktadır. Bu çalışmanın amacı, ön muamelenin parçacık büyüklük dağılımına ve buna karşılık gelen parçacıkların fraktal boyuna (Ds) etkisini belirlemektir. Farklı iklim ve toprak oluşum işlemleri altında bulunan ve parçacık büyüklük dağılımı, kalsiyum karbonat ve organik madde içerikleri değişken olan yirmi dokuz toprak örneği toplanmıştır. Ön muamelenin parçacık büyüklük dağılımına etkisini değerlendirmek için, dört farklı şekilde parçacık büyüklük dağılımı ve fraktal boyut değerleri elde edilmiştir. Uygulamalar 1)kontrol (muamele yapılmayan), 2) H2O2 ile
organik maddenin uzaklaştırılması 3) kalsit’in (CaCO3) NaOAc ile uzaklaştırılması ve 4) organik madde ve
kalsiyum karbonatın uzaklaştırılması şeklindedir. Örneklerin kil içeriği %12.5 ile %66.5, organik madde %0.05 ile %4.25 ve kalsiyum karbonat içeriği %5.57 ile %60.09 arasında değişmektedir. Organik madde uzaklaştırılmadan önce ve sonraki kil içeriği istatistiksel olarak önemli (P<0.05) iken bu fark silt ve kum içeriği için ve fraktal değerleri için önemli bulunmamıştır. Bununla birlikte, kalsiyum karbonat uzaklaştırılan örneklerin fraktal değerleri ve kum içeriği muamele yapılmayan örneklere göre önemli düzeyde farklı bulunmuştur (sırası ile P<0.01 ve P<0.05). Kalsiyum karbonatın uzaklaştırılması muhtemelen kil fraksiyonu içinde görülen kil büyüklüğündeki kalsiyum karbonatın uzaklaştırmıştır. Bundan dolayı, en düşük ortalama fraktal değerleri (Dsc=2.8343 ve
Dsoc=2.8336) kalsiyum karbonat uzaklaştırılması ile bulunmuştur. Çalışma sonuçları ön muamelelerin parçacık
büyüklük dağılımını etkilediğini göstermiştir. Bununla birlikte, hem H2O2hem de NaOAc ile muamele edildiğinde
kil, silt ve kum içeriklerindeki farklılık önemli olmamıştır.
Anahtar sözcükler: Organik madde; Kalsiyum karbonat; Ön muamele; Toprak tekstürü; Fraktal boyutu
© Ankara Üniversitesi Ziraat Fakültesi
1. Introduction
Primary minerals originate from weathering of a parent material, and generally present in the sand- and silt-sized fractions, while secondary minerals such as clay minerals are the result of formation of new minerals (Wu et al 1993; Posadas et al 2001). Particle-size distributions of soils are often used to estimate other soil properties such as soil moisture characteristics and hydraulic conductivity (Bittelli et al 1999; Khodaverdiloo et al 2011), thus accurate estimation of soil properties strongly depends on the accuracy of particle size determination.
The physical and chemical behaviors of soils are significantly influenced by particle-size distribution which is important for soil interpretations, determination of soil hydrologic qualities, plant nutrient requirements and classifications (Eshel et al 2004). Particle size distribution reflects the relative balance of weathering and pedogenetic processes, and it is typically presented as percentage of the total mass of soil by a given size fraction (Eshel et al 2004). The textural triangle provided a common language with scientists, agronomists and engineers describes the major physical property of
a soil (Filgueira 2006).
Conventional particle-size analysis methods involve measurement of the mass fractions of clay, silt, and sand. These fractions are used to find the textural class using a textural diagram, commonly in form of a textural triangle (Gee & Bauder 1986; Soil Survey Division Staff 1993). Standard analyses of dry soils usually include dispersion of the soils followed by particle size determination by a variety of time consuming methods. Clay and silt particles are usually measured with sedimentation using a hydrometer or pipette method. Sand is then measured with sieving which is the process whereby the soil is separated in particle size classes using different sizes of sieves. Sedimentation is the process of the settling of soil particles in a liquid. The difference in settling rate enables the particle size classes to be separated.
Soil particles ranging from 0 to 2 mm may contain separate sand, silt, and clay particles as well soil aggregates (Stanchi et al 2008). Sand, silt, and clay particles are often sticked together with cementing agents such as sparingly soluble salts (calcium carbonate, gypsum and etc) and organic compounds. The sticked or bonded
particles form large soil structural units, i.e. aggregates and peds. Various treatments are used to break the bonds between primary soil particles and soil aggregates prior to particle size distribution measurement. Treatments lead to the fragmentation of soil material (Stanchi et al 2006). The destruction of coarse sand-size aggregates releases not only the clay particles, but also fine sand and silt (Bronick & Lal 2005).
Pretreatment in particle size determination enhances the dispersion of aggregates. Therefore, it is a key step in particle size determinations, and is generally recommended. Physical treatments are used to enhance the dispersion of soils while chemical treatments (organic matter and calcium carbonate removal) are used to remove carbonates and organic matter coatings (Gee & Bauder 1986). Soil organic matter (SOM) and calcium carbonate constrains the dispersion of soil colloids. Highly aggregated clay soils may behave like coarse sand in terms of water movement. Therefore, removing organic matter and soluble salts is recommended prior to particle size analysis (Gee & Bauder 1986) and is also used before characterization of soil mineralogy (Feller et al 1992). Chemical treatments of soil result in removal of coating found between soil particles (Gee & Bauder 1986). The outcome of such measurements may closely depend on the effectiveness of the treatment which is particularly important in particle size distributions of fine soil fractions, as SOM and calcium carbonate are known strong binding agents (Tisdall 1996). The absence of pretreatment for SOM could in some cases affect the dispersion of particles leading to incomplete segregation, and therefore to an underestimation of small particle fractions (Bittelli et al 1999). The SOM resistant to H2O2 treatment is considered to be stabilized in organo-mineral associations. Leifeld & Kögel-Knabner, (2003) reported that particles <1μm were only mechanically dispersed indicating that smaller particles are bound more strongly, forming clay clusters and silt-sized micro-aggregates.
The presence of gypsum in soils affects their physical properties greatly and affects
particle-size analysis. Comparison of field and laboratory determinations of the texture of gypsiferous soils can be misleading because gypsum occurs as crystals in the various size fractions. Consequently field textures are normally coarser than laboratory determinations (Hesse 1976). The calcium carbonate in soil is made up almost entirely of tiny calcite crystals which dominate the clay-sized fraction, yet they do not have the same characteristics in terms of water retention as typical phyllo-silicate clays minerals. Calcium carbonate in soil results in feeling siltier when hand-texturing than it might actually be. The pipette and hydrometer methods use an average value for the particle density in determining settling times of particles. Dispersing the soil for the pipette or hydrometer methods can result in the break-up of calcium carbonate fragments into smaller calcite crystals making the soil appear more clayey in texture than it is (Kerry & Oliver 2006). Therefore the purpose of this study was to assess the pretreatment effect on the particle size distribution of twenty nine soil samples collected from diverse climatic and pedogenic conditions with diverse particle size distributions and calcium carbonate and organic matter contents.
One of the latest developments in the study of soil particle size distributions has focused on the use of fractal mathematics to characterize particle sizes (Bitelli et al 1999; Tyler & Wheatcraft 1992). The fractal concept has increasingly been used to characterize soil properties. The model of fractal fragmentation is a possible method to describe observed particle-size distributions with a minimum set of parameters (Tyler & Wheatcraft 1992). Perfect & Kay (1991) used fractal to evaluate the influence of tillage on soil aggregation, and Ersahin et al (2006) estimated specific surface area and soil cation exchange capacity using their solid fractal dimensions. The application of fractal geometry to describe soil degradation and dynamics is also becoming a useful tool for better understanding of the performance of soil systems (Jin et al 2011).
In the present work, it was compared soil particle size distributions and fractals before and
after removing organic matter, calcium carbonate, and combination of both.
2. Materials and Methods
2.1. SoilsIn this study, 29 soil samples from different horizons were used to represent a wide variety of parent materials, weathering conditions, organic matter contents, calcium carbonate contents and particle size distributions (textures). Soil samples were air dried, gently crushed, and passed through a 2-mm sieve to exclude fractions > 2mm.
2.2. Pretreatments and analyses
Calcium carbonate contents were determined using cold 1M HCl. Since all soils contained carbonates, the samples were treated with 0.5 M sodium acetate at 75°C for at least 1 h. After acetate treatment, samples were washed with deionized water. Soil organic matter was determined with the Walkley-Black method (Nelson & Sommers, 1982), and ranged from 0.05 to 7.35% by weight. All soil samples were further pretreated by removing organic matter using H2O2 (30%, w/w) (Gee & Bauder 1986). Briefly, 40 g of sample was treated with H2O2 initially at room temperature. After gas development ceased to evolve, suspensions were boiled at 80°C for 24 h, respectively. Increasing temperature accelerates the decomposition of H2O2 but shortens the reaction time necessary to oxidize organic matter (Schultz et al 1999).
After pretreatments, all soil samples were dispersed with sodium hexametaphosphate. Samples then were soaked for an overnight and transferred to a dispersing cup and mixed for 5 minutes with an electric mixer. The suspension was poured into a sedimentation cylinder and distilled water was added to bring the volume 1000 ml. Afterward, the suspension was shaken for 1 min. The hydrometer was then lowered into the suspension and the readings were taken after 40s and 2, 8, 15, 30, 60, 120, 240 and 1440 min. Also the temperature was recorded at each time to allow viscosity and density corrections (Gee & Bauder 1986; Filgueira et al 2003). Soil solutions were sieved with the sodium hexametaphosphate
solution at 2000, 1180, 1000, 850, 425, 355, 212, and 75 m mesh filters to determine sand fractions. Particles, smaller than 75 m, were analyzed by the hydrometer method.
2.3. Calculation of fractal dimensions of particle size distributions
In our study, experimental data obtained from particle-size analyses were used along with Equation 1 to estimate fractal dimension of particle-size distribution, Ds. M (r<R) was obtained as the cumulative mass of the particles smaller than the given particle size (R) in the sample from hydrometer or sieve analyses as described by Gee & Bauder (1986). To evaluate Ds in Equation 1, we regressed log (M (r<R)/MT) against log (R/Rupper) for each soil sample. Then the Ds values were calculated from the slope of resulting regression equations (Tyler & Wheatcraft, 1992); , ) ( 3 Ds Lupper T R R M R r M (1)
where, M (g) is the mass of soil particles with a radius smaller than R (r<R), RLupper is the upper size limit for the fractal behavior, MT is the total mass (g) of the soil lower than RLupper, and Ds is the solid fractal dimension.
2.4. Data analyses
Descriptive statistics mean, range, standard deviation, coefficient of variation (CV), skewness and kurtosis for soil characteristics evaluated were calculated. Measured values (dependent variable) for clay content were regressed against each of the variables, and then Ds values were calculated for different pretreatments. Depending on the nature of the relationship, linear or polynomial regression was considered. Coefficient of determination (R2), mean squared error and significance of overall regression (P) were considered in the evaluating the validity of regression equations to describe variation in dependent variables (Kleinbaum et al 1988). The statistical analysis were performed using the software SPSS (Version 13.0).
3. Results and Discussions
Organic matter removal with hydrogen peroxide and calcium carbonate dissolution with sodium acetate methods were used in this study to evaluate the effectiveness of the pretreatments on the analysis of particle-size, and complementary fractal coefficients were calculated which are highly affected by clay content of the soils.
3.1. Soil characteristics
The soils investigated were differing in pedogenesis (Entisols, Inceptisols, Mollisols, Alfisols and Vertisols), and soil calcium carbonate content ranged from 5.57% to 60.09%, while organic matter content ranged from 0.05 to 4.25% (Table 1). Since the major soil binding
components are organic matter and calcium carbonate, soils investigated were representing a wide range of these binding elements. Descriptive statistics of soil particle size distributions before and after pretreatments were presented in Table 2. The soil samples were also particularly chosen to represent a wide range of particle size distribution (Figure 1) to evaluate the effects of each pretreatment on different textural groups. Comparing dispersion among different soil properties, it is convenient and appropriate to express variance free from units of measurements. Coefficient of variation (CV) which is the ratio of standard deviation to the mean is useful and meaningful index to compare the variability
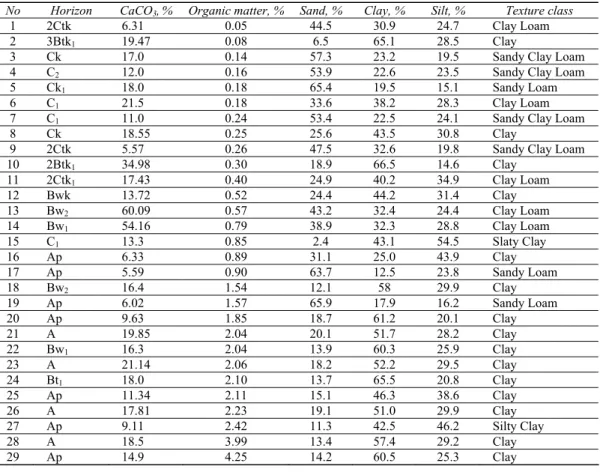
Table 1-Texture, organic matter and calcium carbonate contents of soils
Çizelge 1-Toprakların tekstür, organik madde ve kalsiyum karbonat içerikleri
No Horizon CaCO3,% Organic matter, % Sand, % Clay, % Silt, % Texture class
1 2Ctk 6.31 0.05 44.5 30.9 24.7 Clay Loam
2 3Btk1 19.47 0.08 6.5 65.1 28.5 Clay
3 Ck 17.0 0.14 57.3 23.2 19.5 Sandy Clay Loam
4 C2 12.0 0.16 53.9 22.6 23.5 Sandy Clay Loam
5 Ck1 18.0 0.18 65.4 19.5 15.1 Sandy Loam
6 C1 21.5 0.18 33.6 38.2 28.3 Clay Loam
7 C1 11.0 0.24 53.4 22.5 24.1 Sandy Clay Loam
8 Ck 18.55 0.25 25.6 43.5 30.8 Clay
9 2Ctk 5.57 0.26 47.5 32.6 19.8 Sandy Clay Loam
10 2Btk1 34.98 0.30 18.9 66.5 14.6 Clay 11 2Ctk1 17.43 0.40 24.9 40.2 34.9 Clay Loam 12 Bwk 13.72 0.52 24.4 44.2 31.4 Clay 13 Bw2 60.09 0.57 43.2 32.4 24.4 Clay Loam 14 Bw1 54.16 0.79 38.9 32.3 28.8 Clay Loam 15 C1 13.3 0.85 2.4 43.1 54.5 Slaty Clay 16 Ap 6.33 0.89 31.1 25.0 43.9 Clay 17 Ap 5.59 0.90 63.7 12.5 23.8 Sandy Loam 18 Bw2 16.4 1.54 12.1 58 29.9 Clay 19 Ap 6.02 1.57 65.9 17.9 16.2 Sandy Loam 20 Ap 9.63 1.85 18.7 61.2 20.1 Clay 21 A 19.85 2.04 20.1 51.7 28.2 Clay 22 Bw1 16.3 2.04 13.9 60.3 25.9 Clay 23 A 21.14 2.06 18.2 52.2 29.5 Clay 24 Bt1 18.0 2.10 13.7 65.5 20.8 Clay 25 Ap 11.34 2.11 15.1 46.3 38.6 Clay 26 A 17.81 2.23 19.1 51.0 29.9 Clay 27 Ap 9.11 2.42 11.3 42.5 46.2 Silty Clay 28 A 18.5 3.99 13.4 57.4 29.2 Clay 29 Ap 14.9 4.25 14.2 60.5 25.3 Clay
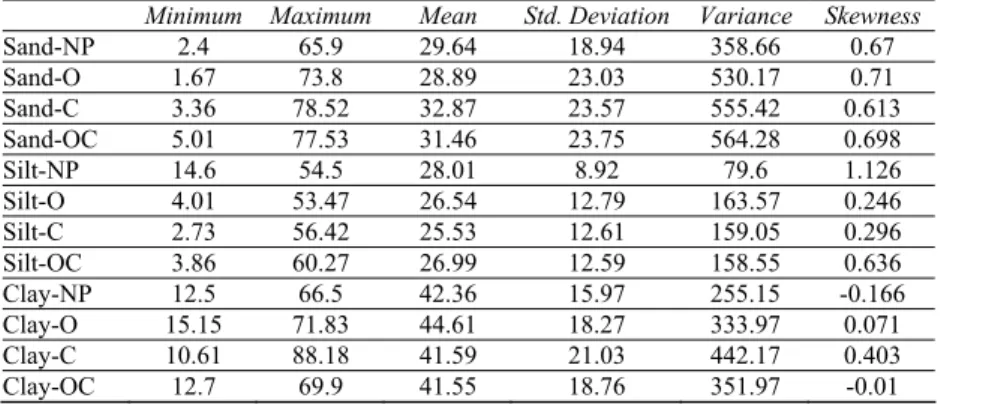
Table 2-Descriptive statistics of soil particle size distributions before and after pretreatments1 (N=29) Çizelge 2-Ön muamele öncesi ve sonrasında parçacık büyüklük dağılımlarının tanımlayıcı istatistikleri
Minimum Maximum Mean Std. Deviation Variance Skewness Sand-NP 2.4 65.9 29.64 18.94 358.66 0.67 Sand-O 1.67 73.8 28.89 23.03 530.17 0.71 Sand-C 3.36 78.52 32.87 23.57 555.42 0.613 Sand-OC 5.01 77.53 31.46 23.75 564.28 0.698 Silt-NP 14.6 54.5 28.01 8.92 79.6 1.126 Silt-O 4.01 53.47 26.54 12.79 163.57 0.246 Silt-C 2.73 56.42 25.53 12.61 159.05 0.296 Silt-OC 3.86 60.27 26.99 12.59 158.55 0.636 Clay-NP 12.5 66.5 42.36 15.97 255.15 -0.166 Clay-O 15.15 71.83 44.61 18.27 333.97 0.071 Clay-C 10.61 88.18 41.59 21.03 442.17 0.403 Clay-OC 12.7 69.9 41.55 18.76 351.97 -0.01
1 NP; no-pretreatment, O; removal of organic matter, C; removal of CaCO
3, OC; removal of organic matter and CaCO3
(Wilding and Dress 1983). Wilding and Dress (1983) indicated that CV≤ 15% is accepted as the least variability, CV between 16-35% is considered moderate variability and CV greater than 35% is reported as high variability. The CV of sand, clay, organic matter and calcium carbonates were over 35% which belonged to the strong degree of variability (Table 2).
This study results indicated that particle size distributions with removing calcium carbonate (C), organic matter (O) and both calcium carbonate and organic matter (CO) differed from those obtained by textural analysis without any pretreatment (NP) (Table 2 and Figure 1). Coefficients of variation for all textural components were increased with pretreatments. The greatest CV value for silt (from 31.85% with NP to 49.39%) and clay contents (from 37.70% with NP to 50.57%) were obtained after carbonates removal and, the highest CV for sand content (from 63.90% with NP to 79.72%) was occurred with the removal of organic matter.
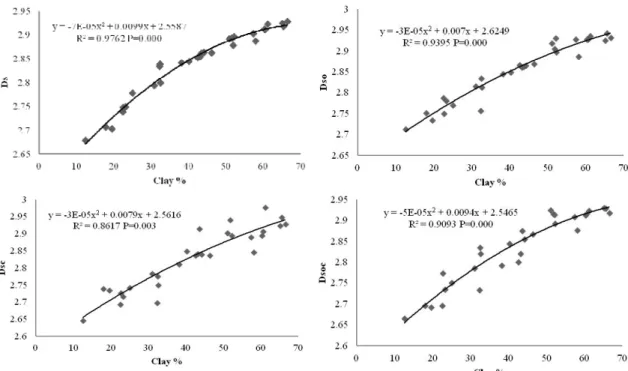
The relationships between clay contents and the fractals calculated for different pretreatments were also investigated to understand the effect of organic matter removal and calcium carbonate dissolution on the solid fractal dimension of soils (Figure 2). A second degree polynomial relationship was occurred between clay content and Ds values. Fractal behavior of clay size
particles deteriorated with the pretreatments applied and the highest relationship obtained with the regression of Ds versus non pretreated clay content in which equation explained 97.6 % of the variation in clay content (Figure 2). Ds values sharply increased with initial clay content increase and, the further increase in clay content resulted in smaller increases in Ds values. In general, greater values of Ds are associated with finer textures and smaller values are connected with coarser textures (Ersahin et al 2006). The fractal dimension values increased with clay content, and the effect of pretreatment is probably related to the removal of cementing materials between individual particles.
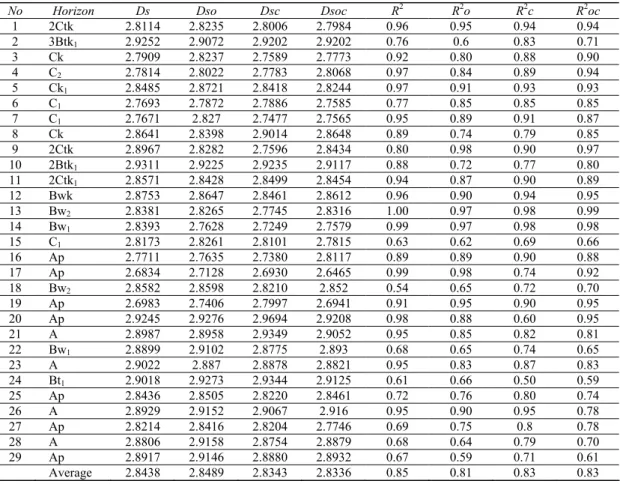
The values of Ds together with their corresponding coefficient of determinations (R2
Ds)
for treated and untreated soil samples were presented in Table 3. The Ds values for untreated samples ranged from 2.6834 to 2.9311, Dso from 2.7128 to 2.9276, Dsc from 2.6930 to 2.9694 and Dsoc from 2.6465 to 2.9208.
3.2. Effect of organic matter
Particle-size distribution measurements are strongly influenced by the experimental methods of dispersion of the soil particles. The dispersion itself can be regarded as a fragmentation process. Organic matter increases aggregate stability and hence leads to less fragmentation (Rasiah et al 1993). Therefore, organic matter removal in soils probably leads to an increase in the numbers of
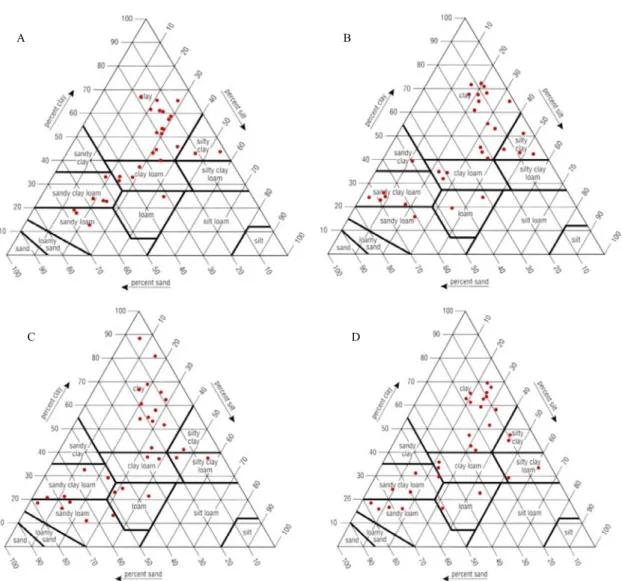
Figure 1-Distribution of soils studied within texture triangle before and after pretreatments. A: No pretreatment B: Organic matter removal C: Calcium carbonate removal D: Organic matter and Calcium carbonate removal
Şekil 1-Ön muameleler öncesi ve sonrasında toprakların tekstür üçgeni içersindeki dağılımı. A: Ön muamele yapılmadı B: Organik madde uzaklaştırması C: Kalsiyum karbonat uzaklaştırması D: Organik madde ve kalsiyum karbonat uzaklaştırması
smaller particles. The highest mean clay content (44.6%) was obtained with organic matter removal (Table 2 and Figure 1). The slight increase in coarse clay fraction was also reported by Stanchi et al (2008) who investigated the
break-up of aggregates <2 mm after applying five different chemical and physical agents.
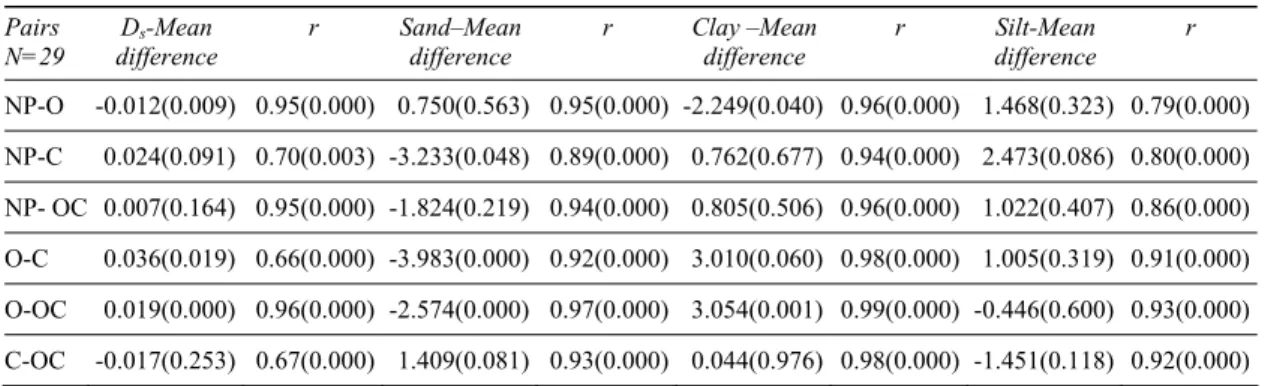
The paired t-tests of particle size distributions and fractal dimensions revealed that values of fractals obtained after organic matter removal
A B
Figure 2-Relationship between clay content and fractal dimensions for non treated, organic matter removed, calcium carbonate removed and both calcium carbonate and organic matter removed samples
Şekil 2-Muamele edilmemiş, organik madde uzaklaştırılmış, kalsiyum karbonat uzaklaştırılmış ve hem kalsiyum karbonat hem de organik madde uzaklaştırılmış örneklerin kil içerikleri ve fraktal boyutları arasındaki ilişki
(Dso) were significantly different from (P<0.05) fractals obtained after calcium carbonate removal (Dsc) and organic matter plus calcium carbonate removal (Dsoc) (P<0.01). However, the mean difference of Ds in removal of organic matter plus calcium carbonate was closer to that of organic matter removal than mean difference of calcium carbonate removal alone (Table 4). The results indicated better fragmentation of soil aggregates after destruction of soil organic binding components with hydrogen peroxide.
The difference in clay content before and after organic matter removal was significant (P<0.05), whereas the other particle size characteristics were not significantly changed. The difference in clay content probably resulted from destruction of some of the sand and silt size aggregates. The sand-sized aggregates remaining after dispersion
with sodium hexametaphosphate results in overestimation of sand content in sedimentation analysis. Schmidt et al (1999) indicated that the diameter of lignite particles, remaining even after oxidation with hydrogen peroxide, is overestimated the sand content by a factor of 1.66. Therefore, they recommended ultrasonication to disrupt sand-sized lignite particles to finer particle size fractions.
The relationship between clay content and fractal dimension calculated after removing organic matter was explained with a second degree polynomial regression, and was the equation obtained described 93% of the variation in clay content.
3.3. Effect of calcium carbonate
Table 3-Fractal dimensions (Ds)1 of particle size distributions obtained for different pretreatments,
coefficient of determinations, calcium carbonate and organic matter contents of soils
Çizelge 3-Farklı ön muamelelerde elde edilen parçacık büyüklük dağılımlarına ait fraktal boyutlar (Ds), belirleme katsayıları, toprakların kalsiyum karbonat ve organik madde içerikleri
No Horizon Ds Dso Dsc Dsoc R2 R2o R2c R2oc
1 2Ctk 2.8114 2.8235 2.8006 2.7984 0.96 0.95 0.94 0.94 2 3Btk1 2.9252 2.9072 2.9202 2.9202 0.76 0.6 0.83 0.71 3 Ck 2.7909 2.8237 2.7589 2.7773 0.92 0.80 0.88 0.90 4 C2 2.7814 2.8022 2.7783 2.8068 0.97 0.84 0.89 0.94 5 Ck1 2.8485 2.8721 2.8418 2.8244 0.97 0.91 0.93 0.93 6 C1 2.7693 2.7872 2.7886 2.7585 0.77 0.85 0.85 0.85 7 C1 2.7671 2.827 2.7477 2.7565 0.95 0.89 0.91 0.87 8 Ck 2.8641 2.8398 2.9014 2.8648 0.89 0.74 0.79 0.85 9 2Ctk 2.8967 2.8282 2.7596 2.8434 0.80 0.98 0.90 0.97 10 2Btk1 2.9311 2.9225 2.9235 2.9117 0.88 0.72 0.77 0.80 11 2Ctk1 2.8571 2.8428 2.8499 2.8454 0.94 0.87 0.90 0.89 12 Bwk 2.8753 2.8647 2.8461 2.8612 0.96 0.90 0.94 0.95 13 Bw2 2.8381 2.8265 2.7745 2.8316 1.00 0.97 0.98 0.99 14 Bw1 2.8393 2.7628 2.7249 2.7579 0.99 0.97 0.98 0.98 15 C1 2.8173 2.8261 2.8101 2.7815 0.63 0.62 0.69 0.66 16 Ap 2.7711 2.7635 2.7380 2.8117 0.89 0.89 0.90 0.88 17 Ap 2.6834 2.7128 2.6930 2.6465 0.99 0.98 0.74 0.92 18 Bw2 2.8582 2.8598 2.8210 2.852 0.54 0.65 0.72 0.70 19 Ap 2.6983 2.7406 2.7997 2.6941 0.91 0.95 0.90 0.95 20 Ap 2.9245 2.9276 2.9694 2.9208 0.98 0.88 0.60 0.95 21 A 2.8987 2.8958 2.9349 2.9052 0.95 0.85 0.82 0.81 22 Bw1 2.8899 2.9102 2.8775 2.893 0.68 0.65 0.74 0.65 23 A 2.9022 2.887 2.8878 2.8821 0.95 0.83 0.87 0.83 24 Bt1 2.9018 2.9273 2.9344 2.9125 0.61 0.66 0.50 0.59 25 Ap 2.8436 2.8505 2.8220 2.8461 0.72 0.76 0.80 0.74 26 A 2.8929 2.9152 2.9067 2.916 0.95 0.90 0.95 0.78 27 Ap 2.8214 2.8416 2.8204 2.7746 0.69 0.75 0.8 0.78 28 A 2.8806 2.9158 2.8754 2.8879 0.68 0.64 0.79 0.70 29 Ap 2.8917 2.9146 2.8880 2.8932 0.67 0.59 0.71 0.61 Average 2.8438 2.8489 2.8343 2.8336 0.85 0.81 0.83 0.83
1Ds; fractal for no-pretreatment, Dso; fractal for organic matter removal, Dsc; fractal for CaCO
3 removal, Dsoc; OM and CaCO3
removal
calculated after calcium carbonate removal were presented in Tables 2 & 3. Kerry and Oliver (2006) stated that calcium carbonate in soil is composed of mainly tiny calcite crystals which dominate the clay-sized fraction. Dispersing the soil during the pipette or hydrometer methods can result in the break-up of sand and silt size calcium carbonate fragments into smaller calcite crystals. In this case, the soil appears more clayey in texture than the soil normally is (Kerry & Oliver 2006). Dissolution of carbonates with sodium acetate buffer (buffered to pH 5 with acetic acid)
would result in decreasing the clay contents as compared to that of measured with organic matter removal and without pretreatments. Whereas, the sand contents obtained after calcium carbonate removal were relatively increased as a results of decreasing the clay content. One may expect the opposite as carbonates often act as a cementing agent to cluster smaller particle into larger units. However, Khodaverdiloo et al (2011) also reported that the sand percentage, and hence also the mean soil particle size, increased after removing CaCO3. Khodaverdiloo et al (2011)
Table 4-Paired t-tests and correlations (r=correlation coefficient) for particle size components and fractals calculated1
Çizelge 4-Parçacık büyüklüğü bileşenleri ve hesaplanan fraktal değerleri için eşleştirilmiş t-testleri ve korelasyonlar (r=korelasyon katsayısı)
Pairs N=29 Ds-Mean difference r Sand–Mean difference r Clay –Mean difference r Silt-Mean difference r NP-O -0.012(0.009) 0.95(0.000) 0.750(0.563) 0.95(0.000) -2.249(0.040) 0.96(0.000) 1.468(0.323) 0.79(0.000) NP-C 0.024(0.091) 0.70(0.003) -3.233(0.048) 0.89(0.000) 0.762(0.677) 0.94(0.000) 2.473(0.086) 0.80(0.000) NP- OC 0.007(0.164) 0.95(0.000) -1.824(0.219) 0.94(0.000) 0.805(0.506) 0.96(0.000) 1.022(0.407) 0.86(0.000) O-C 0.036(0.019) 0.66(0.000) -3.983(0.000) 0.92(0.000) 3.010(0.060) 0.98(0.000) 1.005(0.319) 0.91(0.000) O-OC 0.019(0.000) 0.96(0.000) -2.574(0.000) 0.97(0.000) 3.054(0.001) 0.99(0.000) -0.446(0.600) 0.93(0.000) C-OC -0.017(0.253) 0.67(0.000) 1.409(0.081) 0.93(0.000) 0.044(0.976) 0.98(0.000) -1.451(0.118) 0.92(0.000) 1
Values in parenthesis indicate P values
NP; no-pretreatment, O; removal of organic matter, C; removal of CaCO3, OC; removal of organic matter and CaCO3 further pointed out that determination of soil
water retention of acid-treated soil samples or removal of CaCO3 may lead to unrealistic results when used for field water management, or for agricultural or environmental modeling applications. The phenomenon was also stated in (Soil Survey Staff 2010) as “calcium carbonate particles within the clay size did not act as clay particles to retain soil water”.
Since the clay content decreased, the lowest Dsc was also obtained after removal of carbonates (Table 3). The Dsc values and sand contents after calcium carbonate removal were significantly different from those of non pretreated samples (P<0.01 and 0.05 respectively). It is clear that organic matter oxidation enhances the clay content whereas calcium carbonate dissolution decreases clay contents of soils. Therefore, the Dsc values (P<0.05) and sand contents (P<0.01) obtained after organic matter removal and calcium carbonate removal were significantly different, but not clay content (P=0.06).
A second degree polynomial regression equation successfully described the relationship between fractal dimension and clay content obtained after calcium carbonate dissolution (Figure 2). The gradually decreasing slope describes the relationship between Ds and clay
content of the soils. The results indicate a decreasing rate of contribution from fine particles to the extent of Ds (Figure 2). Ersahin et al (2006) also reported that a second degree polynomial regression equation described the relationship between fractal dimension and clay content. Tyler and Wheatcraft (1992) found Ds values getting closer to 3.0 associated with the finest textured soils.
3.4. Effect of organic matter together with calcium carbonate
The sand, clay and silt contents and Dsco values of soil samples obtained after organic matter removal plus calcium carbonate dissolution were not significantly different from those obtained for untreated soil samples. The distribution of soils within the soil texture triangle was also quite similar to the distribution obtained for untreated soils (Figure 1). Although small differences were occurred with the values, strong correlations were found between treated and non treated samples (r=0.941, 0.956, 0.863 and 0.946, respectively). However, sand and clay contents were significantly different from those obtained after single organic matter removal process (Table 4). Carbonate removal probably caused the preferential removal of carbonate particles within the clay size. Therefore, mean clay content
obtained only with organic matter removal was 44.61% and decreased to 41.55% after organic matter plus calcium carbonate removal.
The relationship between clay content and fractal dimension for organic matter removal plus calcium carbonate dissolution was also described with a second degree polynomial regression equation. The shape of the curve indicated that the relationship tends to be increased more for the first increases in clay content than the later increases (Figure 2).
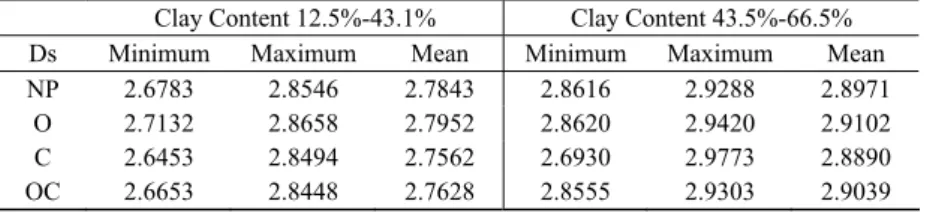
Soil samples were divided into two sub-classes based clay contents to evaluate the extent of pretreatments effects on particle size distributions and fractal dimensions. The first group soils were representing those located out of the clay in textural triangle and the second group soils were located within the clay class in textural triangle. Clay contents in the first group (N=14) ranged from 12.5% to 43.1%, and in the second group (N=15) ranged from 43.5% to 66.5%.
The mean fractal dimensions for different pretreatments were ranged from 2.7562 to 2.7952 for the first clay content group and from 2.8890 to 2.9102 for the second clay content group. The highest Ds value obtained with organic matter removal and the lowest Ds was with CaCO3 dissolution in both clay content ranges evaluated. The effect of pretreatments on Ds values in both clay ranges was similar to those obtained for the complete set of soils (Table 5).
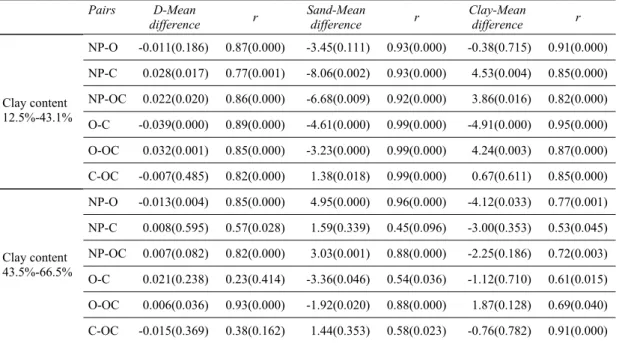
The organic matter removal significantly affected the mean fractal dimension, sand content and clay content of the second group of soils however; it did not affect any of the particle size
distribution and fractal dimension of the first group. Results indicated that organic matter removal is more effective in the soils classified within the clay group then the rest of the soils (Table 6).
On the other hand, dissolution of calcium carbonate resulted in significant differences in the fractal dimension, sand and silt contents for the first group of soils. Whereas, the effect of calcium carbonate dissolution in the second group soils was not as effective as in the first group of soils. In general, paired t-test results of the pretreatments revealed that pretreatments used alone or combination except organic matter removal alone are more effective in fragmentation in the lower clay content ranged indicated as the first group of soils.
4. Conclusions
The effect of removing organic matter and calcium carbonate dissolution of soils, which are different in pedogenesis (Entisols, Inceptisols, Mollisols, Alfisols and Vertisols), calcium carbonate (5.57-60.09%), organic matter (0.05%-4.25%) and clay content (12.5%-66.5%) on particle size distributions and fractal dimensions were investigated. Results revealed that organic matter removal enhances the aggregate fragmentation and increases clay contents of soils. The fractal dimensions occurred after organic matter removal were higher as compared to the Ds obtained for the calcium carbonate removal. Since the pedogenic carbonates in the soils are composed of fine calcite crystal sizes, particle size distributions obtained without any pretreatments
Table 5-Descriptive statistics of subdivision of soil samples based on clay contents
Çizelge 5-Kil içeriğine göre alt gruplara ayrılan toprak örneklerinin tanımlayıcı istatistikleri
Clay Content 12.5%-43.1% Clay Content 43.5%-66.5%
Ds Minimum Maximum Mean Minimum Maximum Mean
NP 2.6783 2.8546 2.7843 2.8616 2.9288 2.8971
O 2.7132 2.8658 2.7952 2.8620 2.9420 2.9102
C 2.6453 2.8494 2.7562 2.6930 2.9773 2.8890
OC 2.6653 2.8448 2.7628 2.8555 2.9303 2.9039
NP; no-pretreatment, O; removal of organic matter, C; removal of CaCO3,
Table 6-Paired t-tests of particle size components and fractals calculated for the subdivisions based on clay content1
Çizelge 6-Kil içeriğine göre alt grupların parçacık büyüklük bileşenleri ve fraktal değerlerinin eşleştirilmiş t-testleri Pairs D-Mean difference r Sand-Mean difference r Clay-Mean difference r NP-O -0.011(0.186) 0.87(0.000) -3.45(0.111) 0.93(0.000) -0.38(0.715) 0.91(0.000) NP-C 0.028(0.017) 0.77(0.001) -8.06(0.002) 0.93(0.000) 4.53(0.004) 0.85(0.000) NP-OC 0.022(0.020) 0.86(0.000) -6.68(0.009) 0.92(0.000) 3.86(0.016) 0.82(0.000) O-C -0.039(0.000) 0.89(0.000) -4.61(0.000) 0.99(0.000) -4.91(0.000) 0.95(0.000) O-OC 0.032(0.001) 0.85(0.000) -3.23(0.000) 0.99(0.000) 4.24(0.003) 0.87(0.000) Clay content 12.5%-43.1% C-OC -0.007(0.485) 0.82(0.000) 1.38(0.018) 0.99(0.000) 0.67(0.611) 0.85(0.000) NP-O -0.013(0.004) 0.85(0.000) 4.95(0.000) 0.96(0.000) -4.12(0.033) 0.77(0.001) NP-C 0.008(0.595) 0.57(0.028) 1.59(0.339) 0.45(0.096) -3.00(0.353) 0.53(0.045) NP-OC 0.007(0.082) 0.82(0.000) 3.03(0.001) 0.88(0.000) -2.25(0.186) 0.72(0.003) O-C 0.021(0.238) 0.23(0.414) -3.36(0.046) 0.54(0.036) -1.12(0.710) 0.61(0.015) O-OC 0.006(0.036) 0.93(0.000) -1.92(0.020) 0.88(0.000) 1.87(0.128) 0.69(0.040) Clay content 43.5%-66.5% C-OC -0.015(0.369) 0.38(0.162) 1.44(0.353) 0.58(0.023) -0.76(0.782) 0.91(0.000) 1
Values in parenthesis indicate P values
NP; no-pretreatment, O; removal of organic matter, C; removal of CaCO3, OC; removal of organic matter and CaCO3 overestimate the clay content of soils. The nature
of fine calcite crystals do not resemble to clay particles, therefore if the soil contains CaCO3, particle size distributions should be determined after CaCO3 dissolution. Since the behavior of carbonates within the clay size from water holding point of view is similar to the silt fraction, removing the clay size carbonates results in obtaining unrealistic results particularly for determination of soil water retention. Therefore, carbonates should not be removed if water holding capacity of soils are going be used for field water management, or for agricultural or environmental modeling applications. The combined effects of increasing clay content with organic matter removal due to the better fragmentation and dissolution of clay sized calcite crystals after NaOAc pretreatments resulted in similar particle size distributions and fractal
dimension values to those obtained for non pretreated samples.
References
Bittelli M, Campbell G S & Flury M (1999). Characterization of particle-size distribution in soils with a fragmentation model. Soil Science Society of American Journal 63:782-788
Bronick C J & Lal R (2005). Soil structure and management: A review. Geoderma 124:3-22 Ersahin S, Gunal H, Yetgin B, Kutlu T & Coban S
(2006). Estimating specific surface area and cation exchange capacity in soils with fractal dimension of particle-size distribution. Geoderma 136(3,4): 588-597
Eshel G, Levy J, Mingelgrin U & Singer M J (2004). Critical evaluation of the use of laser diffraction for particle-size distribution analysis. Soil Science Society of American Journal 68:736-743
Feller C, Schouller E, Thomas F, Rouiller J & Herbillon A J (1992). N2-BET specific surface areas of some
low activity clay soils and their relationships with secondary constituents and organic matter contents. Soil Science 153:293-299
Filgueira R R, Pachepsky Y A & Fournier L L (2003). Time-mass scaling in soil texture analysis. Soil Science Society of American Journal 67(6):1703-1706
Filgueira, R R, Fournier L L, Cerisola C I, Gelati P & Garcia M G (2006). Particle-size distribution in soils: a critical study of the fractal model validation. Geoderma 134:327-334
Gee G W & Bauder J W (1986). Particle size analysis. In: Methods of Soil Analysis. A. Klute (Ed), Part 1, 2nd ed. Agronomy No. 9. American Society of Agronomy, Madison, WI, pp. 825-844
Hesse P R (1976). Particle size distribution in gypsic soils. Plant and Soil 44:241-247
Jin Z, Dong Y S, Qi Y C, Liu W G & An Z S (2011). Characterizing variations in soil particle size distribution along a grass–desert shrub transition in the ordos plateau of inner Mongolia, China. Land Degradation and Development. DOI: 10.1002/ldr.1112
Kerry R & Oliver M A (2006). How should soil texture be determined for chalk soil? 18th World Congress of Soil Science. July 5-9, 2006. Philadelphia, PA, USA
Khodaverdiloo H, Homaee M, van Genuchten M T & Dashtaki S G (2011) Deriving and validating pedotransfer functions for some calcareous soils. Journal of Hydrology 399:93-99
Kleinbaum D G, Kupper L L & Muller K E (1988). Applied Regression Analysis and Other Multivariable Methods. Second Edition, Duxbury Press. Belmont, CA. USA
Leifeld J & Kögel-Knabner I (2003). Microaggregates in agricultural soils and their size distribution determined by X-ray attenuation. European Journal of Soil Science 54:167-174
Nelson D W & Sommers L E (1982). Total carbon, organic carbon, and organic matter. In: Methods of Soil Analysis. Page, A.L. (Ed) Part 2, 2nd ed. Agron. Monogr. 9. ASA. And SSSA, Madison, WI, pp. 539-579
Perfect E & Kay B D (1991). Fractal theory applied to soil aggregation. Soil Science Society of American Journal 55:1552-1558
Posadas A N D, Gimenez D, Bittelli M, Vaz C M P & Flury M (2001), Multifractal characterization of soil particle-size distributions. Soil Science Society of
American Journal 65:1361-1367
Rasiah V, Kay B D & Perfect E (1993), New mass-based model for estimating fractal dimensions of soil aggregates. Soil Science Society of American Journal 57:891-895
Schmidt M W I, Rumpel C & Koegel-Knabner I (1999). Particle size fractionation of soil containing coal and combusted particles. European Journal of Soil Science 50:515-522
Schultz M K, Biegalski S R, Inn K G W, Yu L, Burnett W C, Thomas L J W & Smith G E (1999). Optimizing the removal of carbon phases in soils and sediments for sequential chemical extractions by coulometry. Journal of Environmental Monitoring 1:183-190
Soil Survey Division Staff (1993). Soil Survey Division Staff. 1993. Soil Survey Manual. USDA Handbook 18. United States Government Print Office, Washington, DC. USA
Soil Survey Staff (2010). Keys to Soil Taxonomy. 11th ed., USDA National Resources Conservation Service, Washington, DC. USA http://soils.usda.gov/technical/
classification/tax_keys/
Stanchi S E, Bonifacio E Z & Perfect E (2008). Chemical and physical treatment effects on aggregate breakup in the 0- to 2-mm size range. Soil Science Society of American Journal 72(5):1418-1421
Stanchi S, Bonifacio E Z & Pachepsky E Y (2006). Fractal behavior in particle-size distributions as influenced by soil properties and determination method. Soil Science 171(4):283-292
Tisdall JM (1996). Formation of soil aggregates and accumulation of soil organic matter. In: Carter, MR., Stewart, B.A. (Eds.), Structure and Organic Matter Storage in Agricultural Soils. Lewis Publishers, Boca Raton, FL, pp. 57-96
Tyler S W & Wheatcraft S W (1992). Fractal scaling of soil-particle size distributions: Analysis and Limitations. Soil Science Society of American Journal 56:362-369
Wilding L P, & Dress L R (1983). Spatial variability in pedology In L.P. Wilding et al. (ed). Pedogenesis and soil taxonomy. I: concepts and interactions. Elseveir, New York, p. 83-116
Wu Q, M Borkovec, & Sticher H (1993). On particle-size distribution in soils. Soil Science Society of American Journal 57:883-890