Dergi web sayfası:
www.agri.ankara.edu.tr/dergi www.agri.ankara.edu.tr/journalJournal homepage:
TARIM BİLİMLERİ DERGİSİ
—
JOURNAL OF AGRICUL
TURAL SCIENCES
18 (2012) 257-262
Relationships among Yield Components and Selection Criteria for Seed
Yield Improvement in Bush Bean (Phaseolus vulgaris L.)
Haluk KULAZa, Vahdettin ÇİFTÇİa
a Yüzüncü Yıl University, Faculty of Agriculture, Department of Field Crops, Van, TURKEY ARTICLE INFO
Research Article ‒ Crop Production
Corresponding Author: Haluk KULAZ, E-mail: [email protected], Tel: +90 (432) 2251068 Received: 3 June 2009, Received in Revised Form: 10 June 2012, Accepted: 15 March 2013
ABSTRACT
The aim of this research is to determine the relationship among yield and some yield components of dry bean using correlation and path coefficient analysis. The experiment was carried out in irrigated conditions during 2004-2005 and 2005-2006 at the East of Turkey (Van-Gevaş ecological conditions). In this study, 12 dry bean cultivars were used. The experiment was designed in a complete randomized block design with three replications. Positively significant relationships were found among seed yield and biological yield per unit and seed yield per plant, number of branches per plant, number of pods per plant. According to path coefficient analysis, there were strong direct effects of the biological yield, 1000-seed weight, seed yield per plant, plant height and number of seeds per plant respectively.
Keywords: Dry bean; Path coefficient; Phenotypic correlation; Seed yield; Yield components
Kuru Fasulye’de (Phaseolus vulgaris L.) Tohum Verimi Artışı için
Seleksiyon Kriterleri ve Verim Arasındaki İlişkiler
ESER BİLGİSİ
Araştırma Makalesi ‒ Bitkisel Üretim
Sorumlu Yazar: Haluk Kulaz, E-posta: [email protected], Tel: +90 (432) 2251068 Geliş Tarihi: 3 Haziran 2009, Düzeltmelerin Gelişi: 10 Haziran 2012, Kabul: 15 Mart 2013
ÖZET
Bu araştırmanın amacı, iz-katsayısı analizive kısmi korelasyon katsayıları kullanarak kuru fasulyenin verim ve bazı verim bileşenleri arasındaki sebep-sonuç ilişkilerini saptamaktır. Araştırma, Türkiye’nin doğusunda (Van-Gevaş ekolojik koşullarında) 2004-2005 ve 2005-2006 yıllarında sulu koşullarda yürütülmüştür. Çalışmada 12 fasulye çeşidi materyal olarak kullanılmıştır. Deneme, tesadüf blokları deneme desenine göre 3 tekerrürlü olarak yürütülmüştür. Tohum verimi ile birim alan biyolojik verim, bitkide tane verimi, bitkide dal sayısı ve bitkide bakla sayısı arasında olumlu ve önemli ilişkiler bulunmuştur. İz-Katsayısı analizine göre, tohum verimi üzerine sırasıyla biyolojik verim, 1000 tane ağırlığı, bitkide tane verimi, bitki boyu ve bitkide tane sayısının doğrudan etkileri yüksek olmuştur.
Anahtar Kelimeler: Kuru Fasulye; Path analizi; Fenotipik korelasyon; Tohum verimi; Verim bileşenleri
Relationships among Yield Components and Selection Criteria for Seed Yield Improvement in Bush Bean (Phaseolus vulgaris L.), Kulaz & Çiftçi
1. Introduction
Dry bean (Phaseolus vulgaris L.), also called as French bean, common bean, kidney bean etc., is one of the most important legume crops in the world. It is grown on 129000 ha and its production exceeds 195970 tones in Turkey. However, national yields have been stagnant at 1520 kg ha-1 on average (TUIK,
2006). Yield in dry bean like other crops, is a complex characteristic associated with many morphological and physiological characteristics constitute it. Generally, correlation coefficients show relationships among independent characteristics and the degree of linear relation between these characteristics. However, path analysis is needed to clarify relationships between characteristics deeply because correlation coefficients describe relationships in a simple manner (Korkut et al 1993). Path coefficient analysis separates the direct effects from the indirect effects through other related characteristics by partitioning the correlation coefficient (Dixed & Dubey 1984). Most of the traits that breeders are interested in are complex and are the results of a number of components’ interactions. Understanding the relationship between yield and its components is of paramount importance for making the best use of these relationships in selection (Sarawgi et al 1997). The path coefficient is known as a standardized partial-regression coefficient and separates the direct and indirect effects of a correlation coefficient. Hence, path analysis plays an important role in determining the degree of relationship between yield and yield components.
The path coefficient analysis helps the breeders to explain direct and indirect effects and hence has extensively been used in breeding experiments in different crop species by various researchers (Shalini et al 2000; Ali et al 2002; Ali et al 2003; Akbar et al 2003). Most of the time, the total relationship among yield and the traits that affect yield make not much sense because the yield is a quantitative trait affected by environmental factors as well as direct and indirect effects of a large number of traits. While a trait has high total relationship with total grain yield, the same trait may have a low direct impact on grain yield (Çiftçi et al 1998). For example, in lentil,
although the number of leaves has significantly higher total relationship with grain yield, a direct effect of the same property on grain yield has been very low (Dixet & Dubey 1984). On the other hand, although the thousand grain weight has low total relationship with grain yield, a direct effect of the same property on grain yield has been high (Butter & Sharma 1990). As it seen, it is very important to know the direct and indirect effects of other traits on grain yield as well as the total relationship between grain yield and other traits.
Success in crop breeding also depends on the isolation of genetically superior genotypes based on the amount of variability present in the materials. Therefore, information on genetic variability existed in a group of populations of dry bean are essential (Raffi & Nath 2004).
Many breeders were involved in analyzing the path coefficient. Usefulness of information obtained from correlation can be enhanced by partitioning them into direct and indirect effects for a set of prior cause-and-effect interrelationships (Kang et al 1983; Gravois & McNew 1993). Many studies have been carried out on variability and interrelationships of characteristics on dry bean (Vaid et al 1986; Singh et al 1994; Ribeiro et al 2000; Ria et al 2001)..
In this study, relationships between yield and yield components were examined to determine the association of seed yield with its components and some traits related to plant developmental by using correlation and path coefficient analysis.
2. Material and Methods
This study was carried out in irrigated conditions during 2004-2005 and 2005-2006 at the East of Turkey (38 0 18′N, 43 0 07′ E, 14.6 oC mean
temperature, average rainfall 378.4 mm). Soil of experimental field has sandy-loam-clay structure, and shows slight alkalinity (pH = 7.6). Soil of experimental field is also poor in organic matter (2.3%), rich in potassium (553 kg ha-1), but
inadequate in terms of phosphorus (27 kg ha-1).
Moreover, salt and lime contents of soil were determined as 0.042% and 9%, respectively.
The experimental study was conducted using 12 bean cultivars. Eleven of them are registered cultivars and one of them is local cultivar in Turkey. The registered cultivars are Terzibaba, Aras-98, Şeker, Yakutiye-98, Yunus-90, Karacaşehir-90, Önceler-98, Noyanbey-98, Göynük-98, Akman-98 and Şehirali-90. The field experiment was established in a complete randomized block design with three
replications. Each plot was 10 m2 (4 x 2.5 m) and
planted with 50 x 10 cm row spacing (approximately
20 seeds/m2) in early May in each test year. Equal
amount of DAP (Diammonium phosphate) fertilizer
(140 kg ha-1) was applied to all plots during sowing.
Rows were determined with a marker and then seeds were sown by hand in rows 5-6 cm deepened by a hoe. During the experiment, plants were watered as needed and hoeing was applied for weed control. There was no chemical pest control. Based on the maturation time, harvest started in early August and lasted for about a month. Characteristics of each
bean cultivar was examined on ten plants randomly
selected in the mid-rows of plots. Seed yield (kg ha
-1), plant height (cm), biological yield (kg ha-1), seed
yield (g/plant), number of pods per plant, number of branches per plant, number of seeds per plant, number of seeds per pod and 1000-seed weight were recorded. Phenotypic correlations between examined characteristics were calculated in the usual manner and path coefficient analysis was carried out using Dewey & Lu (1959) method. The path coefficient is known as a standardized partial-regression coefficient and separates the direct and indirect effects of a correlation coefficient. Hence, path analysis plays an important role in determining the degree of relationship between yield and yield components.
3. Results and Discussion
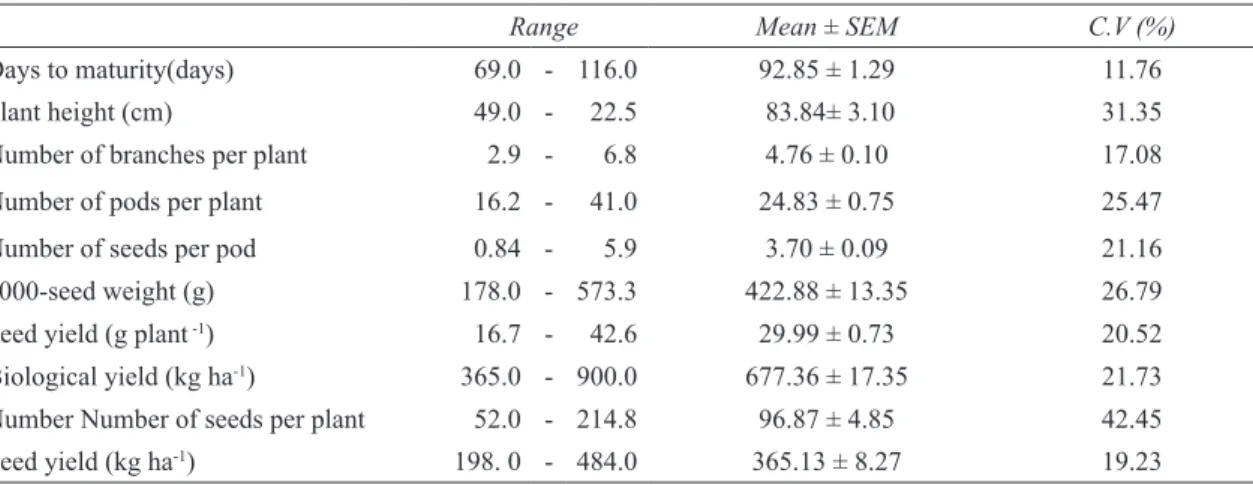
Range values and mean values with their standard errors, mean squares and CV levels are summarized in Table 1.
Table 1- Range phenotypic variability, mean values with standard error and CV values in 12 dry beans (Phaseolus vulgaris L.) cultivars
Çizelge 1- On iki kuru fasulye (Phaseolus vulgaris L.) çeşidinde fenotipik değişkenlik aralığı, ortalama değerler ile standart hata ve CV değerleri
Range Mean ± SEM C.V (%)
Days to maturity(days) 69.0 - 116.0 92.85 ± 1.29 11.76
Plant height (cm) 49.0 - 22.5 83.84± 3.10 31.35
Number of branches per plant 2.9 - 6.8 4.76 ± 0.10 17.08
Number of pods per plant 16.2 - 41.0 24.83 ± 0.75 25.47
Number of seeds per pod 0.84 - 5.9 3.70 ± 0.09 21.16
1000-seed weight (g) 178.0 - 573.3 422.88 ± 13.35 26.79
Seed yield (g plant -1) 16.7 - 42.6 29.99 ± 0.73 20.52
Biological yield (kg ha-1) 365.0 - 900.0 677.36 ± 17.35 21.73
Number Number of seeds per plant 52.0 - 214.8 96.87 ± 4.85 42.45
Seed yield (kg ha-1) 198. 0 - 484.0 365.13 ± 8.27 19.23
The direct and indirect effect values from path analysis are shown in Table 2. Path analysis showed the highest positive direct effect of biological yield per unit area (P=0.720). This was followed by 1000-seed weight (P=0.576), seed yield per plant
(P=0.280), plant height (P=0.204), number of seeds per plant (P=0.178) and number of pods per plant (P=0.052). The results were more or less similar with the observations of Coimbra et al (1999), Babar et al (2002), and Raffi & Nath (2004).
Relationships among Yield Components and Selection Criteria for Seed Yield Improvement in Bush Bean (Phaseolus vulgaris L.), Kulaz & Çiftçi
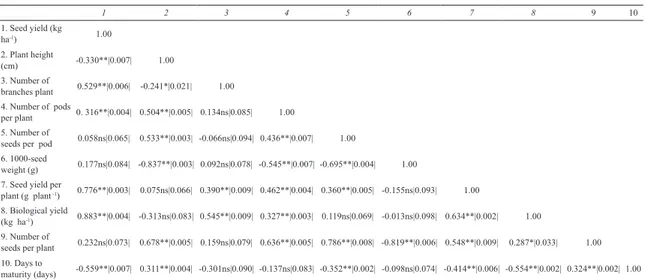
Simple correlation coefficients calculated among the examined characteristics are given in Table 3 and Figure 1. Significant positive correlations were found between seed yield and biological yield (r = 0.883; P≤0.01), seed yield per plant (r = 0.776 ; P≤0.01), number of branches (r = 0.529 ; P≤0.01) and number of pods per plant (r= 0.316; P≤0.01). The relationships between seed yield and number of seed per plant (r= 0.232; P:|ns|), 1000-seed
weight (r= 0.177; P:|ns|) and number of seeds per pod (r= 0.058; P:|ns|) were found positive but not significant. The relationships between seed yield and days to maturity (r= -0.559; P≤0.01) and plant height (r= -0.330; P≤0.01) were found negative and highly significant. These results confirm the findings of Pekşen & Gülümser (2005) and Golpalvar & Ghasemi-pirbalouti (2006).
Table 2- Phenotypic path coefficient shoving direct or indirect effects of different components on seed yield. Çizelge 2- Tohum verimi üzerine farklı komponentlerin doğrudan ya da dolaylı etkilerini gösteren fenotipik path katsayısı
Characteristics Indirect Effects Total effect
Plant height (cm) (0.204) 0.002 0.026 -0.001 -0.482 0.021 -0.225 0.121 0.003 -0.330** Number of branches plant-1 -0.049 (-0.009) 0.007 0.000 0.053 0.109 0.393 0.028 -0.003 0.529**
Number of pods per plant-1 0.103 -0.001 (0.052) -0.001 -0.314 0.129 0.236 0.113 -0.002 0.316**
Number of seeds per pod-1 0.113 0.001 0.023 (-0.001) -0.401 0.101 0.086 0.140 -0.004 0.058
1000-seed weight (g) -0.171 -0.001 -0.029 0.001 (0.576) -0.043 -0.009 -0.146 -0.001 0.177 Seed yield (g plant -1) 0.015 -0.004 0.024 -0.001 -0.089 (0.279) 0.457 0.098 -0.005 0.776**
Biological yield (kg ha-1) -0.064 -0.005 0.017 -0.001 -0.008 0.177 (0.720) 0.051 -0.006 0.883**
Number of seeds per plant-1 0.138 -0.001 0.033 -0.001 -0.472 0.153 0.206 (0.178) -0.004 0.232
Days to maturity (days) 0.064 0.003 -0.007 0.001 -0.057 -0.116 -0.399 -0.577 (0.011) -0.559 ** Significant at 1 % level of P. Figures in parentheses are direct effect on seed yield.
Table 3- Phenotypic correlation coefficient among the characteristics 12 dry bean (Phaseolus vulgaris L.) cultivars n=72
Çizelge 3- On iki kuru fasulye (Phaseolus vulgaris L.) çeşidi özellikleri arasındaki fenotipik korelasyon katsayısı n=72
1 2 3 4 5 6 7 8 9 10 1. Seed yield (kg ha-1) 1.00 2. Plant height (cm) -0.330**|0.007| 1.00 3. Number of branches plant 0.529**|0.006| -0.241*|0.021| 1.00 4. Number of pods per plant 0. 316**|0.004| 0.504**|0.005| 0.134ns|0.085| 1.00 5. Number of
seeds per pod 0.058ns|0.065| 0.533**|0.003| -0.066ns|0.094| 0.436**|0.007| 1.00 6. 1000-seed
weight (g) 0.177ns|0.084| -0.837**|0.003| 0.092ns|0.078| -0.545**|0.007| -0.695**|0.004| 1.00 7. Seed yield per
plant (g plant -1) 0.776**|0.003| 0.075ns|0.066| 0.390**|0.009| 0.462**|0.004| 0.360**|0.005| -0.155ns|0.093| 1.00
8. Biological yield
(kg ha-1) 0.883**|0.004| -0.313ns|0.083| 0.545**|0.009| 0.327**|0.003| 0.119ns|0.069| -0.013ns|0.098| 0.634**|0.002| 1.00
9. Number of
seeds per plant 0.232ns|0.073| 0.678**|0.005| 0.159ns|0.079| 0.636**|0.005| 0.786**|0.008| -0.819**|0.006| 0.548**|0.009| 0.287*|0.033| 1.00 10. Days to
maturity (days) -0.559**|0.007| 0.311**|0.004| -0.301ns|0.090| -0.137ns|0.083| -0.352**|0.002| -0.098ns|0.074| -0.414**|0.006| -0.554**|0.002| 0.324**|0.002| 1.00
Kuru Fasulye’de (Phaseolus vulgaris L.) Tohum Verimi Artışı için Seleksiyon Kriterleri ve Verim Arasındaki İlişkiler, Kulaz & Çiftçi
A positive significant correlation among plant height, number of pods per plant (r=0.504, P≤0.01), and number of seeds per pod (r= 0.533, P≤0.01) was found whereas a negative significant correlation between 1000 grain weight (r= -0.837, P≤0.01) was found; also, a negative insignificant correlation with biological yield (r= - 0.313, P:|ns|) was found. Our observations and results partially show agreement with those found by Kumar et al (1983), Balyan & Singh (1989), Ramgry et al (1989) and Lauthra & Sharma (1990). Possivite significant correlation between number of branch plant, biological yield (r= 0.545, P≤0.01) was found . Whereas there was a positive insignificant correlation among number of pods per plant ( r=0.134, P:|ns|), 1000 seed weight (r= 0.092, P:|ns|), number of pods per plant (r=0.159, P:|ns|). These results show coherence with those found by Pekşen & Gülümser (2005) and Galpalvar & Ghasemi-pirbalouti (2006).
A positive significant correlation among number of seeds per pod (r= 0.436, P≤0.01), biological yield (r= 0.327, P≤0.01) and number of seeds per plant (r= 0.636, P≤0.01) whereas there was a negative significant correlation between 1000 seed weight and number of pods per plant (r= -0.545, P≤0.01).
Luthra & Sharma (1990) also found negative significant correlation between 1000 seed weight and number of seed per pod. The other results obtained in our investigations were found to be similar with those found by Balyan & Singh (1986), Ramgry et al (1989) and Kumar et al (1993).
4. Conclusions
In conclusion, determining the linear relations (correlations) among components affecting seed yield was insufficient to indicate selection criteria in dry bean breeding activities. Also, it is essential to determine the levels of direct and indirect effects of the causal components.
According to the results of the study, the biological yield per unit area, 1000 - grain weight, plant grain yield, plant height and number of seeds per plant had high direct effects on grain yield; therefore it can be concluded that these traits are important in dry bean selection breeding.
These results with the above information revealed that biological yield, 1000-seed weight, seed yield per plant, plant height and number of seeds plant and number of pods plant were related
6
Figure 1. Phenotypic Path Diagram among the characteritics 12 dry bean (Phaseolus vulgaris L.) cultivars n=72 Şekil 1. On iki kuru fasulye ((Phaseolus vulgaris L.) çeşidi özellikleri arasındaki fenotipik Path Diyagramı n=72
YP PH NBP NPP NSP SW SYP BY NSPP DM r =0 .32 4 r =0 .55 4 r =0 .28 7 r = - 0 .41 4 r =0 .54 8 r =0 .63 4 r = -0 .81 9 r = -0 .35 2 r =0 .87 6 r =0 .36 0 r = -0 .69 5 r =0 .63 6 r=0.3 27 r=0.4 62 r= -0 .54 5 r=0.4 36 r=0.5 45 r =0 .39 0 r= 0.31 1 r =0 .67 8 r= -0 .83 7 r =0 .53 3 r =0 .50 4 r =0 .24 1 PH: Plant height
NBP: Number of branches per plant NPP: Number of pods per plant NSP: Number of seeds per pod
SW: 1000-seed weight SYP: Seed yield plant BY: Biological yield
NSPP: Number of seeds per plant DM: Days to maturity
Figure 1- Phenotypic Path Diagram among the characteritics 12 dry bean (Phaseolus vulgaris L.) cultivars n=72 Şekil 1-On iki kuru fasulye ((Phaseolus vulgaris L.) çeşidi özellikleri arasındaki fenotipik Path Diyagramı n=72
Relationships among Yield Components and Selection Criteria for Seed Yield Improvement in Bush Bean (Phaseolus vulgaris L.), Kulaz & Çiftçi
to the yield mostly through their direct effects and warrants their possible use in selections for future yield improvement programs in dry bean.
References
Akbar M, Tariq M, Yaqub M, Anwar M, Ali M & Iqbal N (2003). Variability, correlation and path coefficient studies in summer mustard (Brassica juncea L.).
Asian Journal of Plant Science 2(9):696-698
Ali N, Javaidfar F & Attary A A (2002). Genetic variability, correlation and path analysis of yield and its components in winter rapeseed (Brassica napus L.). Pakistan Journal of Botany 34(2): 145-150 Ali, N, Farzad J, Jaferieh Y E & Mırza M Y (2003).
Relationship among yield components and selection criteria for yield improvement in winter rapeseed (Brassica napus L.). Pakistan Journal of Botany
35(2):167-174
Balyan H S & Singh H (1989). Character association in lentil. Lens newsletter 13 (1):1-3
Babar M A, Newaz M A & Jahan M A H S (2002). Identification of selection parameters for yieldimprovement in french bean (Phaseolus vulgaris L.). Bangladesh Journal of Agricultural Science 29: 85-89
Coimbra J L M, Guidolin A F, de Carvalho F I F, Coimbra S M M & Marchioro V S (1999). Path analysis. I: Analysis of the yield of grains and its components.
Ciencia Rural 29: 213-218
Çiftçi V, Kulaz H, Geçit H H (1998). Mercimekte (Lens
culinaris L. Medic) özellikler arası ilişkiler ve path
katsayısı analizi üzerine bir araştırma. Tarım Bilimleri
Dergisi 4(1) 8-11
Dewey D R & Lu K H (1959). A correlation and path coefficient analysis of components of crested wheat grass seed production. Agronomy Journal 51: 515–18 Dixet P & Dubey D K (1984). Path analysis in Lentil
(Lens culinaris Med.). Lens Newsletter 11(2):15-17 Golpalvar A R & Ghasemi-pirbalouti A (2006). Indirect
selection for genetic improvement of seed yield and biological nitrogen fixation in Iranian common bean genotypes (Phaseolus vulgaris L.). Pakistan Journal
of Biological Sciences 9(11): 2097-2101
Gravois K A & McNew. R W. (1993). Genetic relationships among and selection for rice yield and yield components. Crop Science 33: 249-252 Kang M S, Miller J D & Tai P Y P. (1983). Genetic and
phenotypic path analysis and heritability in sugarcane.
Crop Science 23: 643-647
Korkut Z K, Başer İ & Bilir S (1993). The studies path coefficient and correlation of drum wheat’s. Symposium of Drum Wheat and Its Products, Ankara, pp 183–187
Kumar B, Mehra K L & Sapra R (1983). An investigation on correlation pattern among yield components in lentil. Lens newsletter 10(2): 10-12
Luthra S K & Sharma P C (1990). Corelation and path analysis in lentil. Lens Newsletter 17 (2): 5-8 Pekşen E & Gülümser A (2005). Relationships between
seed yield and yield components and path analyses in some common bean (Phaseolus vulgaris L.) genotypes. Ondokuz Mayıs University Journal of
Faculty of Agriculture 20(3):82-87
Raffi S A & Nath U K (2004). Variability, heritability, genetic advance and relationships of yield and yield contributing characters in dry bean (Phaseolus
vulgaris L.). Journal of Biological Sciences 4(2):
157-159
Rai N, Yadav D S, Yadav R K & Patel R K (2001). Variability, correlation and path-coefficient analysis in between seed morphology and seedling growth in French bean. Journal of Assam Science Society 42: 40-43.
Ramgiry S R, Paliwal K K & Tomar S K (1989). Variability and correlations of grain yield and other quantitative characters in lentil. Lens newsletter 16(1):19-21 Ribeiro, N D, Mello R M & Storck L (2000). Variability
and interrelation of morphological characteristics of seeds at commercial bean groups. Revista Brasileira
de Agrociencia 6: 213-217
Sarawgi A K, Rastogi N K & Soni D K (1997). Correlation and path analysis in rice accessions from Madhya Pradesh. Field Crops Research 52: 161-167
Shalini S, Sheriff R A, Kulkarni R S & Venkantarmana P (2000). Correlation and path analysis of Indian mustard germplasm. Research on Crops in India 1(2): 226-229
Singh DN, Nandi A & Tripathy P (1994). Genetic variability and character association in French bean (Phaseolus vulgaris). Indian Journal of Agricultural
Science 64: 114-116
TUIK (2006). Tarımsal Yapı. http://www.tuik.gov.tr/ bitkiselapp/bitkisel.zul
Vaid K, Singh R M & Gupta V P (1986). Interrelationship of yield and its component characters in dry beans (Phaseolus vulgaris L.). Crop Improvement 13: 164-167