ISSN: 0163-5581 print / 1532-7914 online DOI: 10.1080/01635581.2014.894099
Therapeutic Potential of Apigenin, a Plant Flavonoid,
for Imatinib-Sensitive and Resistant Chronic Myeloid
Leukemia Cells
Soner Solmaz
Department of Hematology, Adana Teaching and Medical Research Center, Baskent University, Adana, Turkey
Aysun Adan Gokbulut
Department of Molecular Biology and Genetics, ˙Izmir Institute of Technology, ˙Izmir, Turkey
Birsu Cincin
Department of Molecular Medicine, Institute of Experimental Medical Research, Istanbul University, Istanbul, Turkey
Hakan Ozdogu and Can Boga
Department of Hematology, Adana Teaching and Medical Research Center, Baskent University, Adana, Turkey
Bedia Cakmakoglu
Department of Molecular Medicine, Institute of Experimental Medical Research, Istanbul University, Istanbul, Turkey
Ilknur Kozanoglu
Cell Processing Unit, Adana Adult Bone Marrow Transplantation Center, Baskent University, Adana, Turkey and Department of Physiology, Medical Faculty, Baskent University, Ankara, Turkey
Yusuf Baran
Department of Molecular Biology and Genetics, ˙Izmir Institute of Technology, ˙Izmir, Turkey
Despite the presence of many therapeutic regimens like ima-tinib and other tyrosine kinase inhibitors, the development of resis-tance, intolerance, and side effects makes chronic myeloid leukemia (CML) therapy challenging. Thus, there is a need to discover novel drugs for CML patients. In this study, we attempted to assess apigenin, a common plant dietary flavonoid, in terms of its cyto-toxic, apoptotic, and cytostatic effects on imatinib-sensitive and resistant Philadelphia-positive CML cells. We analyzed apigenin’s effects on cell proliferation, apoptosis, caspase-3 activity, loss of mitochondrial membrane potential, and cell cycle progression in K562 and K562/IMA3 cells. Furthermore, we described genes and
Submitted 17 July 2013; accepted in final form 20 November 2013. Address correspondence to Yusuf Baran, ˙Izmir Institute of Tech-nology, Department of Molecular Biology and Genetics, 35430 Urla, ˙Izmir, Turkey. Phone:+ 90 232 7507315. Fax: + 90 232 7507302. E-mail: [email protected]
gene networks that are modulated in CML in response to apigenin. Results of our study revealed that apigenin has cytotoxic and apop-totic effects on both cell types. We also displayed that apigenin in-duced G2/M arrest in K562 cells while arresting K562/IMA3 cells in S phase especially at the highest apigenin concentration. The expression analysis identified a set of genes that were regulated by apigenin in K652 and K562/IMA3 cells. Association of mod-ulated genes with biological functional groups identified several networks affected by apigenin including cell survival, prolifera-tion, cell death, cell cycle, and cell signalling pathways.
INTRODUCTION
Chronic myeloid leukemia (CML), a hematological disor-der, is defined by a reciprocal translocation between the break-point cluster (BCR) gene on chromosome 22 and the abelson leukemia virus oncogene (ABL) gene on chromosome 9 (1). BCR-ABL1 fusion gene encoding the chimeric BCR-ABL1 599
oncoprotein with constitutive tyrosine kinase activity has been generated as a molecular consequence of this translocation (1). The exact role of BCR-ABL protein in myeloid proliferation and transformation in CML has been studied in several in vivo and in vitro models of tumor development (2). Oncogenic BCR-ABL has been shown to possess antiapoptotic activity (3). BCR-ABL triggers the activation of many signaling pathways by inter-acting with several effector molecules and promotes prolifer-ation and genetic instability while suppressing apoptosis and weakening cellular adhesion (4). In the clinic, tyrosine kinase inhibitors (TKIs) are used for the treatment of CML and con-tribute the quality of patient’s life (5). Imatinib mesylate, a first-generation tyrosine kinase inhibitor, is used for first-line therapy in CML due to its great efficacy (6). Despite its thera-peutic efficacy, the development of imatinib-resistance and in-tolerance is still a challenging problem for most patients (7). Many novel compounds and therapeutic approaches are cur-rently being investigated preclinically and clinically to over-come imatinib resistance (8). Dasatinib and nilotinib are the second generation TKIs that are more effective and safer in pa-tients with imatinib-resistance and intolerance (8). However, the development of novel Bcr-Abl mutants resistant to these new small-molecule inhibitors and adverse effects of these agents are still significant problems (9).Therefore, alternative thera-peutic approaches are required and natural products have been investigated because of their potential in cancer prevention and treatment.
Flavonoids are a family of polyphenolic compounds that are common components of the human diet. They are widely dis-tributed in the plant kingdom and occur naturally in a broad range of fruits and vegetables. Currently, there is a growing interest in polyphenolic phytochemicals, including flavonoids, because experimental and epidemiological data support that they exert many beneficial effects including antioxidant, anti-inflammatory, cardioprotective, and anticarcinogenic activities (10–12). Apigenin (4’,5,7- trihydroxyflavone), a common plant dietary flavonoid, is present at high levels in several fruits and vegetables, has been paid attention as an alternative anticancer compound, but its mechanism of action remains unclear and shows variation between different cancer types (13). The mech-anisms of apigenin-induced apoptosis include stimulation of gap junctional communication, inhibition of transformation, angio-genesis, and activation of nuclear transcription factor kappa B (NF-κB) (14). Morover, apigenin has been reported to induce apoptosis through caspase-3, -8, and -9 (15–17). Apigenin treat-ment has been also shown to alter the Bax/Bcl-2 ratio in favor of apoptosis (11,12). The growth inhibitory and apoptotic effects of apigenin on several human cancer types, including breast, lung, colon, liver, and certain hematologic cancer cells have been studied (18–20), but there is a lack of studies related with the effects of apigenin in CML.
Herein, we aim to examine the cytotoxic, apoptotic, and cy-tostatic effects of apigenin on imatinib-sensitive and resistant, Philadelphia-positive K562 CML cells. In the present article we
also describe genes and networks that are modulated in CML following treatment with apigenin.
MATERIALS AND METHODS Chemicals
Apigenin was obtained from Santa Cruz Biotechnology, Inc. (Heidelberg, Germany). The stock solution of apigenin was dissolved in dimethylsulfoxide (DMSO) at a concentration of 10 mM, stored at −20◦C, and diluted in blank cell culture medium. The final concentration of DMSO did not exceed more than 0.1% in culture. Penicillin-streptomycin, RPMI 1640, and fetal bovine serum were obtained from Invitrogen (Paisley, UK).
Cell Lines and Culture Conditions
Human K562 CML cells were obtained from German Col-lection of Microorganisms and Cell Cultures (Braunschweig, Germany). K562 cells were maintained in RPMI 1640 growth medium containing 10 % fetal bovine serum and 1% penicillin-streptomycin at 37◦C in 5% CO2. K562 cells grown in RPMI 1640 were exposed to increasing concentrations of imatinib, starting with 50 nM. At the end of this process, 3 μM ima-tinib resistant cells were generated and named as K562/IMA3 cells (21).
Measurement of Cell Growth by MTT Assay
Antiproliferative effects of apigenin on K562 and K562/IMA3 CML cells was determined by MTT cell prolifera-tion assay. In short, 2× 10⁴cells/well were seeded into 96-well plates containing 100μl of the growth medium in the absence or presence of increasing concentrations of apigenin and then incubated at 37◦C in 5% CO2for 48 and 72 h. After incubation period, the cells were treated with 20 μl MTT for 3 h. Then, plates were centrifuged for 10 min at 580 g. After centrifuga-tion, supernatants were removed from the plates and then the MTT crystals were homogenized by adding 100μl DMSO into each well. To homogenize the pellets more efficiently, the plates were shaken for 5 min by shaker. Afterwards, the plates were read under 570 nm wavelengths by Elisa reader (Thermo Elec-tron Corporation Multiskan Spectrum, Vantaa, Finland). Finally, IC50 value (drug concentration inhibits cell growth by 50%) of apigenin was calculated according to the cell proliferation plots (22).
Analysis of Apoptotic Cells by AnnexinV-FITC/PI Double Staining
We determined the translocation of phosphatidylserine from the inner membrane to the outer cell membrane in order to ex-amine apoptotic effects of apigenin on both sensitive and ima-tinib-resistant CML cells. Initially, 1× 10⁶cells were treated with different concentrations of apigenin for 72 h. After incuba-tion period, the cells were washed twice with cold PBS and then homogenized with 1 mL of 1X binding buffer. Then, 100μl of this solution were added into glass tubes. 5μl of FITC An-nexin V and 5 μl of propidium iodide (PI) were added onto
the cell solutions. These samples were vortexed gently and then incubated for 15 min at room temperature in the dark. After-wards, 400μl of 1X binding buffer were added to each tube, and then they were analyzed by flow cytometry (BD Facscanto Flowcytometry, Erembodegem, Belgium) within 1 h.
Analysis of the Changes in Mitochondrial Membrane Potential
We examined the loss of mitochondrial membrane potential (MMP) in response to apigenin in both cells by JC-1 Mitochon-drial Membrane Potential Detection Kit (Cayman Chemicals, Ann Arbor, MI). This kit uses a unique cationic dye, JC-1, to signal the loss of MMP. JC-1 accumulates in mitochondria, which stain red in nonapoptotic cells while in apoptotic cells, MMP collapses, and thus JC-1 dye remains in the cytoplasm as a monomer that stains green under fluorescent light. Briefly, the cells (1× 10⁶cells/2 mL), induced to undergo apoptosis, were collected by centrifugation at 400 g for 10 min. Super-natants were removed and pellets were homogenized by 300μl of medium. Thirtyμl of JC-1 dye were added onto the cells and the cells were incubated at 37◦C in 5% CO2for 30 min. Then, they were centrifuged at 400 g for 5 min, supernatants were removed and 200μl of assay buffer were added onto the pellets and vortexed. Then, this step was repeated once again. After-wards, all pellets were homogenized with 320μl assay buffer and 100μl from each of them were added into 96-well plate as triplicates. The aggregate red form has absorption/emission maxima of 560/595 nm, whereas the monomeric green form has absorption/emission maxima of 485/535 nm. The plate was read in these wavelengths by fluorescence Elisa reader (Thermo Varioskan Spectrum, Finland). At the end, the ratio of fluores-cent intensity of JC-1 monomers (green) to fluoresfluores-cent intensity of JC-1 aggregates (red) were calculated for each concentration as well as untreated control sample. Then, relative changes in cytoplasmic/mitochondrial JC-1 were determined by comparing to control samples (23).
Analysis of Caspase-3 Activity
Changes in caspase-3 activity of the cells were examined by caspase-3 colorimetric assay kit (BioVision Research Products, Milpitas, CA). This assay is based on spectrophotometric de-tection of the chromophore p-nitroanilide (pNA) after cleavage from the labeled substrate DEVD-pNA that can be recognized by caspases. In short, the cells (1× 10⁶cells/2 mL/well), induced to undergo apoptosis by apigenin, were collected by centrifuga-tion at 400 g for 10 min. The cells were lysed by adding 50μl of chilled Cell Lysis Buffer and incubated on ice for 10 min before centrifugation at 10,000 g for 1 min. Supernatants were transferred to new eppendorf tubes and the reaction mixture was prepared in 96-well plates by adding 50μl of 2X Reaction Buffer (containing 10 mM DTT), 50 μl of sample, and 5 μl of DEVD-pNA substrate and incubated for 2 h at 37◦C in CO2 incubator. At the end of this period, the plate was read under 405 nm wavelengths by Elisa reader (Thermo Electron
Corpo-ration Multiskan Spectrum, Vantaa, Finland). The absorbance values were normalized to protein concentrations determined by Bradford assay.
Cell Cycle Analysis
This technique is based on the determination of amounts of dsDNA by using PI, a DNA-binding dye, through flow cy-tometry. When the data acquired from the flow cytometry are analyzed, cell cycle phases and the amounts of fragmented DNA of the cells can be determined. Briefly, 1× 10⁶cells/2 mL were treated with increasing concentrations of apigenin for 72 h. After the incubation period, cells were collected by centrifugation at 400 g for 10 min. Supernatants were removed, and pellets were homogenized with 1 mL cold PBS, and then the samples were put on ice. Afterwards, although the cells were slightly vortexed, 4 mL of cold ethanol were added onto these cells, and then put on ice. Fixated cells by this method were incubated overnight at−20◦C for the analysis. Next day, the cells were centrifuged at 400 g for 10 min, and supernatants were completely removed from the pellets. Pellets were homogenized with 1 mL cold PBS, and centrifuged again at 400 g for 10 min. Afterwards, cell pel-lets were homogenized with 1 mL PBS containing 0.1% triton X-100, and then 100μl RNase A (200 μg/mL) were added onto these cells, and they were incubated at 37◦C for 30 min. After this incubation period, 100μl PI (1 mg/mL) were added onto the cells. These cells were incubated at room temperature for 15 min and then analyzed by flow cytometry.
Microarray Analysis
Total RNA was isolated from K562 and K562/IMA3 cells ex-posed to 50μM and 100 μM Apigenin for 72 h using High Pure RNA Isolation Kit (Roche, San Francisco, CA) according to manufacturer’s instructions. The concentrations and purities of RNA samples were measured with NanoDrop (Thermo Scien-tific, Wilmington, DE) spectrophotometer (260/280 nm ratios) and only the samples with an A260/A280 ratio between 1.9 and 2.1 were considered for further use. Illumina Human HT-12v4 beadchip microarrays (containing∼47,000 transcripts: ∼30000 genes) (Illumina, Inc., San Diego, CA) were used to assess global gene expression for each sample. Five hundred ng of total RNA were firstly reverse-transcribed into cDNA and then cDNA samples were converted to biotin-labeled cRNA by using the Illumina TotalPrep RNA-amplification kit (Ambion, Foster City, CA) based on manufacturer’s instructions for hybridization analysis. Then, 1.5μg of labeled cRNA was hybridized to each array according to the Illumina whole-genome gene expression direct hybridization assay protocol. Arrays were scanned using the Illumina BeadArray Reader. The images were processed and converted into signal intensities using the Illumina GenomeStu-dio software (Illumina, Inc., San Diego, CA). The same software was used to perform hybridization quality control (QC).
Statistical Analysis
Statistical significance was determined using one-way analy-sis of variance (ANOVA) for MTT analyses, and 2-way ANOVA
for Annexin V, MMP, and caspase-3 activity analyses. P< 0.05 was considered to be significant. The signal intensities corre-sponding to gene expression levels were background corrected and imported into text files using the Illumina GenomeStu-dio. Hierarchical cluster analysis was applied to data sets to evaluate the “proximity” between genes and hierarchical clus-ters were constructed with the statistically significant (P < 0.05) genes. Genes were considered differentially expressed when logarithmic gene expression ratios in 3 independent hy-bridizations were more than 1.5 or less than 0.66 and when the P values were less than 0.05. Gene ontology and path-way analyses were performed to consider biological meaning of differential expression of genes between the treated and un-treated samples by using the Kyoto Encyclopedia of Genes and Genomes and Ingenuity Pathway Analysis (IPA; Ingenuity Systems, Redwood City, CA).
RESULTS
Cytotoxic Effects of Apigenin on Both K562 and K562/ IMA3 Cells
Our previous findings demonstrated that K562/IMA3 cells (IC50: 14680 nM) were around 52-fold more resistant to ima-tinib as compared to sensitive K562 cells (IC50: 280 nM) (21). Cytotoxic effects of apigenin on K562 and K562/IMA3 cells were determined by MTT cell proliferation assay. IC50 values of apigenin for K562 cells at 48 and 72 h were calculated from cell proliferation plots and were found to be 16 and 2,5μM, re-spectively (Fig. 1A). On the other hand, IC50values of apigenin for K562/IMA3 cells were found to be 65 and 63μM at indicated time points, respectively (Fig. 1B). These results demonstrated that apigenin has cytotoxic effects on both cell types in a time-and dose-dependent manner. However, K562/IMA3 cells were 4- and 25-fold more resistant to apigenin as compared to K562 cells at 48 and 72 h, respectively.
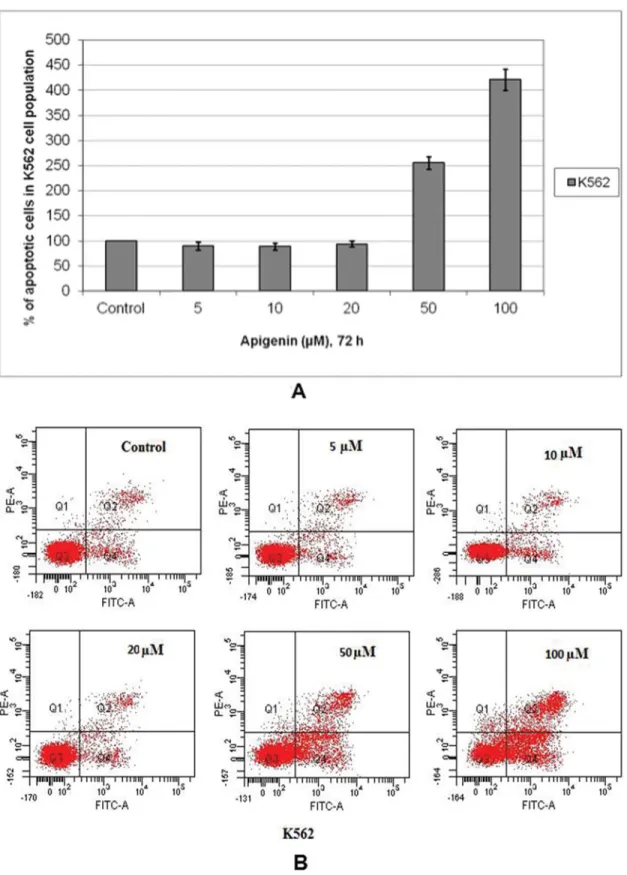
Apigenin Induces Apoptosis of Both K562 and K562/ IMA3 Cells in a Dose-Dependent Manner
Apoptotic effects of apigenin on both cells were determined by Anexin-V/PI double staining. The percentage of apoptotic cell population of sensitive and resistant cells treated with in-creasing concentrations of apigenin was determined by flow cytometry. Although no significant changes were detected in apoptotic cells up to 20μM apigenin, there were 2.6- and 4.2-fold increases in percentage of apoptotic K562 cells in response to 50 and 100μM apigenin, respectively, as compared to un-treated controls (Fig. 2A and Fig. 2B). On the other hand, 50 and 100μM apigenin caused 1.1- and 2.2- fold increases in apoptotic K562/IMA3 cell population (Fig. 2C and 2D). These results indicated that apigenin increased apoptotic cell popula-tion at higher concentrapopula-tions in both cell lines but K562/IMA3 cells showed resistance to apigenin as compared to K562 cells.
Apigenin Induces Loss of MMP in Both K562 and K562/ IMA3 Cells in a Dose-Dependent Manner
Loss of mitochondrial membrane potential is an important sign of apoptosis because it has been linked to initiation and acti-vation of apoptotic cascades. Therefore, we determined whether apigenin causes the loss of MMP in both cell lines exposed to the same concentrations of apigenin. The results revealed that there were 1.3-, 1.7-, 2-, 2.1-, and 2.3-fold increases in loss of MMP in K562 cells treated with 5, 10, 20, 50, and 100μM apigenin, respectively, as compared to untreated con-trols. The same concentrations of apigenin led to 1.18-, 1.19-, 1.24, 1.3, and 1.41-fold increases in loss of MMP in K562/ IMA3 cells, respectively, as compared to untreated controls (Fig. 3).
Apigenin Increases Caspase-3 Activity in a Dose-Dependent Manner in Both K562 and K562/IMA3 Cells
Caspase-3 enzyme has a central role in the mitochondrial-mediated cell death. To determine whether apoptosis induced by apigenin was associated with activation of caspase-3, the cells were treated with increasing concentrations of apigenin for 72 h and the changes in caspase-3 enzyme activity was detected through the cleavage of the labeled substrate DEVD-pNA. There were 1.02-, 1.2-, 1.26-, and 1.9-fold increases in caspase-3 enzyme activity in response to 5, 10, 20, and 50μM apigenin in K562 cells, respectively, as compared to untreated controls (Fig. 4A). On the other hand, the same concentrations of apigenin increased caspase-3 enzyme activity 1.07-, 1.08-, 1.28, and 1.54-fold in K562/IMA3 cells exposed to the same concentrations of apigenin as compared to control, respectively (Fig. 4B). K562/IMA3 cells were also treated with 100μM api-genin and there was only a 1.86-fold increase in caspase-3 activ-ity. Apigenin increased caspase-3 activity in a dose-dependent manner with no significant changes in K562 and K562/IMA3 cells.
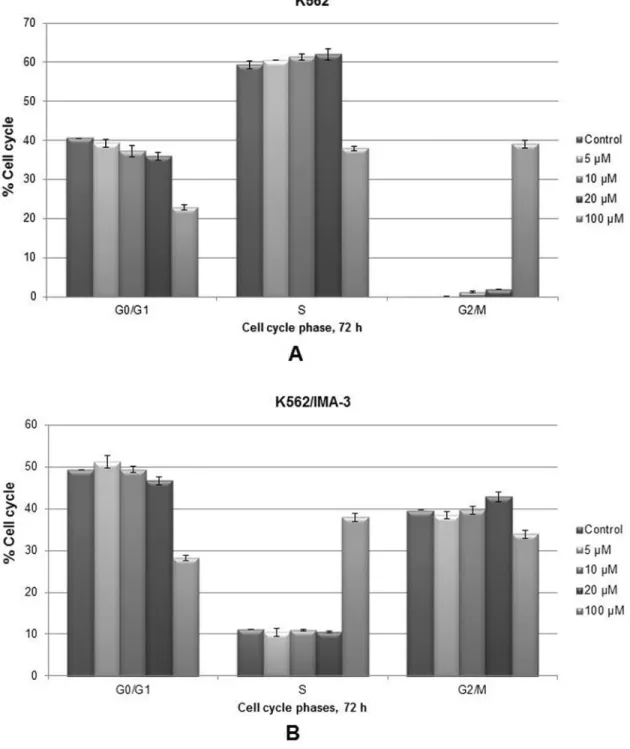
Apigenin Arrested Cell Cycle Progression in G2/M Phase in K562 Cells but not in K562/IMA3 Cells
To determine the possible mechanism of antiproliferative activity of apigenin, cell cycle progression of both cell lines were examined by flow cytometry in the presence of DNase free RNase and PI dye. As summarized in Fig. 5A, treatment of K562 cells with apigenin resulted in small increases in the percentage of cells in the G2/M phase at 5 to 20μM apigenin but in response to 100 μM apigenin there was a significant increase. In accordance with this result, there were also de-creases in the percentage of the cells in G0/G1 and S phases. On the other hand, there was no significant effect of apigenin on G2/M phase of K562/IMA3 cell cycle (Fig. 5B). However, K562/IMA3 cells arrested in S phase especially at 100 μM apigenin.
FIG. 1. Cytotoxic effects of apigenin on human K562 (A) and K562/IMA3 (B) chronic myeloid leukemia (CML) cells. The IC50 value of apigenin was calculated from cell proliferation plots. The results are the means of 3 independent experiments. The error bars represent the standard deviations. Statistical significance was determined using one-way analysis of variance and P< 0.05 was considered to be significant.
Identification of Genes Differentially Expressed in Apigenin Treated Imatinib-Sensitive and Resistant CML Cells
We examined the changes in expression levels of the genes following treatment of K562 and K562/IMA3 cells with 50
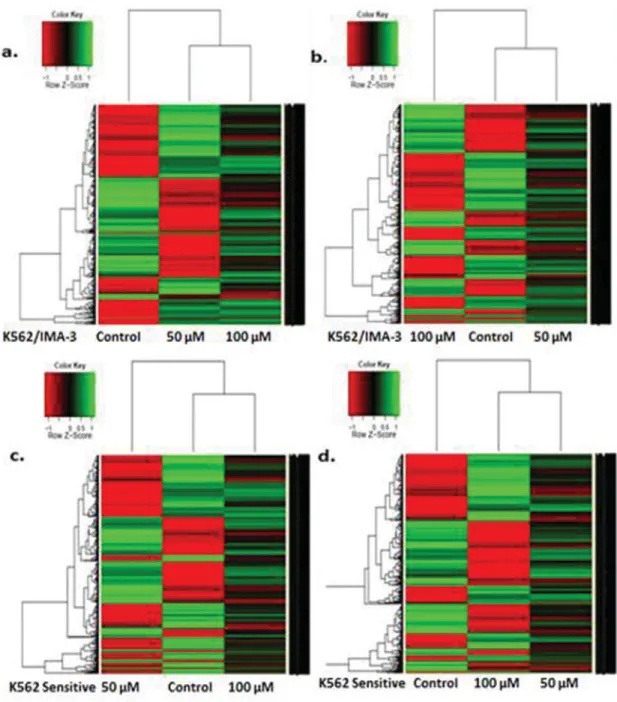
and 100μM apigenin. Isolated total RNA was amplified and converted to biotin-labeled cRNA, which was hybridized to microarray system containing approximately 30,000 genes. Hierarchical clustering of gene expression (heat map analysis) in untreated and apigenin treated K562 and K562/IMA3 cells
FIG. 2. Evaluation of apoptosis in sensitive and resistant cells induced by apigenin. The percentage of cells undergoing apoptosis in a dose-dependent manner as compared to control and FACS analysis via Annexin V-FITC/propidium iodide (PI) staining (A and B for K562 cells, C and D for K562/IMA3 cells). Cells in the lower right quadrant indicate Annexin-positive/PI negative, early apoptotic cells. The cells in the upper right quadrant indicate Annexin-positive/PI positive. The percentage of cells annexin V positive, PI positive, or double positive for both annexin V and PI is indicated. The results are the means of 3 independent experiments. (Color figure available online.)
FIG. 2. (Continued)
is shown in Fig. 6A. total of 1526 and 1368 genes were significantly regulated (P< 0.05) in 50 and 100 μM apigenin treated K562 sensitive cells, respectively. The number of genes upregulated were 674 whereas those of downregulated were 852 in 50μM apigenin-treated K562 cells. In 100 μM apigenin treated K562 cells, 676 genes were upregulated and 692 genes were downregulated. Moreover, a total of 315 genes were com-mon between 50 and 100μM apigenin-treated sensitive cells. On the other hand, a total of 1485 (778 genes upregulated, 707 downregulated) and 2442 genes (1176 genes were upregulated, 1266 genes were downregulated) were significantly changed (P < 0.05) in response to 50 and 100 μM apigenin in K563/IMA-3 cells, respectively. A total of 455 genes were common between 50 and 100 μM apigenin-treated imatinib resistant cells. Fold-change analysis showed that UNC5A (netrin receptor), PDCD1LG2 (programmed cell death 1 ligand
2), BCAM (basal adhesion molecule), SCARA5 (scavenger receptor class A, member 5), and DGKA (diacylglycerol kinase alpha) were the examples of altered genes in both 50 and 100 μM apigenin treated sensitive cells (Table 1). Table 2 illustrates the examples of genes altered after apigenin treatment in K562/IMA3 cells. It was clear that HAGH (hydroxyacylglutathione hydrolase or glyoxylase II), IL15RA (interleukin 15 receptor, alpha), ENTPD1 (ectonucleoside triphosphate diphosphohydrolase 1), and DGKI (diacylglycerol kinase iota) were the examples of upregulated genes in both 50 and 100μM apigenin-treated K562/IMA3 cells.
Identification of Genetic Networks Affected by Apigenin
To examine the affected genetic networks after apigenin treatment, we carried out pathway analysis using the IPA tool. These networks describe functional relationships between gene
TABLE 1
The genes altered≥twofold after apigenin treatment of K562 sensitive cells
Altered genes in 50μM apigenin-treated K562 sensitive cells (Fold changes)
Altered genes in 100μM apigenin-treated K562 sensitive cells (Fold changes)
UNC5A (42.440) UNC5A(32.340) PDCD1LG2 (16.818) PDCD1LG2(18.015) HES2 (5.659) BCAM(5.044) BCAM (4.226) SNAI1(4.777) NPTX1 (4.201) MOB4(4.272) SCARA5 (3.957) LOXL4(3.477) PRKAG2 (2.982) SCARA5(3.181) miR-15 (2.049) miR− 195(2.782) PCSK6 (-24.088) ADAMTS13(2.266) KIF12 (-8.070) PPP1R9A(−31.415) EIF3C/EIF3CL(-7.747) CD74(−14.305) UGT1A6 (-6.812) EPHA5(−4.640) REPS2 (-5.261) BRAF(−2.076) CALML6 (-2.559) FYN(−2.313) PRKCB (-2.285) IL8(−2.456) DGKA (-2.179) DGKA(−2.288)
Boldface type represents some genes induced in both 50 and 100μM apigenin-treated K562 cells.
TABLE 2
The genes altered twofold after apigenin treatment of K562/IMA3 imatinib resistant cells
Altered genes in 50μM apigenin treated K562/IMA-3 cells (fold changes)
Altered genes in 100μM apigenin treated K562/IMA-3
cells (fold changes)
HAGH (21.248) HAGH(22.630) IL15RA (18.2591) IL15RA(10.215) ENTPD1 (7.485) DISC1(6.221) TRAF5 (5.634) ATR(6.018) DISC1 (5.593) ENTPD1(5.906) RPE65 (5.380) CHEK2(3.992) MEX3D (5.203) MRP6(3.203) ITGB5 (4.768) MMP17(3.171) DGKI (2.574) DGKI(2.318) MAL2 (-27.736) CYP4Z1(−12.850) BCAS1 (-12.817) CD86(−8.729) RHOBTB1 (-4.728) GAB1(−6.585) MMRN1 (-3.910) CXCR4(−5.804) FOXA2 (-3.785) PCNA(−2.299) PKIG (-2.962) SCARA5(−2.469)
Boldface type represents some genes induced in both 50 and 100μM apigenin-treated K562/IMA3 cells.
FIG. 3. Percent changes in cytoplasmic/mitochondrial JC-1 in K562 and K562/IMA3 cells treated with increasing concentrations of apigenin. The results are the means of 3 independent experiments. The error bars represent the standard deviations. Statistical significance was determined using 2-way analysis of variance and P< 0.05 was considered to be significant.
FIG. 4. Changes in caspase-3 enzyme activiy in K562 (A) and K562/IMA3 cells (B) in response to apigenin. The results are the means of 3 independent experiments. The error bars represent the standard deviations. Statistical significance was determined using 2-way analysis of variance and P< 0.05 was considered to be significant.
FIG. 5. Effect of apigenin on cell cycle progression. The percentage of cells in cell cycle phases are shown in the graphs (A and B). The results are the means of 3 independent experiments. Statistical significance was determined using 2-way analysis of variance and P< 0.05 was considered to be significant.
products based on known interactions in the literature. The re-sults showed that cancer (P value= 1.01E-05 – 3.82E-02) was the most significant network with 310 affected molecules in 50μM apigenin-treated K562 imatinib sensitive cells. More-over, cell death and survival with 271 molecules (P value = 5.59E-05 – 3.97E-02) and cellular development with 242 molecules (P value = 1.52E-04 – 3.62E-02) were the other
most affected networks in 50μM apigenin treated K562 cells. Similarly, the most affected network in 100μM apigenin treated K562 cells was the cancer with 280 molecules (P value= 2.78E-04 – 3.34E-02). Cell-to-cell signaling and interaction (P value= 1.32E-04 – 3.30E-02) with 90 molecules and hematological sys-tem development and function (P value= 1.89E-04 – 3.32E-02) with 154 molecules were affected as well as cancer network. On
FIG. 6. Hierarchical clustering based on gene expression data from K562 and K562/IMA3 cells exposed to apigenin. Comparison between K562/IMA3 cells treated with 50μM (A) and 100 μM (B) apigenin. Comparison between K562 cells treated with 50 μM (C) and 100 μM (D) apigenin. A fold-change ratio was calculated using the treated sample and its matched untreated sample. Green is downregulated genes and red is upregulated genes. (Color figure available online.)
the other hand, cell-to-cell signaling and interaction (P value= 1.25E-06 – 9.57E-03), cellular growth and proliferation (P value = 1.06E-05 – 9.57E-03) and cell signalling (P value = 1.38E-05 – 9.52E-03) were the significantly altered networks with 155, 109, and 84 molecules, respectively, in 50μM apigenin-treated K562/IMA3 cells (Fig. 6). In K562/IMA3 cells treated with 100μM apigenin, cancer (P value = 1.50E-06 – 2.17E-02), cel-lular death and survival (P value= 8.84E-05 – 2.16E-02), cell cycle (P value= 1.06E-05 – 2.21E-02) and hematological
sys-tem development and function (P value: 1.74E-05 – 2.21E-02) were changed networks with 511, 443, 112, and 225 molecules, respectively (Fig. 6).
DISCUSSION
Flavonoids are essential constituents of the human diet and have been suggested to possess anticarcinogenic properties (19). Recently, apigenin, a naturally occurring plant flavone, have
been found to induce apoptosis in various tumor cells includ-ing breast, cervical, lung, ovarian, prostate, liver, and certain leukemias (12). Apigenin induces cell death with variable ef-ficacy in several cancer types including colon, breast cancer, and prostate cancer. Despite its low efficacy in epithelial cells, apigenin induces apoptosis with high efficacy in myelogenous leukemia cells. However, the mechanisms regulating apigenin-induced apoptosis in leukemia cells remain elusive (13,19). In recent studies, apigenin has been shown to trigger apoptosis through Hsp27 phosphorylation (20), cytochrome c release (19), caspase activation (16,19), and proteasome inhibition in sev-eral leukemic cells (24). We conducted this study to examine the cytotoxic, cytostatic, and apoptotic effects of apigenin on K562 and K562/IMA3 CML cells. We treated the cells with increasing concentrations of apigenin and determined its cyto-toxic/antiproliferative effects by MTT cell proliferation assay. The results of this assay revealed that apigenin decreased pro-liferation of the cells in a dose- and time-dependent manner. It is very well known in the literat¨ure that cancer cells resistant to any agent may show cross resistance to the others. However, the important point in this study is that although K562/IMA-3 cells are more than around 50 times resistance to imatinib as com-pared to sensitive cells, they are just 4 times more resistance to apigenin at 48 h. On the other hand, Annexin-V/PI double staining showed increases in apoptotic cell population in both K562 and K52/IMA-3 cells in response to 50 and 100μM api-genin as compared to untreated controls. However, K562/IMA3 cells showed resistance to apigenin as compared to K562 cells because, only 1.1- and 2.2-fold increases have been detected in apoptotic K562/IMA3 cell population, whereas there were 2.6-and 4.2-fold increases in percentage of apoptotic K562 cells. To elucidate the molecular mechanism of apigenin induced apopto-sis in imatinib-sensitive and reapopto-sistant cells, we first checked the effect of apigenin on MMP. The JC-1 dye-based assay results revealed that apigenin caused loss of MMP in a dose-dependent manner in both cells. It is very well known that mitochondria is an important player for all apoptotic pathways and it is widely accepted that alterations in the structure and function of mito-chondria play an important role in caspase-dependent apoptosis. Caspase-3 functions in the last step of caspase-mediated apopto-sis and is responsible for the properties of apoptotic cells (such as DNA fragmentation) (19). Based on this knowledge, we next checked the activation of caspase-3 enzyme in apigenin treated cells. Our data demonstrated that apigenin increased caspase-3 activities of both cell types in a dose-dependent manner as com-pared to untreated controls. Taken together, we can conclude that apigenin may induce apoptosis in both cells through the loss of MMP and caspase-3 activation. However, it was clearly indi-cated in this study that K562/IMA3 cells required higher doses of apigenin than K562 cells for antiproliferative and apoptotic effects. Similar to our results, apigenin was shown to induce mitochondial depolarization and caspase activation in HL-60 acute promyelocytic leukemia cells (16). We also investigated the cytostatic property of apigenin on CML cells and observed
that the treatment of K562 CML cells with apigenin resulted in G2/M phase arrest especially at high concentrations. Many stud-ies have reported that apigenin blocks cell cycle progression in cancer cells, however, depending on the cell type, apigenin can arrest the cell cycle in different phases. For instance, it caused G2/M arrest in colon carcinoma (25). Nevertheless, in human prostate cancer, LNCap and PC-3 cells, apigenin induced cell cycle arrest in G0/G1 (26). The results of our study extend these observations that, depending on the cyclins affected, responses may be substantially different.
In this study, we also performed microarray analysis in K562 and K562/IMA3 cells to identify the genes and networks that are involved in apigenin-induced apoptosis. For this purpose, heat map analysis was performed to cluster the genes in K562 and K562/IMA3 cells exposed to 50 and 100μM apigenin. As in-dicated in the result part, both cell types responded to apigenin with changes in the expression levels and numbers of genes. Moreover, the number of altered genes showed differences be-tween 50 and 100μM apigenin-treated cells while there were some common genes. For instance, UNC5A and SCARA5 were some common altered genes with different expression levels in 50 and 100μM apigenin-treated K562 cells. UNC5A is associ-ated with tumorigenesis in nonneuronal cells and function as a tumor supressor (27,28). Several studies showed that UNC5A is downregulated in human breast, lung, and colorecteral cancers and it was found to induce apoptosis in p53-dependent manner (28, 29). In our study, this gene was the most upregulated one in both 50 and 100μM apigenin-treated K562 cells and it could be tought to cause apigenin induced cell death. Similarly, it is known that SCARA5 gene has tumor suppressor function (30) and its upregulation could be related to apigenin mediated cell death in K562 cells. Besides UNC5A and SCARA5, genes sum-marized in Table 1 have been shown to possess different roles in carcinogenesis depending on their expression status (31–33). The study also concluded that apigenin treatment could mod-ulate the phosphatidylinositol signaling system, which has key regulatory functions in cell survival, proliferation, and apopto-sis, in both 50 and 100μM apigenin-treated K562 cells due to downregulation of some players of this pathway such as DGKA in response to apigenin treatment. Therefore, the downregula-tion of this pathway could be responsible for apigenin-mediated apoptosis of K562 cells. On the other hand, apigenin treatment altered the expression levels of several genes in K562/IMA3 cells as compared to untreated controls (summarized in Table 2). For example, HAGH gene, encoding glyoxylase II enzyme (which is a member of glyoxalase pathway), was the most upregulated one in both 50 and 100μM apigenin treated K562/IMA3 cells and it is known that the overexpression of this gene is related to drug and apoptosis resistance in several cancer cells such as leukemia, lung, and breast cancer (34). Therefore, K562/IMA3 cells might show resistance to apigenin-induced apoptosis as compared to sensitive K562 cells due to overex-pression of HAGH. Similarly, IL15RA and ENTPD1 were the examples of overexpressed genes in K562/IMA3 cells and their
upregulation is known to induce growth and proliferation of can-cer cells (35,36). Based on this knowledge, we concluded that their upregulation might be responsible for survival of the re-sistant cells after apigenin treatment. In contrast to K562 cells, phosphatidylinositol signaling system was thought to be acti-vated following apigenin treatment in K652/IMA-3 cells since DGKI, downstream player in this pathway, was upregulated in 50 and 100 μM apigenin treatment. DGKI overexpression has been displayed to induce cell growth (37) and its modula-tion might be related to lower apoptotic effect of apigenin on K562/IMA3 cells. Besides the above genes, genes summarized in Table 2 have been shown to be related with tumor growth and drug resistance depending on their expression status (30,38,39). As explained in the Results section, K562/IMA3 cells were more resistant to apigenin treatment than K562 cells in terms of cyto-toxic and apoptotic effects and microarray data supported these results. Therefore, discussed genes in K562 and K562/IMA3 cells may warrant further investigation as a candidate target of apigenin. In addition to gene clustering, IPA tools were used to get an idea about networks with known biological pathways. These networks were found to be associated with the cell sur-vival, proliferation, cell death, cell cycle, and cell signalling pathways. Apigenin might display its anticarcinogenic property in several cancer types by modulating cell signalling pathways such as phosphatidylinositol 3-Kinase/Akt-dependent pathway, MAPK pathway, and cell cycle related pathways (12).
In conclusion, the results of this study indicated that api-genin may have therapeutic potential in imatinib-sensitive and imatinib-resistant CML cells due to induction of apoptosis, in-hibition of cell proliferation and cell-cyle arrest. Moreover, the genetic networks derived from this study illuminate some of the biological pathways affected by apigenin treatment while providing a proof of principle for identifying candidate genes that might be targeted for CML therapy. Furthermore, in vivo administration of most effective concentrations of apigenin into K562 mice xenografts could be helpful to understand the possi-bility that apigenin may have clinical implications and might be further tested for incorporating in leukemia treatment regimens.
NOTE
Soner Solmaz and Aysun Adan Gokbulut contributed equally to this article.
ACKNOWLEDGMENTS
We thank Biotechnology and Bioengineering Application and Research Center staff of ˙Izmir Institute of Technology for their help and technical support.
REFERENCES
1. Quinta’s-Cardama A, and Cortes JE: Molecular biology of bcr-abl1–positive chronic myeloid leukemia. Blood 113, 1619–1630, 2009. 2. Faderl S, Talpaz M, Estrov Z, O’Brien S, Kurzrock R, et al.: The biology
of chronic myeloid leukemia. N Engl J Med 341, 164–172, 1999.
3. Di Bacco A, Keeshan K, McKenna SL, and Cotter TG: Molecular ab-normalities in chronic myeloid leukemia: deregulation of cell growth and apoptosis. Oncologist 5, 405–415, 2000.
4. Frazer R, Irvine AE, and McMullin MF: Chronic myeloid leukaemia in the 21st century. Ulster Med J 76, 8–17, 2007.
5. Hurtado R, Vargas P, and Cortes J: Chronic myeloid leukemia current concepts in physiopathology and treatment. T Cancerologia 2, 137–147, 2007.
6. Quint´as-Cardama A, Kantarjian HM, and Cortes JE: Mechanisms of pri-mary and secondary resistance to imatinib in chronic myeloid leukemia.
Cancer Control 16, 122–131, 2009.
7. Ramirez P and DiPersio JF : Therapy options in imatinib failures.
Oncolo-gist 13, 424–434, 2008.
8. Melo JV and Chuah C: Novel agents in CML therapy: tyrosine kinase inhibitors and beyond. Hematology Am Soc Hematol Educ Program 2008, 427–435, 2008.
9. Santos FP and Ravandi F: Advances in treatment of chronic myelogenous leukemia new treatment options with tyrosine kinase inhibitors. Leuk
Lym-phoma 2, 16–26, 2009.
10. Monasterio A, Urdaci MC, Pinchuk IV, Lopez-Moratalla N, and Martinez-Irujo JJ: Flavonoids induce apoptosis in human leukemia U937 cells through caspase- and caspase-calpain–dependent pathways. Nutrition and Cancer
50, 90–100, 2004.
11. Patel D, Shukla S, and Gupta S: Apigenin and cancer chemoprevention: Progress, potential and promise. International Journal of Oncology 30, 233–245, 2007.
12. Shukla S and Gupta S: Apigenin: A promising molecule for cancer preven-tion. Pharm Res 27, 962–978, 2010.
13. Ruela-de-Sousa RR, Fuhler GM, Blom N, Ferreira CV, Aoyama H, et al.: Cytotoxicity of Apigenin on leukemia cell lines: implications for prevention and therapy. Cell Death Dis 1, 1–19, 2010.
14. Chan LP, Chou TH, Ding HY, Chen PR, Chiang FY, et al.: Apigenin induces apoptosis via tumor necrosis factor receptor- and Bcl-2-mediated pathway and enhances susceptibility of head and neck squamous cell carcinoma to 5-fluorouracil and cisplatin. Biochimica et Biophysica Acta 1820, 1081–1091, 2012.
15. Iwasaki R, Ito K, Ishida T, Hamanoue M, Adachi S, et al.: Catechin, green tea component, causes caspase-independent necrosis-like cell death in chronic myelogenous leukemia. Cancer Sci 100, 349–356, 2009. 16. Vargo MA, Voss OH, Poustka F, Cardounel AJ, Grotewold E, et al.:
Apigenin-induced-apoptosis is mediated by the activation of PKCdelta and caspases in leukemia cells. Biochem Pharmacol 72, 681–692, 2006. 17. Lu HF, Chie YJ, Yang MS, Lee CS, Fu JJ, et al.: Apigenin induces
caspase-dependent apoptosis in human lung cancer A549 cells through Bax- and Bcl-2-triggered mitochondrial pathway. Int J Oncol 36, 1477–1484, 2010. 18. Choi EJ and Kim GH: Apigenin induces apoptosis through a mitochondria/caspase-pathway in human breast cancer MDA-MB-453 cells. J Clin Biochem Nutr 44, 260–265, 2009.
19. Wang IK, Lin-Shiau SY, and Lin JK: Induction of apoptosis by apigenin and related flavonoids through cytochrome c release and activation of caspase-9 and caspase-3 in leukaemia HL-60 cells. Eur J Cancer 35, 1517–1525, 1999.
20. Gonzalez-Mejia ME, Voss OH, Murnan EJ, and Doseff AI: Apigenin-induced apoptosis of leukemia cells is mediated by a bimodal and differen-tially regulated residue-specific phosphorylation of heat-shock protein-27.
Cell Death Dis 1, e64, 2010.
21. Salas A, Ponnusamy S, Senkal CE, Meyers MA, Selvam SP, et al.: Sphin-gosine kinase-1 and sphinSphin-gosine 1-phosphate receptor 2 mediate Bcr-Abl1 stability and drug resistance by modulation of protein phosphatase 2A.
Blood 117, 5941–5952, 2011.
22. Baran Y, Bielawski J, Ogretmen B, and Gunduz U: Inhibition of glu-cosylceramide synthase by PDMP resensitizes multidrug-resistant human chronic myeloid leukemia cells to ımatinib. Journal of Cancer Research
23. Avcı CB, Gunduz C, Baran Y, Sahin F, Yilmaz S, et al.: Caffeic acid phenethyl esther triggers apoptosis through ınduction of loss of mitochondrial membrane potential in CCRF-CEM. Journal of Cancer
Re-search and Clinical Oncology 137, 41–47, 2011.
24. Chen D, Daniel KG, Chen MS, Kuhn DJ, Landis-Piwowar KR, et al.: Di-etary flavonoids as proteasome inhibitors and apoptosis inducers in human leukemia cells. Biochem Pharmacol 69, 1421–1432, 2005.
25. Wang W, Heideman L, Chung CS, Pelling JC, Koehler KJ, et al.: Cell-cycle arrest at G2/M and growth inhibition by apigenin in human colon carcinoma cell lines. Mol Carcinog 28, 102–110, 2000.
26. Shukla S and Gupta S: Apigenin-induced cell cycle arrest is mediated by modulation of MAPK, PI3K-Akt, and loss of cyclin D1 associated retinoblastoma dephosphorylation in human prostate cancer cells. Cell
Cy-cle 6, 1102–1114, 2007.
27. Arakawa H: Netrin-1 and its receptors in tumorigenesis. Nat Ev Cancer 4, 978–987, 2004.
28. Thiebault K, Mazelin L, Pays L, Llambi F, Joly MO, et al.: The netrin-1 receptors UNC5H are putative tumor suppressors controlling cell death commitment. Proc Natl Acad Sci USA 100, 4173–4178, 2003.
29. Miyamoto Y, Futamura M, Kitamura N, Nakamura Y, Baba H, et al.: Identification of UNC5A as a novel transcriptional target of tumor sup-pressor p53 and a regulator of apoptosis. Int J Oncol. 36, 1253–1260, 2010.
30. Huang J, Zheng DL, Qin FS, Cheng N, Chen H, et al.: Genetic and epigenetic silencing of SCARA5 may contribute to human hepatocellular carcinoma by activating FAK signaling. J Clin Invest 120, 223–241, 2010.
31. Tonks A, Pearn L, Musson M, Gilkes A, Mills KI, et al.: Transcrip-tional dysregulation mediated by RUNX1-RUNX1T1 in normal human
progenitor cells and in acute myeloid leukaemia. Leukemia 21, 2495–2505, 2007.
32. Cimmino A, Calin GA, Fabbri M, Iorio MV, Ferracin M, et al.: miR-15 and miR-16 induce apoptosis by targeting BCL2. Proc Natl Acad Sci U S
A 102, 13944–13949, 2005.
33. Katoh M and Katoh M: Identification and characterization of human SNAIL3 (SNAI3) gene in silico. Int J Mol Med 11, 383–388, 2003. 34. Tsuruo T, Naito M, Tomida A, Fujita N, Mashima T, et al.: Molecular
targeting therapy of cancer: drug resistance, apoptosis and survival signal.
Cancer Sc. 294, 15–21, 2003.
35. Chen J, Petrus M, Bamford R, Shih JH, Morris JC, et al.: Increased serum soluble IL-15Rα levels in T-cell large granular lymphocyte leukemia. Blood
119, 137–143, 2012.
36. Loos M, K¨unzli B, and Friess H: Quantitation of CD39 gene expression in pancreatic tissue by real-time polymerase chain reaction. Methods Mol
Biol 576, 351–362, 2010.
37. Baldanzi G, Pietronave S, Locarno D, Merlin S, Porporato P, et al.: Diacyl-glycerol kinases are essential for hepatocyte growth factor-dependent prolif-eration and motility of Kaposi’s sarcoma cells. Cancer Sci 10, 1329–1336, 2011.
38. Plasschaert SL, de Bont ES, Boezen M, vander Kolk DM, Daenen SM, et al.: Expression of multidrug resistance-associated proteins predicts prognosis in childhood and adult acute lymphoblastic leukemia. Clin Cancer Res 11, 8661–8668, 2005.
39. Sohail A, Sun Q, Zhao H, Bernardo MM, Cho JA, et al.: MT4-(MMP17) and MT6-MMP (MMP25), A unique set of membrane-anchored matrix metalloproteinases: properties and expression in cancer. Cancer Metastasis