The role of maximum compressed thickness
of the quadriceps femoris muscle measured by
ultrasonography in assessing nutritional risk in
critically-ill patients with different volume statuses
Uğur Özdemir1
Merve Özdemir2
Gulbin Aygencel3
Burcu Kaya4
Melda Türkoğlu5
1 Internal Medicine specialist, Fellow of Critical Care Medicine. Division of Critical Care Medicine, Department of Internal Medicine, Gazi University Faculty of Medicine, Ankara, Turkey
2 Department of Nutrition and Dietetics, Başkent University Faculty of Health Sciences, Ankara, Turkey
3 Professor of Internal Medicine, Critical Care Specialist . Division of Critical Care Medicine, Department of Internal Medicine, Gazi University Faculty of Medicine, Ankara, Turkey
4 Internal medicine specialist, Fellow of Critical Care Medicine. Division of Critical Care Medicine, Department of Internal Medicine, Gazi University Faculty of Medicine, Ankara, Turkey
5Associate Professor of Internal Medicine, Critical Care Specialist .Division of Critical Care Medicine, Department of Internal Medicine, Gazi University Faculty of Medicine, Ankara, Turkey
http://dx.doi.org/10.1590/1806-9282.65.7.952
DATE OF SUBMISSION: 14-Apr-2019 DATE OF ACCEPTANCE: 19-Apr-2019 CORRESPONDING AUTHOR:Uğur Özdemir,
Internal medicine specialist, Fellow of Critical Care Medicine – Division of Critical Care Medicine, Department of Internal Medicine, Gazi University Faculty of Medicine, Ankara, Turkey – Phone number: +90 312 202 4201
E-mail: [email protected]
SUMMARY
PURPOSE: In this prospective observational study, we aimed to investigate the role of the maximum compressed (MC) and uncompressed
(UC) thickness of the quadriceps femoris muscle (QFMT) measured by ultrasonography (USG) in the detection of nutritional risk in intensive care patients (ICPs) with different volume status.
METHODS: 55 patients were included. Right, left, and total ucQFMT and mcQFMT measurements were obtained by a standard USG
device within the first 48 hours after ICU admission. Clinical examination and the USG device were used to determine the volume status of the patients. SOFA, APACHE II, modified NUTRIC scores, and demographic data were collected.
RESULTS: There was a significant difference between the nutritional risk of patients in terms of left, right, and total mcQFMT
mea-surements (p=0.025, p=0.039; p=0.028, respectively), mechanical ventilation requirement (p=0.014), presence of infection (p=0.019), and sepsis (p=0.006). There was no significant difference between different volume statuses in terms of mcQFMT measurements. In the multi-variance analysis, mcQFMT measurements were found to be independently associated with high nutritional risk (p=0.019, Exp(B)=0.256, 95%CI=0.082-0.800 for modified NUTRIC score ≥ 5), and higher nutritional risk (p=0.009, Exp(B)=0.144, 95%CI=0.033-0.620 for modified NUTRIC score ≥ 6). a Total mcQFMT value below 1.36 cm was a predictor for higher nutritional risk with 79% sensitivity and 70% specificity (AUC=0.749, p=0.002, likelihood ratio=2.04).
CONCLUSION: Ultrasonographic measurement of total mcQFMT can be used as a novel nutritional risk assessment parameter in medical
ICPs with different volume statuses. Thus, patients who could benefit from aggressive nutritional therapy can be easily identified in these patient groups.
METHODS
Patient population
All patients who were older than 18 years and hos-pitalized in the medical ICU of Gazi University Hos-pital between August 01, 2017 and March 01, 2018 were included in this study. The first admissions of the patients were evaluated. Patients who had muscular atrophy in lower extremities due to cerebrovascular accident, neuromuscular disease, or trauma were excluded from the study. Patients who stayed in the ICU for less than 48 hours were not included in this study. Approval was obtained from the local ethics committee on December 25, 2017, under number 616. Written informed consent was obtained from the patients and/or their relatives.
Clinical information of patients
Demographic data, ICU admission diagnostics, comorbidities, APACHE II (Acute Physiology and Chronic Health Evaluation) scores, SOFA (Sequen-tial Organ Failure Assessment) scores, mNUTRIC (modified Nutrition Risk in the Critically Ill) scores4,
mechanical ventilation requirements and total fluid balances of the patients were recorded. The mNUTRIC score was calculated at ICU admission to determine the nutritional risk of patients and to identify which patients would benefit from aggressive nutritional support therapy. Interleukin 6 levels were not used when calculating mNUTRIC scores. The presence of mNUTRIC score ≥ 5 was considered evidence of high nutritional risk. mNUTRIC score ≥ 6 was considered evidence of higher nutritional risk. Total fluid bal-ances of the patients were obtained from daily patient follow-up sheets noted by nurses. Maximal com-pressed QFMT (mcQFMT) and uncomcom-pressed QFMT (ucQFMT) measurements of both legs of the patients were recorded within 48 hours of ICU admission. The maximum (VCImax) and minimum (VCImin) diame-ters of the vena cava inferior (VCI), collapsibility of the VCI (VCIcol), pleural, hepatorenal, splenorenal and intraabdominal free fluid presence, and total fluid bal-ances of the patients were recorded to evaluate their volume status. In patients who were not mechanically ventilated, the presence of two or more criteria was accepted as hypervolemia. These criteria were VCImax > 2.1 cm, VCIcol < 50%, presence of free fluid in the third space (pleural or intra-abdominal) or total fluid balance above 2000 cc in the last 48 hours of ICU stay. In mechanically ventilated patients, the VCIcol criteria changed to <20%. These criteria were obtained from
INTRODUCTION
Malnutrition occurs in 20-50% of the patients admitted to hospitals1. Early nutritional screening
and detection of malnutrition and its treatment can reduce the requirement of mechanical ventila-tion, duration of hospitalizaventila-tion, and mortality in critically-ill patients2,3. However, there is no gold
standard method to detect malnutrition in inten-sive care unit (ICU) patients. Therefore, we can use the “modified Nutrition Risk in the Critically ill” (mNUTRIC) score to assess nutritional risk in intensive care units (ICU)4. The mNUTRIC score
can determine which patients can benefit from increased nutritional intake in ICU. Thus, early and more aggressive nutritional support in ICU patients with a high mNUTRIC score may improve their nutritional status and outcome. Another import-ant aspect of the mNUTRIC score is that it is cor-related with skeletal muscle loss of ICU patients5.
This is an expected condition as skeletal muscle tissue is adversely affected by systemic inflamma-tion and sepsis6. However, skeletal muscle tissue
is also affected by different factors such as immo-bilization, hypervolemia, advanced age, length of ICU stay, and duration of mechanical ventilation in ICU patients7. Furthermore, skeletal muscle mass
measurements are affected by fluid changes such as overhydration or dehydration8. Therefore, it is a
research topic to examine how muscle mass mea-surements change in ICU patients with different nutritional status (mNUTRIC), volume status, and other clinical settings. The muscle mass of ICU patients can be quantified by using ultrasonography (USG). Furthermore, quadriceps femoris muscle thickness (QFMT) can be measured by using USG as an indicator of lean body mass as it has been found to correlate with CT measurements9,10. In addition,
the swelling effect of hypervolemia on muscle mass may be corrected by maximum compression during USG measurement. Therefore, it is not known how uncompressed (UC) and maximal compressed (MC) QFMT measurements will change in ICU patients with different nutritional status, volume status, and other clinical settings. For this purpose, we aimed to determine the effect of different volume, nutri-tional risk, and other clinical settings of critically-ill patients on QFMT measurements by USG. Further-more, we hypothesized that measurement of QFMT can help determine nutritional risks of ICU patients, like the mNUTRIC score.
the results of previous studies and used in this study to distinguish the volume statuses of the patients11-14.
USG device and probe
GE brand S7 model ultrasonography device (GE Healthcare, General Electric Company, USA) and 5 megahertz (MHz) convex probe were used to measure mcQFMT and ucQFMT.
Measurement methods
Measurements were performed by an intensive care physician with adequate practical and theoretical training about ultrasonography and 2 years of expe-rience. It was known that mcQFMT and ucQFMT measurements by USG were a reproducible tech-nique with high Intraclass correlation coefficient10,15.
Patients were placed in the supine position before measurement. During the measurement, the physi-cian ensured the patella could move freely and that the quadriceps femoris muscle was relaxed. QFMT measurements were obtained at the midpoint of the line between the anterior superior iliac spine and the upper point of the patella by using USG15. At this point,
measurements were carried out in transverse section by not applying compression at first and by applying maximal compression the second time (Figure 1). Max-imum compression is an amount of pressure applied with the probe, which can minimize the muscle thick-ness observed during ultrasound B mode imaging, and it is a limit of pressure that cannot achieve a thinner muscle thickness with more pressure. QFMT mea-surements were obtained from the upper margin of the femur bone to the lower margin of the deep fascia of the quadriceps femoris muscle perpendicularly to the femur surface. Both mcQFMT and ucQFMT mea-surements were calculated as the average of three sep-arate measurements in each leg. Especially in some obese and edematous patients, a convex probe was
used for QFMT measurements due to the insufficiency of depth of the linear probe. VCI measurements were performed in accordance with the definition in the literature16. The presence of pleural or intra-abdominal
free fluid was investigated by using a convex probe.
STATISTICAL ANALYSIS
Statistical analysis was performed using the IBM SPSS statistics program version 22 (IBM, NY, USA). The distributions of continuous variables were examined using the Kolmogorov-Smirnov normality test. Continuous variables without normal distribu-tion were described as median (interquartile range). Categorical variables were described as frequencies and percentages. Comparison between survivors and non-survivors, hypervolemic and normovolemic patients and high nutritional risk and low nutritional risk patients were made by using the Mann-Whitney U test for continuous variables and the χ2 test for
qualitative data. The correlation between the data was investigated using Spearman’s correlation test. The parameters which had a significant difference in terms of nutritional risk in the univariate analysis were sub-jected to logistic regression analysis as multivariate analysis. Logistic regression analysis was performed to determine independent risk factors related to nutri-tional risk. After the determination of independent risk factors for mortality and nutritional status, ROC (Receiver Operating Characteristic) curve analyses were performed. P values lower than 0.05 were con-sidered statistically significant.
RESULTS
55 patients were included in the study. The demo-graphic data of the patients are presented in Table 1. Nutritional risk was high in 37 patients (mNUTRIC
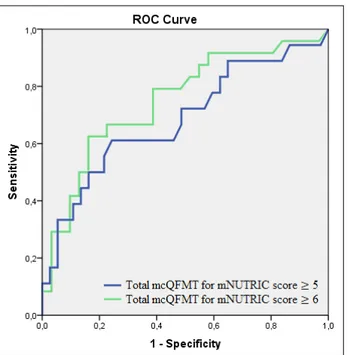
was independently associated with higher nutritional risk (mNUTRIC score ≥ 6) (Table 3). When the effect of mcQFMT on higher nutritional risk (mNUTRIC score ≥ 6) was investigated by ROC analysis, AUC was calcu-lated as 0.749 (p = 0.002) (Figure 2). It was determined that a total mcQFMT value below 1.36 cm was a pre-dictor for higher nutritional risk (mNUTRIC score ≥ 6) with 79% sensitivity and 70% specificity (Likelihood ratio = 2.04).
DISCUSSION
Hypervolemia is a condition frequently observed in critically-ill patients17. In one study, one-third of
patients who were followed-up in ICU for sepsis had hypervolemia, and almost all of them had positive fluid balance18. Similarly, hypervolemia was detected
in half of the patients in our study. Hypervolemia adversely affects nutritional status detection methods. For example, the presence of hypervolemia during
TABLE 1. DEMOGRAPHIC DATA AND ADMISSION DIAGNOSIS OF THE PATIENTS INCLUDED IN THE STUDY
Parameters All patients
(n=55) Age (Years)* 72 [57-83] Gender, F/M, n 25 / 30 APACHE II score* 24 [18-30] SOFA score* 6 [4-9] mNUTRIC score* 6 [4-7]
High Nutritional risk (mNUTRIC ≥ 5), n (%) 37 (67)
Total fluid balance for all days (mL)* 425 [(-460) – (2370)]
Total fluid balance for last 48 hours (mL)* 660 [(-433) – (3419)]
Hypervolemic volume status, n (%) 27 (49)
Invasive mechanical ventilation, n (%) 22 (40)
Mortality, n (%) 22 (40)
Length of ICU stay (day)* 5 [3-11] Admission diagnosis Infection, n (%) 48 (87.3) Sepsis, n (%) 38 (69.1) Pulmonary, n (%) 31 (56.4) Renal, n (%) 20 (36.4) Neurological, n (%) 18 (32.7) Cardiovascular, n (%) 13 (23.6) Shock, n (%) 13 (23.6) Malignancy, n (%) 11 (20.0)
*Data are presented as median and [interquartile range]. N, n: number; F: female; M: male; APACHE-II: Acute Physiology and Chronic Health Evaluation Score; SOFA: Sequential Or-gan Failure Assessment; ICU: Intensive Care Unit; mNUTRIC: modified Nutrition Risk in the Critically Ill
score ≥ 5); 27 patients were hypervolemic. All data with statistically significant differences in terms of volume and nutrition risk are presented in Table 2. There was a moderate correlation between total mcQFMT measurements and mNUTRIC score (p = 0.001, r = -0.425), APACHE II score (p = 0.007, r = -0.359), SOFA score (p = 0.005, r = -0.371), mortality (p=0.012, r=-0.338), duration of ICU stay (p=0.018, r=-0.319), invasive mechanical ventilation requirement (p = 0.006, r = -0.367), and sepsis (p=0.008, r=-0.356). When logistic regression analysis was performed, it was revealed that total mcQFMT was independently associated with high nutritional risk (mNUTRIC score ≥ 5) (Table 3). When the effect of mcQFMT on high nutritional risk (mNUTRIC score ≥ 5) was investi-gated by ROC analysis, AUC was calculated as 0.684 (p = 0.028) (Figure 2). It was determined that a total mcQFMT value below 1.69 cm was a predictor for high nutritional risk (mNUTRIC score ≥ 5) with 61% sen-sitivity and 71% specificity (Likelihood ratio = 2.05).
The mNUTRIC score was also ≥ 6 in 31 patients, as the majority of these 37 patients with high nutritional risk. In addition to this higher nutritional risk defined by the mNUTRIC ≥ 6, there was also a statistically significant difference in right mcQFMT (p=0.015), left mcQFMT (p=0.0001), total mcQFMT (p=0.002), APACHE II score (p = 0.0001), SOFA score (p=0.0001), presence of infection (p = 0.017), sepsis (p = 0.001), shock (p = 0.003) at ICU admission, invasive mechan-ical ventilation requirement (p=0.002), and mortality (p=0.0001). It was also revealed that the total mcQFMT
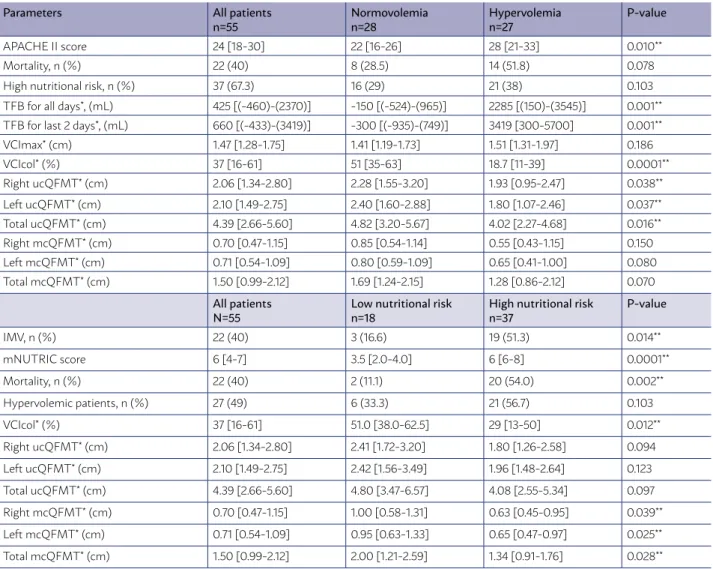
TABLE 2. CLINICAL PARAMETERS ACCORDING TO VOLUME STATUS AND NUTRITIONAL RISK OF THE PATIENTS INCLUDED IN THE STUDY
Parameters All patients
n=55 Normovolemian=28 Hypervolemian=27 P-value
APACHE II score 24 [18-30] 22 [16-26] 28 [21-33] 0.010**
Mortality, n (%) 22 (40) 8 (28.5) 14 (51.8) 0.078
High nutritional risk, n (%) 37 (67.3) 16 (29) 21 (38) 0.103
TFB for all days*, (mL) 425 [(-460)-(2370)] -150 [(-524)-(965)] 2285 [(150)-(3545)] 0.001** TFB for last 2 days*, (mL) 660 [(-433)-(3419)] -300 [(-935)-(749)] 3419 [300-5700] 0.001**
VCImax* (cm) 1.47 [1.28-1.75] 1.41 [1.19-1.73] 1.51 [1.31-1.97] 0.186 VCIcol* (%) 37 [16-61] 51 [35-63] 18.7 [11-39] 0.0001** Right ucQFMT* (cm) 2.06 [1.34-2.80] 2.28 [1.55-3.20] 1.93 [0.95-2.47] 0.038** Left ucQFMT* (cm) 2.10 [1.49-2.75] 2.40 [1.60-2.88] 1.80 [1.07-2.46] 0.037** Total ucQFMT* (cm) 4.39 [2.66-5.60] 4.82 [3.20-5.67] 4.02 [2.27-4.68] 0.016** Right mcQFMT* (cm) 0.70 [0.47-1.15] 0.85 [0.54-1.14] 0.55 [0.43-1.15] 0.150 Left mcQFMT* (cm) 0.71 [0.54-1.09] 0.80 [0.59-1.09] 0.65 [0.41-1.00] 0.080 Total mcQFMT* (cm) 1.50 [0.99-2.12] 1.69 [1.24-2.15] 1.28 [0.86-2.12] 0.070 All patients
N=55 Low nutritional riskn=18 High nutritional riskn=37 P-value
IMV, n (%) 22 (40) 3 (16.6) 19 (51.3) 0.014** mNUTRIC score 6 [4-7] 3.5 [2.0-4.0] 6 [6-8] 0.0001** Mortality, n (%) 22 (40) 2 (11.1) 20 (54.0) 0.002** Hypervolemic patients, n (%) 27 (49) 6 (33.3) 21 (56.7) 0.103 VCIcol* (%) 37 [16-61] 51.0 [38.0-62.5] 29 [13-50] 0.012** Right ucQFMT* (cm) 2.06 [1.34-2.80] 2.41 [1.72-3.20] 1.80 [1.26-2.58] 0.094 Left ucQFMT* (cm) 2.10 [1.49-2.75] 2.42 [1.56-3.49] 1.96 [1.48-2.64] 0.123 Total ucQFMT* (cm) 4.39 [2.66-5.60] 4.80 [3.47-6.57] 4.08 [2.55-5.34] 0.097 Right mcQFMT* (cm) 0.70 [0.47-1.15] 1.00 [0.58-1.31] 0.63 [0.45-0.95] 0.039** Left mcQFMT* (cm) 0.71 [0.54-1.09] 0.95 [0.63-1.33] 0.65 [0.47-0.97] 0.025** Total mcQFMT* (cm) 1.50 [0.99-2.12] 2.00 [1.21-2.59] 1.34 [0.91-1.76] 0.028**
*Data are presented as median and [interquartile range]; ** There was statistically significant difference; n: number; IMV: Invasive mechanical ventilation; APACHE II score: Acute Physiology and Chronic Health Evaluation II score; TFB: Total Fluid Balance; SOFA score: Sequential Organ Failure Assessment score; mNUTRIC: modified Nutrition Risk in the Critically Ill; VCImax: Maximum vena cava inferior diamater; VCIcol: Vena cava inferior collapsibility index; QFMT: quadriceps femoris muscle thickness; ucQFMT: Uncompressed QFMT; mcQFMT: Maximum compressed QFMT;
TABLE 3. LOGISTIC REGRESSION ANALYSIS FOR DETERMINING INDEPENDENT RISK FACTORS FOR HIGH NUTRITIONAL RISK IN THE STUDY POPULATION
Logistic regression analysis for high nutritional risk (mNUTRIC score ≥ 5)
Parameters P-value Exp (B) CI 95% (Confidence Interval)
Total mcQFMT 0.019 0.256 0.082-0.800
VCIcol 0.177 0.972 0.932-1.013
Requirement of IMV 0.214 3.143 0.516-19.160
Volume status 0.902 0.904 0.183-4.462
Length of ICU stay 0.136 0.939 0.865-1.020
Logistic regression analysis for higher nutritional risk (mNUTRIC score ≥ 6)
Parameters P-value Exp (B) CI 95% (Confidence Interval)
Total mcQFMT 0.009 0.144 0.033-0.620
VCIcol 0.029 0.947 0.901-0.994
Requirement of IMV 0.158 3.770 0.598-23.779
Volume status 0.266 0.389 0.074-2.052
Length of ICU stay 0.075 0.911 0.823-1.009
QFMT: quadriceps femoris muscle thickness; mcQFMT: Maximum compressed QFMT; IMV: Invasive mechanical ventilation; mNUTRIC: modified Nutrition Risk in the Critically Ill; VCIcol: Vena cava inferior collapsibility index;
DEXA measurements causes errors in the detection of lean body mass19. Body mass index, which is a
sim-ple measurement method, cannot predict malnutri-tion, especially in patients with volume overload20.
The presence of edema, especially in ICU patients, is a serious problem for the use of anthropometric measurements for evaluation of malnutrition21. Serum
levels of biochemical markers used to detect malnu-trition such as prealbumin, albumin, and transferrin vary with the intravascular volume excess and infec-tion or inflammainfec-tion22. For these reasons, it may be
helpful to use nutritional risk assessment tools to assess nutritional status in ICU patients. In fact, the mNUTRIC score is a nutritional risk assessment tool developed specifically for ICU. However, a significant limitation of usage of the mNUTRIC score is that it does not include anthropometric or body composi-tion parameters. Therefore, as the results of this study suggest, the use of total QFMT measurements may be more useful in assessing the nutritional risk of ICU patients. However, QFMT measurements with the use of USG may be false since the capacity of the skeletal muscles to contain fluids is quite high8. In our study,
ucQFMT values measured by USG had a statistically significant difference when compared to hypervole-mic patients and normovolehypervole-mic patients. However, the effects of excess fluid volume on maximal compressed muscle thickness are unknown. In our study, there was no statistically significant difference between hypervolemic and normovolemic patients in terms of mcQMFT. Therefore, it can be thought that excess fluid volume has less effect on the mcQFMT measure-ment when compared to the ucQFMT measuremeasure-ment in ICU patients.
In a previous study, QFMT measurements by USG and without compression were found to be negatively correlated with malnutrition23. In addition, in this
study, thinner QFMT measurements were obtained in malnourished dialysis patients compared to healthy and well-nourished individuals. In another study, it was found that uncompressed QFMT measurements by USG could be high in ICU patients with better nutritional support24. In one study, it was found that
maximal compressed QFMT measurements obtained by USG showed moderate correlation with abdominal wall muscle section in abdominal CT images of ICU patients10. Therefore, we can conclude that QFMT
measurements are directly related to nutritional sta-tus because they contain data related to body com-position. Thus, this feature of QFMT measurement
can provide an advantage in evaluating nutritional status compared to the mNUTRIC score. We noticed that the relationship between the maximum com-pressed QFMT measurements and nutritional status has not been previously investigated in ICU patients. Therefore, this study is very important for nutrition literature. Also in our study, when uncompressed and maximal compressed QFMT measurements were eval-uated in terms of their ability to detect nutritional risk, mcQFMT measurements were found to be very pre-cious for determining nutritional risk in ICU patients. We also understood that the total mcQFMT measure-ments (total mcQFMT measuremeasure-ments of right and left legs) can be used to detect the nutritional risk in ICU patients with different volume statuses.
CONCLUSION
The total maximum compressed QFMT measure-ments obtained by the sum of the maximum com-pressed QFMT measurements of left and right legs can be used as a novel ultrasonographic nutritional risk assessment parameter in medical ICU patients with different volume statuses. Thus, patients who have nutritional risk or who can benefit from aggressive nutritional therapy can be easily identified in these patient groups.
Conflicts of Interest:
The authors declare no conflict of interest. Acknowledgments
No financial support or grant was received for this study.
Author’s Contrıbuıtıons
1. Uğur Özdemir, Contribution: Obtaining clinical data from patients, detecting appropriate patients, col-lecting ultrasonography measurement data and images, analyzing data, researching literature, writing the article. 2. Merve Özdemir, Contribution: Researching lit-erature, writing the article.
3. Gulbin Aygencel Contribution: Analyzing the data, researching literature, writing the article.
4. Burcu Kaya, Contribution: Obtaining clinical data from patients, detecting appropriate patients, researching literature
5. Melda Türkoğlu, Contribution: Obtaining clini-cal data from patients, detecting appropriate patients, researching literature
RESUMO
OBJETIVO: Neste estudo observacional prospectivo, objetivamos investigar o papel da espessura do músculo quadríceps femoral (QFMT)
comprimido (mc) e não comprimido (uc) medida pela ultrassonografia (USG) na detecção do risco nutricional em pacientes de terapia intensiva (ICPs) com status de volume diferente.
MÉTODOS: Cinquenta e cinco pacientes foram incluídos. As medidas direita, esquerda e total de ucQFMT e mcQFMT foram obtidas por
um dispositivo USG padrão nas primeiras 48 horas após a admissão na UTI. O exame clínico e o dispositivo USG foram usados para determinar o status volumétrico dos pacientes. Sofa, Apache II, escores Nutric modificados e dados demográficos foram coletados.
RESULTADOS: Houve diferença significativa entre o risco nutricional dos pacientes em termos de medidas da QTFMT esquerda, direita
e total (p=0,025, p=0,039; p=0,028, respectivamente), necessidade de ventilação mecânica (p=0,014), presença de infecção (p=0,019) e sepse (p=0,006). Não houve diferença significativa entre os diferentes status de volume em termos de medidas de mcQFMT. Na análise de variância múltipla, verificou-se que as medidas da FCFMT estavam independentemente associadas a alto risco nutricional (p=0,019, Exp (B)=0,256, 95%CI=0,082-0,800 para escore Nutric modificado ≥ 5) e maior risco nutricional (p=0,009, Exp (B)=0,144, 95%CI=0,033-0,620 para o escore Nutric modificado ≥ 6). O valor total de mcQFMT abaixo de 1,36 cm foi um preditor de maior risco nutricional com sensibilidade de 79% e especificidade de 70% (ASC=0,749, p=0,002, razão de verossimilhança = 2,04).
CONCLUSÃO: A medida ultrassonográfica do mcQFMT total pode ser usada como um novo parâmetro de avaliação de risco nutricional
em ICPs médicas com diferentes status de volume. Assim, pacientes que podem se beneficiar de uma terapia nutricional agressiva podem ser facilmente identificados nesses grupos de pacientes.
PALAVRAS-CHAVE: Ultrassonografia. Músculo quadríceps. Desnutrição. Unidades de Terapia Intensiva.
REFERENCES
1. Norman K, Pichard C, Lochs H, Pirlich M. Prognostic impact of disease-re-lated malnutrition. Clin Nutr. 2008;27(1):5-15.
2. Middleton MH, Nazarenko G, Nivison-Smith I, Smerdely P. Prevalence of malnutrition and 12-month incidence of mortality in two Sydney teaching hospitals. Intern Med J. 2001;31(8):455-61.
3. Correia MI, Waitzberg DL. The impact of malnutrition on morbidity, mor-tality, length of hospital stay and costs evaluated through a multivariate model analysis. Clin Nutr. 2003;22(3):235-9.
4. Rahman A, Hasan RM, Agarwala R, Martin C, Day AG, Heyland DK. Iden-tifying critically-ill patients who will benefit most from nutritional therapy: further validation of the “modified NUTRIC” nutritional risk assessment tool. Clin Nutr. 2016;35(1):158-62.
5. Mukhopadhyay A, Tai BC, Remani D, Henry J, Kowitlawakul Y, Puthucheary ZA. Nutritional risk assessment at admission can predict subsequent muscle loss in critically ill patients. Eur J Clin Nutr. 2018;72(8):1187-90. 6. Jonghe B, Lacherade JC, Sharshar T, Outin H. Intensive care unit-acquired
weak-ness: risk factors and prevention. Crit Care Med. 2009;37(10 Suppl):S309-15. 7. Kizilarslanoglu MC, Kuyumcu ME, Yesil Y, Halil M. Sarcopenia in critically
ill patients. J Anesth. 2016;30(5):884-90.
8. Mayans D, Cartwright MS, Walker FO. Neuromuscular ultrasonography: quantifying muscle and nerve measurements. Phys Med Rehabil Clin N Am. 2012;23(1):133-48.
9. Thomaes T, Thomis M, Onkelinx S, Coudyzer W, Cornelissen V, Vanhees L. Reliability and validity of the ultrasound technique to measure the rec-tus femoris muscle diameter in older CAD-patients. BMC Med Imaging. 2012;12:7.
10. Paris MT, Mourtzakis M, Day A, Leung R, Watharkar S, Kozar R, et al. Val-idation of bedside ultrasound of muscle layer thickness of the quadriceps in the critically ıll patient (VALIDUM Study). JPEN J Parenter Enteral Nutr. 2017;41(2):171-80.
11. Miller JB, Lee A, Suszanski JP, Tustian M, Corcoran JL, Moore S, et al. Chal-lenge of intravascular volume assessment in acute ischemic stroke. Am J Emerg Med. 2018;36(6):1018-21.
12. Rudski LG, Lai WW, Afilalo J, Hua L, Handschumacher MD, Chandrase-karan K, et al. Guidelines for the echocardiographic assessment of the right heart in adults: a report from the American Society of Echocardiography endorsed by the European Association of Echocardiography, a registered branch of the European Society of Cardiology, and the Canadian Society of Echocardiography. J Am Soc Echocardiogr. 2010;23(7):685-713.
13. Stawicki SP, Braslow BM, Panebianco NL, Kirkpatrick JN, Gracias VH, Hayden GE, et al. Intensivist use of hand-carried ultrasonography to mea-sure IVC collapsibility in estimating intravascular volume status: correlations with CVP. J Am Coll Surg. 2009;209(1):55-61.
14. Stawicki SP, Adkins EJ, Eiferman DS, Evans DC, Ali NA, Njoku C, et al. Prospective evaluation of intravascular volume status in critically ill patients: does inferior vena cava collapsibility correlate with central venous pressure? J Trauma Acute Care Surg. 2014;76(4):956-64.
15. Tillquist M, Kutsogiannis DJ, Wischmeyer PE, Kummerlen C, Leung R, Stollery D, et al. Bedside ultrasound is a practical and reliable measurement tool for assessing quadriceps muscle layer thickness. JPEN J Parenter Enteral Nutr. 2014;38(7):886-90.
16. Levitov A, Frankel HL, Blaivas M, Kirkpatrick AW, Su E, Evans D, et al. Guide-lines for the appropriate use of bedside general and cardiac ultrasonography in the evaluation of critically ıll patients-part ıı: cardiac ultrasonography. Crit Care Med. 2016;44(6):1206-27.
17. Bagshaw SM, Bellomo R, Kellum JA. Oliguria, volume overload, and loop diuretics. Crit Care Med. 2008;36(4 Suppl):S172-8.
18. Mitchell KH, Carlbom D, Caldwell E, Leary PJ, Himmelfarb J, Hough CL. Volume overload: prevalence, risk factors, and functional outcome in sur-vivors of septic shock. Ann Am Thorac Soc. 2015;12(12):1837-44. 19. Roubenoff R, Kehayias JJ, Dawson-Hughes B, Heymsfield SB. Use of
dual-energy x-ray absorptiometry in body-composition studies: not yet a “gold standard”. Am J Clin Nutr. 1993;58(5):589-91.
20. Campillo B, Paillaud E, Uzan I, Merlier I, Abdellaoui M, Perennec J, et al. Comité de Liaison Alimentation-Nutrition. Value of body mass index in the detection of severe malnutrition: influence of the pathology and changes in anthropometric parameters. Clin Nutr. 2004;23(4):551-9.
21. Jeejeebhoy KN. Nutritional assessment. Nutrition. 2000;16(7-8):585-90. 22. Fuhrman MP, Charney P, Mueller CM. Hepatic proteins and nutrition
assess-ment. J Am Diet Assoc. 2004;104(8):1258-64.
23. Sabatino A, Regolisti G, Delsante M, Di Motta T, Cantarelli C, Pioli S, et al. Noninvasive evaluation of muscle mass by ultrasonography of quadriceps femoris muscle in end-stage renal disease patients on hemodialysis. Clin Nutr. 2019;38(3):1232-9.
24. Fetterplace K, Deane AM, Tierney A, Beach LJ, Knight LD, Presneill J, et al. Targeted full energy and protein delivery in critically ıll patients: a pilot randomized controlled trial (FEED Trial). JPEN J Parenter Enteral Nutr. 2018;42(8):1252-62.