Evaluation of Detection Limits with Wavelength Dispersive X-Ray Fluorescence
Spectrometry
EBRU SENEMTAŞI ÜNAL1, NESLİHAN EKİNCİ2
1Department of Electricity and Energy, Ağrı İbrahim Çeçen University, Ağrı, Turkey 2Department of Physics, Faculty of Science, Atatürk University, 25240, Erzurum, Turkey
Abstract
The influence of analyte mass concentration on the determination of detection limits has been investigated by using WDXRF (Wavelength dispersive X- ray fluorescence) spectrometry. Ti, V, Cr, Mn, Fe, Ni, Cu, Zn, As, Y, Zr, Nb, Mo, Ag, Cd, Sb, Nd, Gd, Er elements and binary and triple combination of these elements have been used. The samples have been selected considering the absorption edges due to the importance of the effect of matrix absorption and enhancement. The elements which have absorption edges that are close to each other have been used observe the matrix absorption and enhancement. From this results corresponding to the interval of 5-25 times the best value of the detection limits of analytical concentration values are found to be the ideal values. It is concluded that WDXRF spectrometry is a suitable technique for the determination of detection limits.
Keywords: analyte, detection limits, WDXRF, matrix, absorption and enhancement.
1. Introduction
X-ray fluorescence spectrometry is one of the appropriate techniques for elemental analysis of materials. This technique is based on the sample excitation with the release of the secondary X-rays. They contain a concentration of the elements in an unknown sample by comparison with standards of known values located in another sample PITSCH (2000).
Received: 29.09.2017 Revised: 26.10.2017 Accepted: 11.11.2017
Corresponding author: Ebru Senemtaşı Ünal, PhD Department of Electricity and Energy, Ağrı İbrahim Çeçen University, Ağrı, Turkey
E-mail: [email protected]
Cite this article as: E. S. Ünal, N. Ekinci,Evaluation of Detection Limits with Wavelength Dispersive X-Ray Fluorescence Spectrometry, Eastern Anatolian Journal of Science, Vol. 3, Issue 2, 38-47, 2017
A commercial WDXRF (Wavelength dispersive X-ray fluorescence) spectrometer (Bruker S4 Explorer, Karlsruhe, West Germany) was used for analysis of the different samples. All the elements in the sample can be determined simultaneously in the WDXRF spectrometry. This instrument is usually equipped with a 1 kW Rh-anode tube working at a voltage range of 20-50 kV and a current from 50 to 20 mA. It is possible to use primary beam filters (made of Al or Cu) between the primary radiation and the sample holder to reduce the background continuum and to improve the signal-to-noise ratio. Energy resolution and efficiency for each analytical line also depend on the collimator aperture and the analyzer crystals in use. Detection can be performed using a flow proportional counter (light elements) or a scintillation
counter (heavy elements)
GONZALEZ-FERNANDEZ et al. (2009). In this work, analyses were made in vacuum atmosphere.
The detection limits, is of interest to analytical chemists due to the trace detection of the compound. In many literature, improved analytical methods used to determine the detection limit and new instruments used are mentioned. THOMPSON (1998) mentioned in his theoretical work that the limit of detection can never be fully interpreted, in fact it seems to be a very difficult subject to be understood and defined on the basis of this seemingly simple matter.
Then, CURRIE (2000) noted that despite the successful work on the detection limit, some problems still exist in this work. The problem of determining the limit of detection has been shown to occur more in biological and environmental samples. ROUSSEAU (2001) investigated the effect of analytical errors on the detection limit, using some chemical samples, and calculated how much the systematic and random error sources affected the result. In the following years TIWARI et al. (2005) investigated the effect of analyte mass concentration on the detection limit using total reflectance X-ray fluorescence (TXRF) and energy X-ray fluorescence (EDXRF) spectrometers. As a result, they observed that the analyte mass concentration affected the detection limit values. SHALTOUT et al. (2007)
determined the detection limit values by atomic absorption spectroscopy using Cd, Ni, Pb and Zn samples and showed that the detection limit value could be decreased by adjusting the absorption mode and counting time. KARJOU (2007) investigated matrix effects on the detection limit by using TXRF spectrometry using multiple standard solutions of the NH4NO3 sample at various concentrations. He observed that the low matrix concentration did not affect the detection limit, but the high matrix concentration strongly affected the detection limit. He also investigated the effect of sample mass on the detection limit using soil and blood samples and showed that the detection limit increased with increasing sample mass in the concentration unit but the detection limit increased with increasing sample mass in mass unit.
In studies carried out until today, the effects of matrix effects and analytical mass concentration on the detection limit have been investigated using various instruments, liquids and biological samples on the detection limit. But we know that since the detection limit is an indication of sensitivity, the most accurate analytical mass that should be used to obtain the most accurate measurement should be determined in scientific studies. In this study, a study was carried out to investigate the values of appropriate analyte concentrations and obtain more accurate results. Here, it is aimed to achieve accurate sample standards using WDXRF spectrometer.
2. Experimental Details
The detection limit is usually defined as the smallest amount of an analyte that can be detected in a specimen. However, it is often misinterpreted as the smallest concentration of an analyte that can be determined with reliability in a given sample ROUSSEAU (2001). In X-ray fluorescence measurements, its most common definition is the amount of analyte that gives a net line intensity equal to three times the square root of the background intensity for a specified counting time or the amount that gives a net intensity equal to three times the standard counting error of the background intensity. Hence, detection limit is related to the capability of instrument to distinguish peak intensity from the fluctuations of the background intensity due to counting statistics, or background noise EKINCI et al. (2013) (Furthermore, the detection limit calculations are based on background measurements, which are below any peak intensity used for a possible determination.
The following formula is commonly accepted to define the detection limit in XRF techniques VAN GRIEKEN (1993) and KLOCKENKAMPER (1997),
𝐶𝐶
𝐷𝐷𝐷𝐷=
3𝑆𝑆�𝑁𝑁𝐵𝐵𝑇𝑇�1 2�
(1)
Where CDL is the detection limit (mass or concentration unit), NB is the intensity of the background under the respective peak in count per second (cps), S is the sensitivity (net peak counts per second, per mass or concentration unit and T is the counting time (s). The equation shows that increasing S and T, and reducing NB improves the CDL.
Mathematically, as per the IUPAC recommendation, the detection limit has been defined in terms of standard counting error of the background intensity BERTIN (1975). If σp and σb are the counting errors of the individual peak and the background, respectively, then the Standard counting error for a net count can be expressed as,
𝜎𝜎
=�
𝜎𝜎𝑝𝑝2+ 𝜎𝜎𝑏𝑏2In the limit of detection one can assume 𝜎𝜎𝑏𝑏≈ 𝜎𝜎𝑝𝑝
.
Therefore
𝜎𝜎 = �2𝜎𝜎
𝑏𝑏For 95% confidence level, the counting error would be
2𝜎𝜎 = 3𝜎𝜎
𝑏𝑏= 3�𝑁𝑁
𝐵𝐵By taking into account the counting time T and the slope m of fluorescence intensity vs. analyte concentration curve one can write the expression for minimum detectable concentration for an analyte element as
𝐶𝐶
𝐷𝐷𝐷𝐷=
𝑚𝑚
3
�𝑁𝑁
𝑇𝑇
𝐵𝐵or
𝐶𝐶
𝐷𝐷𝐷𝐷=
3�𝐼𝐼𝐼𝐼𝐴𝐴𝑏𝑏 𝐶𝐶𝐴𝐴,
𝑚𝑚 = 𝐼𝐼
𝐴𝐴𝐶𝐶
𝐴𝐴�
(2)Where Ib= background intensity (NB/T); IA= net area intensity; CA= mass concentration of analyte; NB=
background counts in a given time T; m= IA/CA, i.e. slope of analyte counts concentration curve; CDL= minimum detectable concentration of analyte. From Eq. (2), it is clear that, for a specified counting time, the minimum detectable concentration of analyte or detection limit depends mainly on two parameters: the background intensity Ib and the net area intensity per unit analyte mass (IA/CA) TIWARI (2005).
XRF is often studied in solid samples. However, analysis of the solution can be performed using a suitable apparatus. Solid samples or adjusting surface sample is irradiated directly or tablet then made into a powder before irradiation. Sample will be considered in the preparation to ensure homogeneity biggest point is. Quick and simple way to prepare powder is directly pressed into the pallets of equal density. Samples were irradiated by placing the cell sample prepared by the method of assembly.
In this study, ZSX 1000e wavelength X-ray fluorescence device produced by Rigaku Company was used. In the WDXRF spectrometer, the analyzer crystal distributes the secondary characteristic X-ray so that each wavelength can be measured separately. X-ray fluorescence spectroscopy usually involves working with solid samples. However, the analysis of the solutions can also be carried out using appropriate tool. The solid samples are either irradiated directly by smoothing a surface such as in steel analysis, or first powdered and then tableted and irradiated. The greatest point to note in preparing the sample is to ensure homogeneity. If the sample is in the form of very fine powder or if it can be crumbled to the grain size below 200 mesh, the powder sample is mixed with the necessary materials and then pressed into a tablet.
Analytical information for long wave length will be generated when well powdered powders are pressed at high pressure. Powders can be pressed into aluminum containers and steel circles. Alternatively, a boric acid binder or a hard pressing binder may be used.
In this study, samples have been selected considering the absorption edges due to the effect of matrix absorption and enhancement. The elements which have absorption edges that are close to each other have been used observe the matrix absorption and enhancement. Ti, V, Cr, Mn, Fe, Ni, Cu, Zn, As, Y, Zr, Nb, Mo, Ag, Cd, Sb, Nd, Gd, Er elements and binary and triple combination of these elements have been used. A total of 69 samples were prepared, including the pure substance and mixtures. Mixtures to study the effect on the detection limit of the concentration of analyte and matrix were prepared at different concentrations. Powdered samples were first milled using an agate mortar and then sieved through 100-400 mesh fine sieves to remove particle size effect. Then all the pressed samples were prepared in the same form with a thickness of 13 mm by applying a pressure of 10 tons equally to each sample with a pressing machine. Any losses that might occur during sample preparation and error to minimize tools are used. Samples were prepared in the form of pellets of mass 0.6g. The advantage of making these pellets is that interelement enhancement effects in the sample are minimized. Counting time for each sample has been set 10800s. Manufactured by Rigaku Company ZSX 1000e WDXRF instrument was used. The data received by the WDXRF system is transferred to the origin pro 7.5 of the program and element spectra have been drawn. Representatively, the spectrum of 0.6g Cr sample is showed in Fig 1.
Detection limits of the elements were calculated from using Eq (2). Calculated results are shown in the table 1, table 2, table 3, table 4 and table 5.
Figure 1. 0.6g Cr sample of X-ray spectrum of Kα and Kβ.
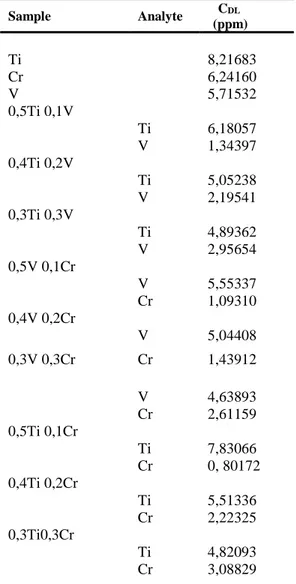
Table 1. The CDL has been calculated for Ti, Cr, V elements and binary and triple combination of these elements.
Sample Analyte CDL (ppm) Ti 8,21683 Cr 6,24160 V 5,71532 0,5Ti 0,1V Ti 6,18057 V 1,34397 0,4Ti 0,2V Ti 5,05238 V 2,19541 0,3Ti 0,3V Ti 4,89362 V 2,95654 0,5V 0,1Cr V 5,55337 Cr 1,09310 0,4V 0,2Cr V 5,04408 0,3V 0,3Cr Cr 1,43912 V 4,63893 Cr 2,61159 0,5Ti 0,1Cr Ti 7,83066 Cr 0, 80172 0,4Ti 0,2Cr Ti 5,51336 Cr 2,22325 0,3Ti0,3Cr Ti 4,82093 Cr 3,08829 0 20 40 60 80 100 0 5 10 15 20 25 Cr -Cr KA Cr KB - Intensity 2θ kcps degree
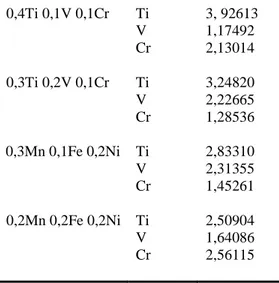
0,4Ti 0,1V 0,1Cr Ti 3, 92613 V 1,17492 Cr 2,13014 0,3Ti 0,2V 0,1Cr Ti 3,24820 V 2,22665 Cr 1,28536 0,3Mn 0,1Fe 0,2Ni Ti 2,83310 V 2,31355 Cr 1,45261 0,2Mn 0,2Fe 0,2Ni Ti 2,50904 V 1,64086 Cr 2,56115
Table 2. The CDL has been calculated for As, Y, Zr, Nb, Mo elements.
Sample CDL (ppm) As 5,15022 Y 7,35368 Zr 7,50342 Nb 7,94702 Mo 8,02405
Table 3. The CDL has been calculated for Fe, Mn, Ni elements and binary and triple combination of these elements.
Sample Analyte CDL (ppm) Fe 5,69786 Mn 5,26947 Ni 5,14553 0,5Mn 0,1Fe Mn 3,14869 Fe 0,38061 0,4Mn 0,2Fe Mn 4,62920 Fe 0,55162 0,3Mn 0,3Fe Mn 4,93372 Fe 2,16401 0,5Mn 0,1Ni Mn 3,64869 Ni 2,96533 0,4Mn 0,2Ni Mn 2,72444 0,3Mn 0,3Ni Ni 4,14291 Mn 2,17375 Ni 5,40387 0,5Fe 0,1Ni Fe 5,38086 Ni 1, 74123 0,4Fe 0,2Ni
Fe 4,79443 Ni 2,37291 0,3Fe 0,3Ni Fe 4,19142 Ni 4,61387 0,4Mn 0,1Fe 0,1Ni Mn 3, 61961 Fe 0,24320 Ni 1,65356 0,3Mn 0,2Fe 0,1Ni Mn 2,84615 Fe 0,61279 Ni 1,81125 0,3Mn 0,1Fe 0,2Ni Mn 2,14044 Fe 0,25263 Ni 2,78491 0,2Mn 0,2Fe 0,2Ni Mn 1,88106 Fe 0,51117 Ni 2,82660
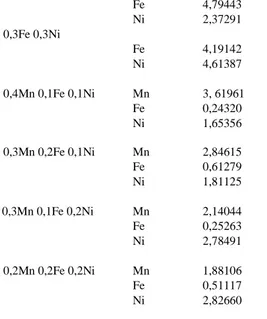
Table 4. The CDL has been calculated for Ag, Cd, Sb elements and binary and triple combination of these elements.
Sample Analyte CDL (ppm) Ag 8,12247 Cd 9,22396 Sb 10,0217 0,5Ag0,1Cd Ag 7,65784 Cd 0,54496 0,4Ag0,2Cd Ag 6,44775 Cd 1,82913 0,3Ag0,3Cd Ag 3,92228 Cd 4,78321 0,5Cd0,1Sb Cd 7,78526 Sb 1,58377 0,4Cd0,2Sb Cd 6,41392 Sb 3,04778 0,3Cd0,3Sb Cd 4,93237 Sb 4,61682 0,5Ag 0,1Sb Ag 5,75317 Sb 1,93770 0,4Ag0,2Sb Ag 4,72392 Sb 2,94944 0,3Ag0,3Sb Ag 3,90539 Sb 4,85898 0,4Ag0,1Cd0,1Sb
Ag 5,52481 Cd 1,26692 Sb 1,68731 0,3Ag 0,2Cd 0,1Sb Ag 5,03097 Cd 2,35657 Sb 1,71835 0,3Ag 0,1Cd 0,2Sb Ag 4,61418 Cd 1,51606 Sb 2,84283 0,2Ag 0,2Cd 0,2Sb Ag 3,25696 Cd 2,43185 Sb 3,21256
Table 5. The CDL has been calculated for Nd, Er, Sb elements and binary and triple combination of these elements.
Sample Analyte CDL (ppm) Nd 15,1860 Gd 17,8293 Er 18,6608 0,5Nd0.1Gd Nd 14,1688 Gd 1,26718 0,4Nd0,2Gd Nd 12,2619 Gd 3,64456 0,3Nd0,3Gd Nd 1,12522 Gd 16,2169 0,5Gd0,1Er Gd 16,0117 Er 1,89313 0,4Gd0,2Er Gd 13,9736 Er 4,17825 0,3Gd0,3Er Gd 9,84345 Er 9,14732 0,5Nd 0,1Er Nd 10,0412 Er 3,65477 0,4Nd 0,2Er Nd 9,31480 Er 6,24224 0,3Nd 0,3Er Nd 5,87458 Er 9,56043 0,4Nd 0,1Gd 0,1Er
Nd 11,2636 Gd 1,05750 Er 2,03146 0,3Nd 0,2Gd 0,1Er Nd 11,1478 Gd 3,51325 Er 2,58146 0,3Nd 0,1Gd 0,2Er Nd 9,65643 Gd 1,27062 Er 2,62759 0,2Nd 0,2Gd 0,2Er Nd 2,17820 Gd 4,45414 Er 9,15146
4. Result and Discussion
In this study, mixtures of various ratios of elements on the CDL are used to observe the effects of matrix. To investigate the analyte mass concentration on detection limits, in the present study, Ti, V, Cr, Mn, Fe, Ni, Cu, Zn, As, Y, Zr, Nb, Mo, Ag, Cd, Sb, Nd, Gd, Er elements and binary and triple combination of these elements were chosen as test samples. Tables 1, 2, 3, 4 and 5 demonstrate the detection limit values of
these samples. As a result, it was found that the detection limit for the low analyte concentration was more affected than the high analyte concentration. If the analyte concentration is reduced, the background significantly decreases as the fluorescence peak increases the tail width. Decreasing the analyte concentration causes the analyte peak to weaken and causes the detection limit value to be smaller than the appropriate value. 20 25 30 35 40 1.0 1.5 2.0 2.5 3.0 Meausered Data Fitted Data CDL ( ppm ) Analyte Concentration (%) 35 40 45 50 2.0 2.5 3.0 3.5 4.0 Meausered Data Fitted Data CDL ( ppm ) Analyte Concentration (%) (a) (b) 20 25 30 35 40 1.0 1.5 2.0 2.5 Meausered Data Fitted Data CDL ( ppm ) Analyte Concentration (%) (c)
Figure 2. (a) Variation of Ti detection limits with analyte concentration in the sample of TiVCr. (b) Variation of V detection
limits with analyte concentration in the sample of TiVCr. (c) Variation of Cr detection limits with analyte concentration in the sample of TiVCr.
As shown in figure 2 (a) drawn for the TiVCr sample, the minimum detectable limit for Ti analysis is equal to the analyte concentration of 2,509 ppm to 34,78 ppm (about 14 times). As shown in Figure 2 (b), the minimum detectable limit value for V analytics is equal to the analyte concentration of 1,175 ppm to
18,48 ppm (about 16 times). As shown in Figure 2 (b), the minimum detection limit for Cr analysis is equal to the analyte concentration of 1,285 ppm to 19,13 ppm (about 15 times).
We have also taken into account the total errors contributed in detection limits measurement as well as in preparation of analyte concentration. Since the detection limit depends linearly on analyte concentration, the net error in these two parameters has been calculated partially. The total error contributed to detection limit measurement has been found to vary from 1-8%.
One of the biggest problems encountered in XRF analyzes is the matrix absorption enhancement effects. The intensity of the secondary X-ray given by the quantitative element is influenced by the other elements in the sample, either positively or negatively. As a result of this influence, the analyte intensity may be greater or less than predicted. For the K lines of consecutive element pairs from the periodic table atomic number 22 titanium to the atomic number 72 hafnium from the atomic order, absorption-enhancing effects occur at the middle level. In this study, if the atomic number of Ti is 22, the atomic number of 23 is V, and the atomic number of 24 is Cr, For the TiV mixture, Kα of the V excites the Ti. For the VCr mixture, Kα of the Cr excites the V. For the TiCr mixture, Kα of the Cr excites the Ti. For the TiVCr mixture, Kα of the V excites the Ti, Kα of the Cr excites Ti, Kα of the Cr excites V and Kα of the V excites Ti The contributions to the intensity of Ti from the primary beam excitation are directly enhancement by the Kα of V, direct enhancement by the Kα of Cr and the third element enhancement by the Kα of V. All of the angular spectrometers and devices that select the pulse height cannot distinguish these lines. For this reason, the Kα and Kβ lines of some elements are overlaid.
In conclusion, our study shows that the detection limit tends to be dependent on the analyte concentration. The results from this systematic study are given in order to get the best detection limit value under the experimental conditions that can help us on what should be required of the mass concentration of the analyte. The results obtained indicate that the optimum value of detection limit will correspond to analyte mass concentration 5-25 times of the best detection limit. It is clear from this that the limit of detection is dependent on the analyte mass concentration.
References
BERTIN, E. P. (1975), Principles and practice of X-ray spectrometric analysis, David Sarnoff
Research Center, 1079 p, New York and London. Conference in Kristiansand vom, Haan.
CURIE, L. (2000), Detection and quantification
capabilities and the evaluation of low-level data: some international perspectives and continuing challenges. Journal of
Radioanalytical and Nuclear Chemistry, 245(1), 145-156.
EKINCI, R., EKINCI, N., and SENEMTAŞI, E. (2013). Effect of analysis time on detection limit by energy dispersive X-ray fluorescence spectrometry, Asian Journal of Chemistry, vol. 25, No. 5, 2557-2560.
GONZALEZ-FERNANDEZ, O., MARGUI, E., and QUERALT, I. (2009). Multielemental analysis
of dried residue from metal-bearing waters by wavelength dispersive X-ray fluorescence spectrometry. Spectrochimica Acta Part B:
Atomic Spectroscopy, 64(2), 184-190.
KARJOU, J. (2007), Matrix effect on dedection limit and accuracy in total reflection X-rayflourescence analysis of trace elements in environmental and biological samples. Spectrochima Acta Part B, 62(2), 177–181. KLOCKENKAMPER., R. (1997), Total-Reflection
X-Ray Fluorescence Analysis, vol. 140, J. Wiley and Sons, Inc, New York, pp. 173-214. PITSCH, H. (2000), The preparation of samples of
solid substances for spectroscopic analysis, 11th Norwegian X-ray Conference in Kristians and vom, Haan.
PITSCH, H. (2000), The preparation of samples of solid substances for spectroscopic analysis, 11th Norwegian X-ray
ROUSSEAU, R. M. (2001), Detection limits and estimates of uncertainity of analytical XRF results, The Rigaku Journal, 18 (2), 33–47. SHALTOUT, A. A., and IBRAHIM, M. A. (2007),
Detection limit enhancement of Cd, Ni, Pb and Zn determined by flame atomic absorption spectroscopy. National Research Center, 52(5),276-286.
THOMPSON, M. (1998), Do we really need detection limits. The Analyst, 123, 405–407. TIWARI, M. K., SINGH, A. K., SAWHNEY, J.S.
(2005), Sample preparation for evaluation of X-ray flourescence spectrometry, Analytical Sciences, 21 (2), 143–147.
VAN GRIEKEN., R. E., A. MARKOWICZ. (1993), Handbook of X-ray spectrometry: Methods and Techniques, vol. 14, M. Dekker, Inc, New York, pp. 453-489.
.