Doğuş Üniversitesi Dergisi, 20 (2) 2019, 89-103
Asset Price Channel: Evidence from Turkey
Varlık Fiyatı Kanalı: Türkiye ÖrneğiGülden ŞENGÜN
(1), Akmyrat AMANOV
(2)ABSTRACT: The power and interaction process of the effects of decisions on monetary policy on economic indicators remains uncertain. The asset price channel explains dynamic interactions of monetary policy. In this study, the effectiveness of asset price channel in Turkey's economy for a sample period of 2003Q1-2017Q4 was examined. The ARDL modeling and bounds testing is used to show long-run relationships between variables. According to the findings; there is a long-run equilibrium relationship between the stock prices and the investment expenditures, while there is no long-run relationship between the stock prices and consumption expenditures. To conclude, stock prices have a predictable effect on the investment expenditures, and stock prices may be a good indicator of economic activities.
Keywords: Asset Price Channel, ARDL Model, Monetary Policy
Öz: Para politikası kararlarının ekonomik göstergeler üzerindeki etkilerinin gücü ve etkileşim süreci belirsizliğini korumaktadır. Varlık fiyatı kanalı para politikasının dinamik etkileşimini açıklamaya çalışmaktadır. Bu çalışmada, 2003Q1-2017Q4 örneklem döneminde Türkiye ekonomisinde varlık fiyatı kanalının etkinliği incelenmiştir. Değişkenler arasındaki uzun vadeli ilişkiyi incelemek amacıyla ARDL modeli ve sınır testi yaklaşımı kullanılmıştır. Bulgulara göre; hisse senedi fiyatları ile yatırım harcamaları arasında uzun vadeli bir ilişki bulunurken, hisse senedi fiyatları ile tüketim harcamaları arasında uzun vadeli bir ilişki bulunmamıştır. Sonuç olarak, hisse senedi fiyatları yatırım harcamaları üzerinde tahmin edilebilir bir etkiye sahiptir. Dolayısıyla, hisse senedi fiyatları ekonomik aktivitelerin iyi bir göstergesi olabilir.
Anahtar Kelimeler: Varlık Fiyatı Kanalı, ARDL Modeli, Para Politikası JEL Classifications: G12, C32, E52
1 Istanbul University, Department of Economics, Istanbul, Turkey, [email protected]
2 Istanbul University, Department of Economics, Istanbul, Turkey, [email protected]
90 Gülden ŞENGÜN, Akmyrat AMANOV
1. Introduction
The purpose of economics is to increase social welfare. This aim can be achieved by more efficient use of factors of production or by finding new resources in the long term. Social welfare is ensured by minimizing cyclical fluctuations in the short term. Central banks are targeting price stability and financial stability in order to minimize the cyclical fluctuations. Therefore, the aim of central banks is to try to eliminate the uncertainties of the power and interaction process of the effects of monetary policy decisions. Two approaches are important in the study of monetary actions: (1) a reduced form that explores the importance of money on economic activities, (2) a structural form that examines how monetary policy affects total demand. The monetary transmission mechanism explains how the policies of central bank affect the macroeconomic variables. When the monetary transmission mechanisms are known, the size and timing of the applied policy can be selected in a consistent manner with the specified target. Second, since the links within the monetary transmission mechanisms are obvious, it is likely to be more appropriate to use the indicators when a policy is applied.
Monetary transmission mechanisms are also divided into many parts. One of them is the asset price channel. The asset price channel explains the effects of changes in prices if assets on total demand. Knowing the impact of the stock prices on consumption and investment expenditures will enable policy makers to predict the course of the economy and, if possible, shape their policies accordingly.
Referring to studies conducted in Turkey, it was observed that the relationship between stock price and many macroeconomic variables such as real economic activity, nominal GDP, industrial production growth and economic growth is examined. However, in these studies, relationship between stock prices and consumption-investment expenditures was not examined separately. Examining the relationship separately is important because the multiplier effects of consumption and investment expenditures in the economy are different.
In this study, the effectiveness of asset price channel in Turkey's economy for a sample period of 2003Q1-2017Q4 was examined. Thus, the impacts of changes in the BIST100 index on consumption and investment expenditures was investigated. Firstly, the general information about the asset price channel was introduced to readers. Then some empirical studies related to asset price channel were mentioned. Finally, the ARDL Bounds Test is used to show long-run relationships and causality between variables. Long-term elasticity relationships between variables are revealed.
Asset Price Channel: Evidence from Turkey 91
2. Literature Review
The asset price channel shows the effects of changes in the relative prices of financial and real assets on total expenditure and production. It is based on the assumption that the financial market is perfect, as is the traditional interest channel. The asset price channel can be examined in two categories.
Wealth effect channel is the first asset prices channel (Ando and Modigliani, 1963; Modigliani and Brumberg, 1954). According to Franco Modigliani's the life-cycle hypothesis, the determinant of consumption expenditure is not the current income but the consumer's expected income to achieve throughout life. Life-long resources consist of; human capital, real capital and financial wealth. Stocks in financial wealth constitute a large part of their lifetime resources. For example, in an expansionary monetary policy implementation, there will be more money than the people would like to keep. The public will evaluate the excess by buying stocks. As the demand for stocks increases, stock prices will increase, in this case, people's wealth will increase. This, in turn will increase total demand and total output. We can illustrate the wealth effect channel as follows:
M ↑ → Pe ↑ → W ↑ → C ↑ → Y ↑ (1) Here M represents the money supply, Pe represents the stock prices, W represents the wealth of the people, C represents consumption expenditure and Y represents national income.
The second wealth effect channel is Tobin`s q channel (Tobin, 1970). As in the interest rate channel, the relationship between monetary policy and investment expenditures is established through money and bond markets. In this channel, the relationship between monetary policy and investments is explained through stock prices. Changes in stock prices affect the market value of firms and affect the investment decisions. For a better understanding of the channel, let us imagine that the central bank again applies an expansionary monetary policy. In this case, people will have more money than they would like to keep, and people will consider the surplus by buying stocks. This means that Tobin`s q (market value of firms/replacement cost of capital) will increase as the increase in stock demand will lead to a rise in stock prices as well. A higher q means that the replacement cost of capital (new plant and equipment acquisition) is lower than the market value of firm. Firms are able to purchase more new plant and equipment capital by issuing fewer stocks. Thus, investment expenditures and total output will increase. The Tobin`s q channel can be illustrated schematically as follows:
92 Gülden ŞENGÜN, Akmyrat AMANOV Here M represents the money supply, Pe represents the stock prices, q represents the market value of firms/replacement cost of capital, I represent investment expenditure and Y represents national income.
Many empirical studies have been carried out on the relation among asset prices, stock market performance and economic activity.We can categorize the work done so far into three categories: (1) the effects of asset prices/returns on final targets, (2) policy instruments and other variables that affect asset prices, and (3) the relationship between stock market performance and economic activity. Now, because it covers the scope of work, the focus will be on the effects of asset prices-returns on final targets. Empirical foreign studies are given in Table 1; local studies are given in Table 2.
Asset Price Channel: Evidence from Turkey 93
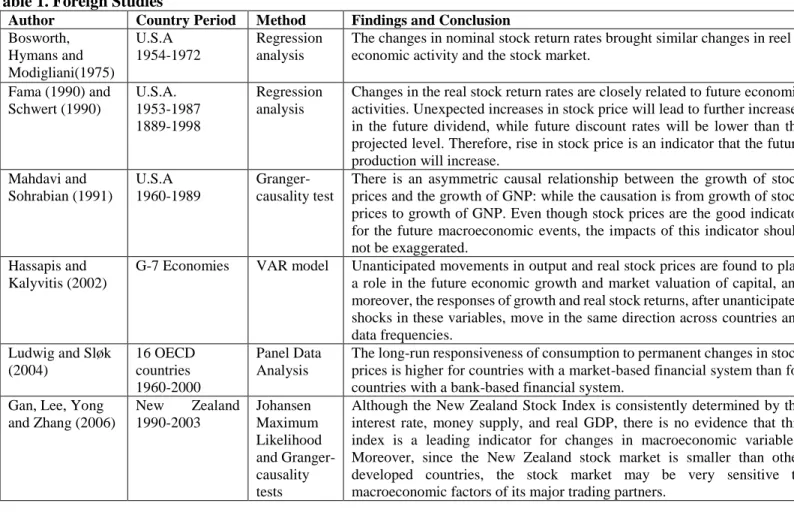
Table 1. Foreign Studies
Author Country Period Method Findings and Conclusion Bosworth, Hymans and Modigliani(1975) U.S.A 1954-1972 Regression analysis
The changes in nominal stock return rates brought similar changes in reel economic activity and the stock market.
Fama (1990) and Schwert (1990) U.S.A. 1953-1987 1889-1998 Regression analysis
Changes in the real stock return rates are closely related to future economic activities. Unexpected increases in stock price will lead to further increases in the future dividend, while future discount rates will be lower than the projected level. Therefore, rise in stock price is an indicator that the future production will increase.
Mahdavi and Sohrabian (1991) U.S.A 1960-1989 Granger-causality test
There is an asymmetric causal relationship between the growth of stock prices and the growth of GNP: while the causation is from growth of stock prices to growth of GNP. Even though stock prices are the good indicator for the future macroeconomic events, the impacts of this indicator should not be exaggerated.
Hassapis and Kalyvitis (2002)
G-7 Economies VAR model Unanticipated movements in output and real stock prices are found to play a role in the future economic growth and market valuation of capital, and moreover, the responses of growth and real stock returns, after unanticipated shocks in these variables, move in the same direction across countries and data frequencies. Ludwig and Sløk (2004) 16 OECD countries 1960-2000 Panel Data Analysis
The long-run responsiveness of consumption to permanent changes in stock prices is higher for countries with a market-based financial system than for countries with a bank-based financial system.
Gan, Lee, Yong and Zhang (2006) New Zealand 1990-2003 Johansen Maximum Likelihood and Granger-causality tests
Although the New Zealand Stock Index is consistently determined by the interest rate, money supply, and real GDP, there is no evidence that this index is a leading indicator for changes in macroeconomic variables. Moreover, since the New Zealand stock market is smaller than other developed countries, the stock market may be very sensitive to macroeconomic factors of its major trading partners.
94 Gülden ŞENGÜN, Akmyrat AMANOV Husain (2006) Pakistan 1959-2004 ECM model and Granger-causality test
Regarding the cause and effect relationship, the analysis indicates a one-way causation from the real sector to stock prices implying that the stock market in Pakistan is still not that developed to influence the real sector of the economy. Naceur and Ghazouani (2007) 11 MENA countries 1979-2003 Dynamic panel model
There is no significant relationship between banking and stock market development and growth. The reason for it must be linked to underdeveloped financial systems in MENA region.
Pilinkus (2010) Lithuania, Latvia and Estonia 2000-2008 Johansen Cointegratio n Analysis
It was found that there is a long-term mutual relationship between selected macroeconomic indicators and stock market index in all countries.
Wickremasinghe (2011) Sri Lanka 1985–2004 Cointegratio n Analysis
The findings show that there are both the short and long-run causal relationship between stock prices and macroeconomic variables.
Osamwonyi ve Evbayiro-Osagie (2012) Nigeria 1975–2005 VECM Model
The results indicate that macroeconomic variables influence stock market index in Nigeria. Aye, Gupta, Modise (2015) South Africa 1960-2011 TVP-VAR model
The findings show that the impact of a real stock price shocks on consumption is positive. However, there is a negative spillover from the stock market to consumption during the financial crisis.
Asset Price Channel: Evidence from Turkey 95
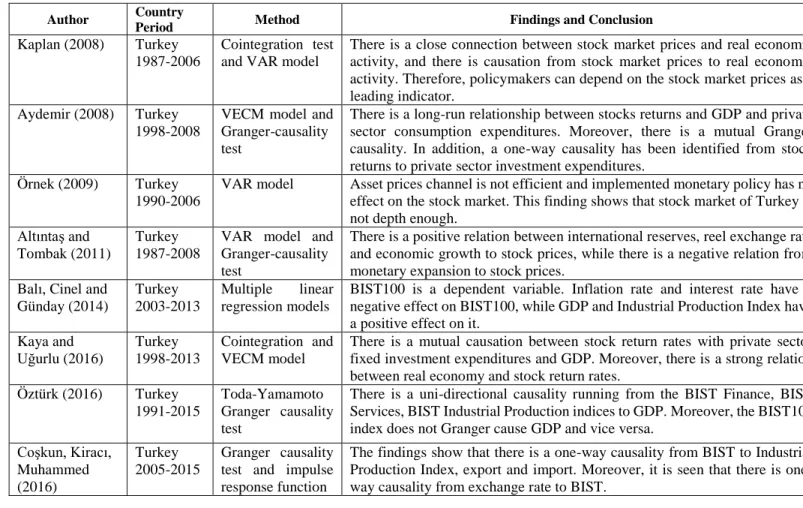
Table 2. Local Studies
Author Country
Period Method Findings and Conclusion
Kaplan (2008) Turkey 1987-2006
Cointegration test and VAR model
There is a close connection between stock market prices and real economic activity, and there is causation from stock market prices to real economic activity. Therefore, policymakers can depend on the stock market prices as a leading indicator.
Aydemir (2008) Turkey 1998-2008
VECM model and Granger-causality test
There is a long-run relationship between stocks returns and GDP and private sector consumption expenditures. Moreover, there is a mutual Granger causality. In addition, a one-way causality has been identified from stock returns to private sector investment expenditures.
Örnek (2009) Turkey 1990-2006
VAR model Asset prices channel is not efficient and implemented monetary policy has no effect on the stock market. This finding shows that stock market of Turkey is not depth enough.
Altıntaş and Tombak (2011)
Turkey 1987-2008
VAR model and Granger-causality test
There is a positive relation between international reserves, reel exchange rate and economic growth to stock prices, while there is a negative relation from monetary expansion to stock prices.
Balı, Cinel and Günday (2014)
Turkey 2003-2013
Multiple linear regression models
BIST100 is a dependent variable. Inflation rate and interest rate have a negative effect on BIST100, while GDP and Industrial Production Index have a positive effect on it.
Kaya and Uğurlu (2016) Turkey 1998-2013 Cointegration and VECM model
There is a mutual causation between stock return rates with private sector fixed investment expenditures and GDP. Moreover, there is a strong relation between real economy and stock return rates.
Öztürk (2016) Turkey 1991-2015
Toda-Yamamoto Granger causality test
There is a uni-directional causality running from the BIST Finance, BIST Services, BIST Industrial Production indices to GDP. Moreover, the BIST100 index does not Granger cause GDP and vice versa.
Coşkun, Kiracı, Muhammed (2016) Turkey 2005-2015 Granger causality test and impulse response function
The findings show that there is a one-way causality from BIST to Industrial Production Index, export and import. Moreover, it is seen that there is one-way causality from exchange rate to BIST.
96 Gülden ŞENGÜN, Akmyrat AMANOV When the empirical studies are examined, it is seen that the relationship between stock price and many macroeconomic variables such as real economic activity, nominal GDP, industrial production growth and economic growth is examined. The findings generally indicate that there is a significant relationship between stock prices and macroeconomic variables. However, in the studies, it was not observed that the relationship between stock prices and consumption-investment expenditures was examined separately. Considering that the multiplier effects of consumption and investment expenditures in the economy are different, a distinction between consumption and investment expenditures should be made. This will allow policymakers to obtain more accurate information and implement appropriate policies.
3. Data And Methodology
In this study, the effectiveness of asset price channel was questioned. Thus the causation and parameters among variables have been investigated. (BIST), (TUK), and (YAT) variables were used to set up the model. (BIST) represents the BIST-100 according to the closing price, (TUK) represents final consumption expenditure of resident households and consumption of non-profit institutions serving households, (YAT) represents gross fixed capital formation. The study covers periods of 2003Q1-2017Q4, and the frequency of time series is quarterly. The logarithm of the variables is taken to establish the relation of flexibility among variables. Moreover, there is a structural break which occurs over the period 2008Q1-2010Q3. A dummy variable was constructed, that takes the value one for these observations, and zero everywhere else. Moreover, descriptive statistics of variables is given in Table 3.
Table 3. Descriptive Statistics of Variables
BIST TUK YAT
Mean 55234.80 2.19E+08 99919933
Median 56038.00 1.85E+08 73476783
Maximum 115333.0 5.23E+08 2.68E+08
Minimum 9475.000 66177164 17948774
Standard Deviation 25084.94 1.16E+08 62405879
Observation Number 60 60 60
Source EVDS Data
Central
EVDS Data Central EVDS Data Central
According to Table 3, an average consumption expenditure of 2.19E+08 and an average investment expenditure of 99919933 was realized during the 2003Q1-2017Q4 period. While the highest consumption and investment expenditures were realized in 2017Q4, the minimum consumption and investment expenditures were realized in 2003Q1.On the other hand, the average value of BIST was 55234.80. The time series is taken from the Central Bank of the Republic of Turkey EVDS data central and each time series covers 60 observations.
Asset Price Channel: Evidence from Turkey 97
In order to find the appropriate model, it was first tested whether the variables contain a unit root. Since the economic model generally has higher autoregressive processes, the ADF unit root test is applied. When this test is applied, the appropriate number of lags included in the model is determined with the help of the Schwarz information criteria. The results are shown in Table 4.
Table 4. Unit Root with Break Test Results for Series
ADF
Level Level Prob. 1st Difference 1st Dif. Prob.
LNBİST -4.549 0.1957 -5.901* <0.01
LNTUK -5.245* 0.0397 -9.968* <0.01
LNYAT -1.586 0.99 -9.105* <0.01
MacKinnon (1996) one sided p-values.
* Significant at the 5 % level
According to the results of the unit root with break tests, LNTUK is stationary at normal level while LNBIST and LNYAT become stationary when the first difference of them are taken. ARDL modeling and bounds testing is suitable when the unit root results are inconclusive. Moreover, it is seen that all series are stationary at the 1st difference, and the hypothesis that the data are I(2) is clearly rejected.
4. Findings
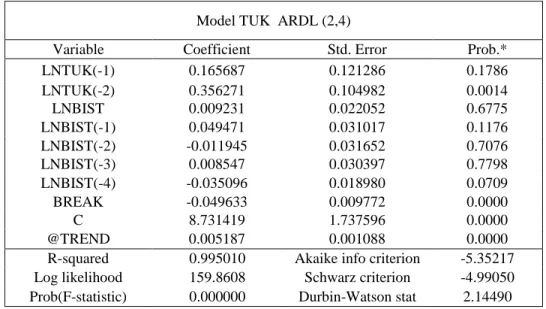
In order to see the effects of changes in the BIST100 index on consumption expenditures, the ARDL model was estimated which included the current and past values of the BIST100 index together with the previous values of consumption expenditures, and this model was called the Model TUK. Moreover, the ARDL model was estimated which included the current and past values of the BIST100 index together with the previous values of investment expenditures to see effects of changes in the BIST100 index on investment expenditures, and this model was called the Model YAT. In the specification and estimation of a ARDL model, the BREAK variable was included to take into account the structural breakdown that the global financial crisis has caused, as well as an intercept and trend as regressors. The appropriate number of lags included in the model is determined with the help of the Akaike and Schwarz information criteria. The estimations of Model TUK are given in Table 5, and estimations of Model YAT are shown in Table 6.
When the effects of changes in the BIST 100 index on consumption and investment expenditures were visually examined, it was found that there was a positive correlation between the variables.
98 Gülden ŞENGÜN, Akmyrat AMANOV
Table 5. Estimation of Model TUK
Table 6. Estimation of Model YAT
Model YAT ARDL (1,0)
Variable Coefficient Std. Error Prob.*
LNYAT(-1) 0.673504 0.042458 0.0000
LNBIST 0.095157 0.021052 0.0000
BREAK -0.091423 0.012836 0.0000
C 4.861663 0.668291 0.0000
@TREND 0.002347 0.000736 0.0024
R-squared 0.990671 Akaike info criterion -3.93509 Log likelihood 121.0854 Schwarz criterion -3.75903 Prob(F-statistic) 0.000000 Durbin-Watson stat 2.31807
It is necessary to test whether the actual functional form of the established models and neglected variable problem and/or unnecessary variable problem exist in the models. The accuracy of the specifications of the models was tested with the Ramsey Reset Test.
Model TUK ARDL (2,4)
Variable Coefficient Std. Error Prob.*
LNTUK(-1) 0.165687 0.121286 0.1786 LNTUK(-2) 0.356271 0.104982 0.0014 LNBIST 0.009231 0.022052 0.6775 LNBIST(-1) 0.049471 0.031017 0.1176 LNBIST(-2) -0.011945 0.031652 0.7076 LNBIST(-3) 0.008547 0.030397 0.7798 LNBIST(-4) -0.035096 0.018980 0.0709 BREAK -0.049633 0.009772 0.0000 C 8.731419 1.737596 0.0000 @TREND 0.005187 0.001088 0.0000
R-squared 0.995010 Akaike info criterion -5.35217 Log likelihood 159.8608 Schwarz criterion -4.99050 Prob(F-statistic) 0.000000 Durbin-Watson stat 2.14490
Asset Price Channel: Evidence from Turkey 99
Table 7. Ramsey Reset Test
Model TUK Model YAT
Value df Prob. Value df Prob.
t-statistic 1.631 45 0.109 t-statistic 1.2279 53 0.2249
F-statistic 2.662 (1.45) 0.109 F-statistic 1.5077 (1.53) 0.2249
* Significant at the 5 % level
The null hypothesis of the Ramsey Reset test suggests that the specification of the model is correct. According to the test results, the null hypothesis cannot be rejected, thus the specification of the model is correct.
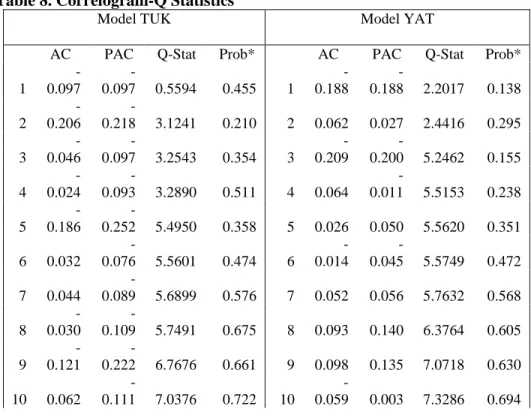
Another assumption in linear econometric equations is that there is no autocorrelation (relationship) between the error term values. It is important that the error terms in the model are serially independent, otherwise the parameter estimates will be inconsistent. For this reason, whether there is autocorrelation between error terms is examined according to the Correlogram-Q Statistics, and the results are given in Table 8.
Table 8. Correlogram-Q Statistics
Model TUK Model YAT
AC PAC Q-Stat Prob* AC PAC Q-Stat Prob*
1 -0.097 -0.097 0.5594 0.455 1 -0.188 -0.188 2.2017 0.138 2 -0.206 -0.218 3.1241 0.210 2 0.062 0.027 2.4416 0.295 3 -0.046 -0.097 3.2543 0.354 3 -0.209 -0.200 5.2462 0.155 4 -0.024 -0.093 3.2890 0.511 4 0.064 -0.011 5.5153 0.238 5 -0.186 -0.252 5.4950 0.358 5 0.026 0.050 5.5620 0.351 6 0.032 -0.076 5.5601 0.474 6 -0.014 -0.045 5.5749 0.472 7 0.044 -0.089 5.6899 0.576 7 0.052 0.056 5.7632 0.568 8 -0.030 -0.109 5.7491 0.675 8 0.093 0.140 6.3764 0.605 9 -0.121 -0.222 6.7676 0.661 9 0.098 0.135 7.0718 0.630 10 0.062 -0.111 7.0376 0.722 10 -0.059 0.003 7.3286 0.694
100 Gülden ŞENGÜN, Akmyrat AMANOV 11 0.067 -0.074 7.3661 0.769 11 -0.021 0.012 7.3614 0.769 12 0.032 -0.051 7.4410 0.827 12 0.045 0.085 7.5176 0.822
* Significant at the 5 % level
According to this statistics, the null hypothesis suggests that there is no evidence of autocorrelation in the residuals. The results of the statistics show that there is no autocorrelation.
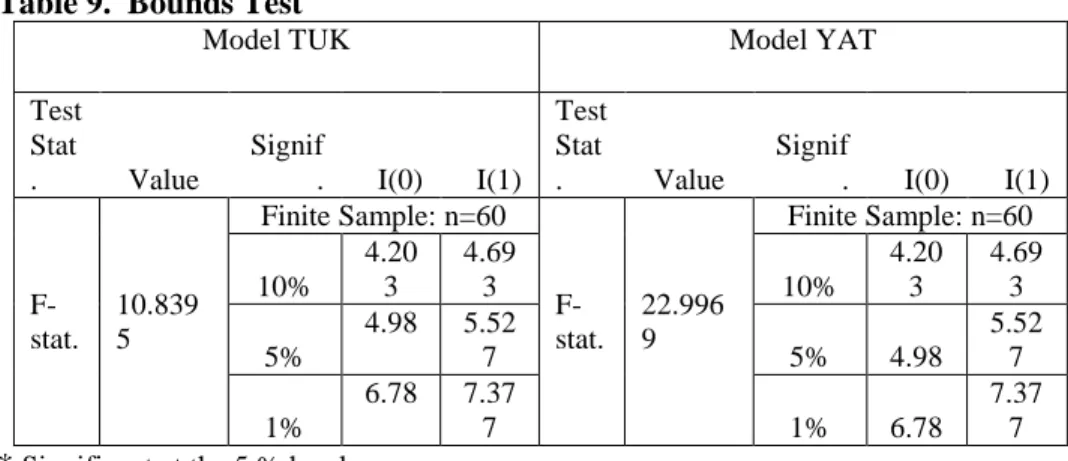
Once these tests have been applied, the examination of the long-term relationship can begin. One of the advantages of the ARDL model is that it allows the application of the Bounds Test. According to this test, the null hypothesis is that there is no long-term relationship between the variables. Bounds Test results are given in Table 9.
Table 9. Bounds Test
Model TUK Model YAT
Test Stat . Value Signif . I(0) I(1) Test Stat . Value Signif . I(0) I(1) F-stat. 10.839 5 Finite Sample: n=60 F-stat. 22.996 9 Finite Sample: n=60 10% 4.20 3 4.69 3 10% 4.20 3 4.69 3 5% 4.98 5.52 7 5% 4.98 5.52 7 1% 6.78 7.37 7 1% 6.78 7.37 7
* Significant at the 5 % level
It is seen that the F-statistic for the Bounds Test is 10.83 and 22.99, and these values clearly exceeds the 5% critical value for the upper bounds. Therefore, the hypothesis of no long-term relationship is strongly rejected. Another advantage of the ARDL model is that it allows estimating long-term coefficients. Long-term coefficients are shown in Table 10.
Table 10. Long Run Coefficients
Model TUK Model YAT
Variable Coef. S.Error Prob Variable Coef. S.Error Prob
LNBIST 0.042 0.026 0.112 LNBIST 0.291 0.0560 0.00
Asset Price Channel: Evidence from Turkey 101
LNYAT = 0.2914 LNBIST + 0.0072 Trend
According to the findings, while changes in asset prices affect investment spending, changes in asset prices have no effect on consumption expenditures. Rise of BIST index stimulates investment expenditures. A 10% increase in BIST leads to a 2.9% increase in YAT. Rise in BIST, increases market value of firms; therefore, raise in stock prices affect investment expenditures. Rise in BIST, does not affect consumption expenditures. All variables are both statistically and theoretically significant.
Table 11. Error-correction form
Model TUK Model YAT
BIST BIST
ECM Coefficients -0.478042* ECM Coefficients -0.326496*
Standard Error 0.082065 Standard Error 0.038600
* Significant at the 5 % level.
In the error-correction model, it is proved that shocks that can occur in the long-run equilibrium can be corrected. The coefficient in the error-correction was negative and statistically significant as expected. This coefficient indicates the rate at which the short-run deviations resulting from the non-stationary series is adjusted in the next period. In Model YAT, the short-run imbalance that occurs in BIST is adjusted approximately in nine months to the long-run equilibrium level.
5. Conclusion
In this study, the effectiveness of asset price channel in Turkey's economy was examined. The relationship among BIST100 index, consumption expenditures and investment expenditures in the Turkish economy for a sample period of 2003Q1-2017Q4 was investigated. The ARDL Bounds Test was applied as an appropriate econometric approach to carry out this study.
According to findings, first, there is a long-run equilibrium relationship between the stock prices and the investment expenditures, while there is no long-run relationship between the stock prices and consumption expenditures. A rise of BIST100 index stimulates investment expenditures, and a 10% increase in BIST100 leads to 2.9% increase in YAT. A rise in BIST100 increases the market value of firms; therefore, raise at stock prices affect investment expenditures. On the other hand, a rise in BIST100 does not affect consumption expenditures. It is considered that stocks may not constitute an important role in the consumers` lifetime resources in Turkey. Therefore, no significant relationship was found between stock prices and consumption. Second, there is a slow adjustment in the investment expenditures when the stock prices change. The short-run imbalance that occurs in BIST100 is adjusted approximately in nine months to the long-run equilibrium level.
102 Gülden ŞENGÜN, Akmyrat AMANOV According to these findings, stock prices may be a good indicator of economic activities. Stock prices have a predictable effect on the investment expenditures. Further studies should be done on questioning the determinants of stock prices.
6. References
Altıntaş, H. ve Tombak, F. (2011). Türkiye’de Hisse Senedi Fiyatları ve Makroekonomik Değişkenler Arasındaki İlişkinin Ekonometrik Analizi: 1987-2008, Anadolu Üniversitesi Ekonomi Kongresi II, 1-21.
Ando, A. and Modigliani, F. (1963). The ‘Life Cycle’ Hypothesis of Saving: Aggregate Implications And Tests, The American economic review, 53(1), 55-84.
Aydemir, O. (2008). Hisse Senedi Getirileri Ve Reel Sektör Arasındaki İlişki: Ampirik Bir Çalışma, Afyon Kocatepe University Journal of Economics and Administrative, 37(2), 37-55.
Aye, G. C., Gupta, R. and Modise, M. P. (2015). Do Stock Prices Impact Consumption and Interest Rate in South Africa? Evidence From A Time-Varying Vector Autoregressive Model, Journal of Emerging Market Finance, 14(2), 176-196. Balı, S., Cinel, M. O. ve Günday, A. H. (2014). Hisse Senedi Fiyatlarını Etkileyen Temel
Makroekonomik Faktörlerin Bist 100 Endeksi'ne Etkisinin Ölçümlenmesi, ODÜ Sosyal Bilimler Araştırmaları Dergisi, 4(9), 46-50.
Bosworth, B., Hymans, S. and Modigliani, F. (1975). The Stock Market and The Economy, Brookings Papers on Economic Activity, 1975(2), 257-300.
Coşkun, M., Kiracı, K. ve Muhammed, U. (2016). Seçilmiş Makroekonomik Değişkenlerle Hisse Senedi Fiyatları Arasındaki İlişki: Türkiye Üzerine Ampirik Bir İnceleme. Finans Politik & Ekonomik Yorumlar, 53(616), 61-74.
Fama, E. F. (1990). Stock Returns, Expected Returns, and Real Activity. The Journal of Finance, 45(4), 1089-1108.
Gan, C., Lee, M., Yong, H. H. A. and Zhang, J. (2006). Macroeconomic Variables and Stock Market Interactions: New Zealand Evidence. Investment Management and Financial Innovations, 3(4), 89-101.
Hassapis, C. and Kalyvitis, S. (2002). Investigating The Links Between Growth and Real Stock Price Changes With Empirical Evidence From The G-7 Economies. The Quarterly Review of Economics and Finance, 42(3), 543-575.
Husain, F. (2006). Stock Prices, Real Sector and The Causal Analysis: The Case of Pakistan, Journal of Management and Social Sciences, 2(2), 179-185.
Kaplan, M. (2008). The Impact of Stock Market on Real Economic Activity: Evidence From Turkey. Journal of Applied Sciences, 8(2), 374-378.
Kaya, E. ve Uğurlu, S. (2016). Seçili Bazı Makroekonomik Değişkenler ve Hisse Senedi Piyasası Arasındaki Dinamik Etkileşim: Bist 100 için Ekonometrik Bir Yaklaşım, Pamukkale University Journal of Social Sciences Institute/Pamukkale Üniversitesi Sosyal Bilimler Enstitüsü Dergisi, (23), 1-13.
Ludwig, A. and Sløk, T. (2004). The Relationship Between Stock Prices, House Prices and Consumption in OECD Countries. Topics in Macroeconomics, 4(1).
Asset Price Channel: Evidence from Turkey 103
Mahdavi, S. and Sohrabian, A. (1991). The Link Between The Rate of Growth of Stock Prices And The Rate of Growth of GNP in The United States: A Granger Causality Test. The American Economist, 35(2), 41-48.
Modigliani, F. and Brumberg, R. (1954). Utility Analysis and The Consumption Function: An Interpretation of Cross-Section Data, The MIT Press, 1, 388-436.
Naceur, S. B. and Ghazouani, S. (2007). Stock Markets, Banks, and Economic Growth: Empirical Evidence From The MENA. Region, Research in International Business and Finance, 21(2), 297-315.
Osamwonyi, I. O. and Evbayiro-Osagie, E. I. (2012). The Relationship Between Macroeconomic Variables and Stock Market Index in Nigeria, Journal of Economics, 3(1), 55-63.
Örnek, İ. (2009). Türkiye’de Parasal Aktarım Mekanizması Kanallarının İşleyişi. Maliye Dergisi, 156(1), 104-125.
Öztürk, F. (2016). Türkiye’de Hisse Senedi Fiyatları ve GSYİH Arasındaki İlişkinin Analizi, Uluslararası Yönetim İktisat ve İşletme Dergisi, 30, 86-94.
Pilinkus, D. (2010). Macroeconomic Indicators and Their Impact On Stock Market Performance in the Short And Long Run: The Case of The Baltic States, Technological and Economic Development of Economy, 16(2), 291-304.
Schwert, G. W. (1990). Stock Returns and Real Activity: A Century of Evidence, The Journal of Finance, 45(4), 1237-1257.
Tobin, J. (1970). Money and Income: Post Hoc Ergo Propter Hoc?, The Quarterly Journal of Economics, 84(2), 301-317.
Wickremasinghe, G. (2011). The Sri Lankan Stock Market and The Macroeconomy: An Empirical Investigation, Studies in Economics and Finance, 28(3), 179-195.