ISSN: 1680-5593 © Medwell Journals, 2010
Effect of Autumn and Spring Sowing Dates on Hay Yield and
Quality of Oat (Avena sativa L.) Genotypes
Nevzat Aydin, Zeki Mut, Hanife Mut and Ilknur Ayan
1 2 2 3
Karamanoglu Mehmetbey University, Vocational School, Karaman 70200, Turkey 1
Department of Field Crops, Faculty of Agriculture, 2
University of Bozok, Yozgat 66100, Turkey 3
Department of Field Crops, Faculty of Agriculture, Ondokuz University of Mayis, Samsun 55130, Turkey
Abstract: The objective of this study was to investigate the effects of sowing dates on hay yield and quality of
oat genotypes. Sixteen oat genotypes were grown over the consecutive four growing seasons in Samsun, North of Turkey. Hay yield and quality were significantly different between genotypes and sowing dates. Hay yield, Crude Protein (CP), Acid Detergent Fibre (ADF), Neutral Detergent Fibre (NDF), Total Digestible Nutrients (TDN), Relative Feed Value (RFV), Ca, K, P and Mg contents of hay were determined. Hay yield of the oat genotypes in the autumn sowing was higher than in the spring sowing while hay quality (CP, ADF, NDF, TDN, RFV and some elements) in the autumn sowing was lower than in the spring sowing. The hay yield of late-maturing and tall genotypes like Yesilkoy-330, Yesilkoy-1779, Faikbey and Seydisehir (12.1, 12.2, 12.4 and 12.9 t haG , respectively) were higher compared with the other genotypes in sowed in autumn. But quality of1
these genotypes in autumn sowing was lower than the other genotypes. In spring sowing, genotypes Samsun and Kupa had the highest hay yield and fairly high quality. Ca, K and P contents of hay were adequate for ruminants in both sowing dates but Mg content was not adequate. This study showed that sowing date had great effect on hay yield and quality potential of oat genotypes.
Key words: Oat, genotypes, hay yield, ADF, NDF, quality, Turkey
INTRODUCTION Turkey. Several studies have evaluated grain oat In Turkey, the capacity of natural grassland was
lower as well as other forage crops production that are an important feed source was undeveloped and therefore, remains inadequate for present livestock. As alternative feed source, uses of small grain cereals forage could be partly solved for scarcity of available forage (Çelik and Bulur, 1996). Small grain cereal forages are greatly adjusted highly multi-purpose forages used for pasture, green chop, silage and hay (Fohner, 2002). Cereal forages are a major crop both in Turkey and in many parts of world and their importance is increasing because of their significant economic and environmental benefits (Braunwart et al., 2001). Oat (Avena sativa L.) is used extensively as feed for livestock because of its high-quality as well as its high-forage yield (Moreira, 1989; Zhang et al., 1998). Oat varieties are sown either in the fall or in the spring in Turkey. Oat can be grown either at coastal regions in spring as well as in fall or inland regions of Turkey in spring due to frost damage. Oat genotypes can be generally grown for both grain and forage in
genotypes for forage yield. Riveland et al. (1977) evaluated 12 genotypes and found that medium to late-maturing genotypes produced the greatest forage yield.
Anderson and Kaufmann (1963) evaluated 25 genotypes in Canada and concluded that breeding for forage yield was unnecessary because late-maturing genotypes were suitable for both seed and forage production. Kaufmann (1961) and Stuthman and Marten (1972) also reported that late-maturing genotypes had high forage yield but Stuthman and Marten (1972) found no relationship between forage yield and grain yield. Folkins and Kaufmann (1974) found that five oat genotypes ranked the same for forage and grain yield in 1 year but not in 2 other years. If a grain oat is to be used as a forage oat in dairy regions, it is important that the oat also have good forage quality (Cherney and Marten, 1982). Some researchers argued that the value of high quality forage for improving body weight gain on ruminant animals (Waldo and Jorgensen, 1981; Linn and Martin, 1989). Juskiw et al. (2000) stated that quality
forage must have high intake, digestibility and efficiency were shown in Table 1. The genotypes were shown of utilization. Plant cell walls, containing a digestible and in a completely randomized block design with three an indigestible fraction are an important element fixing replications. Names and origin of genotypes is used in the forage quality. ADF (acid detergent fiber) and NDF study were shown in Table 2. Each genotype was sown in (neutral detergent fiber) are good indicators of fiber 7.2 m (1.2 by 6.0 m) plots consisting of 6 row with contents in forages. While Acid Detergent Fiber (ADF) 20 cm row spacing at the beginning of November for the content is a measure of the indigestible fraction, Neutral autumn sowing and at the beginning of March for the Detergent Fiber (NDF) content is a measure of the total spring sowing in all years. Plots were fertilized with 60 kg
cell wall fraction. N and 60 kg P haG at sowing. Harvest dates were shown
Oat genotypes that are low in NDF and ADF should in Table 2. Maturity at harvest was determined using have good forage quality because low NDF is associated Zadoks’s scale (Zadok et al., 1974). Harvest was done at with high forage intake and low ADF is associated with late milk dough (Zadok scale 77).
high digestibility. Protein content is an important feed A sub-sample (800-1000 g) was randomly selected factor per se, with high quality feed having high protein from each harvested plot to estimate hay yield and content. The chemical composition and nutritive value of provide samples for forage quality analysis. The samples green plant material can give useful information about the were weighed and dried for 72 h by forced-air drying oven forage quality (Kjos, 1990). About 12 oat genotypes at 65°C. The dried samples were reassembled and ground evaluated by Riveland et al. (1977) were similar in forage to pass through a 1 mm screen. Crude protein, Acid quality and nutritionally competitive with good-quality Detergent Fibre (ADF), Neutral Ddetergent Fibre (NDF) cool-season grass hay. Additionally, Stuthman and and Ca, K, Mg and P contents of samples were determined Marten (1972) found minimal variation for forage quality using Near Infrared Reflectance Spectroscopy (NIRS) among 11 oat genotypes. (Hoy et al., 2002; Poblaciones et al., 2008). NIRS was
The differences regarding hay yield and quality of calibrated using software program coded IC-0904 FE. different oat genotypes sown in autumn and spring were Total Digestible Nutrients (TDN), Dry Matter Intake investigated in this study. (DMI), digestible Dry Matter (DDM) and Relative Feed
MATERIALS AND METHODS equations adapted from: A field experiment was conducted for 4 years during
the 2003-2007 growing seasons at the Experiment Farm of Ondokuz Mayis University in Samsun, Turkey. The altitude of experimental area was 195 m (41°21'N, 36°15'E). The experiment was established in a clay soil with pH 7.10, organic matter content 3.01%, available P content 25.40 ppm and K 305 ppm (0-30 cm depth). Climatic data during the four growing seasons of the experimentation
2
1
Value (RFV) were estimated according to the following
TDN = (-1.291 × ADF) + 101.35 DMI = 120/NDF% dry matter basis
DDM = 88.9-(0.779 × ADF% dry matter basis) RFV = DDM% × DMI% × 0.775
Data were analyzed with Analysis of Variance (ANOVA) procedures using the MSTAT-C statistical software. The mean separation among treatment means
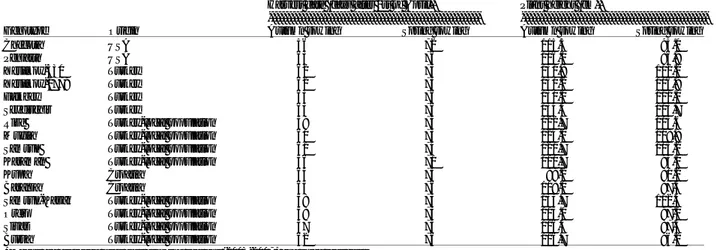
Table 1: Monthly total rainfall and mean air temperature during the four growing seasons of experimentation at Samsun, Turkey
Total monthly rainfall (mm) Mean monthly temperature (°C)
---
---Months 2003-2004 2004-2005 2005-2006 2006-2007 30-year average 2003-2004 2004-2005 2005-2006 2006-2007 30-year average
Autumn November 64.0 174.2 74.2 65.8 83.0 11.5 12.2 12.3 11.5 11.9 December 104.0 84.4 40.4 71.4 73.2 9.3 8.9 10.0 7.2 9.0 January 84.2 62.8 121.3 24.5 60.7 8.1 9.0 4.7 9.6 7.1 February 43.9 43.1 98.7 43.8 50.7 7.5 7.5 6.0 7.5 6.6 March 66.2 141.6 94.6 68.1 56.8 8.5 7.2 9.7 8.6 7.8 April 101.0 87.8 33.7 25.9 58.6 11.4 11.4 11.0 9.9 11.2 May 56.2 34.7 69.0 67.0 49.3 15.0 15.8 14.6 17.2 15.3 Sum 519.5 628.6 531.9 366.5 432.3 10.2 10.3 9.8 10.2 9.8 Spring February 43.9 43.1 98.7 43.8 50.7 7.5 7.5 6.0 7.5 6.6 March 66.2 141.6 94.6 68.1 56.8 8.5 7.2 9.7 8.6 7.8 April 101.0 87.8 33.7 25.9 58.6 11.4 11.4 11.0 9.9 11.2 May 56.2 34.7 69.0 67.0 49.3 15.0 15.8 14.6 17.2 15.3 June 77.6 51.1 36.3 38.0 48.6 20.0 20.2 21.3 23.0 20.0 Sum 344.9 358.3 332.3 242.8 264.0 12.5 12.4 12.5 13.2 12.2
Table 2: Origin, harvest date and plant height of investigated oat genotypes
Harvest date (days after 1st of April)* Plant height (cm)*
---
---Genotype Origin Autumn sowing Spring sowing Autumn sowing Spring sowing
Checota USA 56 72 115.3 95.0 Peniarth USA 63 76 106.0 86.9 Yesilkoy-330 Turkey 62 75 131.8 112.2 Yesilkoy-1779 Turkey 62 75 130.2 106.9 Faikbey Turkey 63 76 130.0 111.0 Seydisehir Turkey 63 76 134.5 113.7
Rize Turkey-local population 59 74 122.7 103.6
Mugla Turkey-local population 60 73 124.0 108.8
Samsun Turkey-local population 61 74 121.7 105.2
Karaman Turkey-local population 56 71 110.7 95.0
Kupa Croatia 64 75 99.2 80.2
Baranja Croatia 65 76 118.0 97.5
Samsun-Kavak Turkey-local population 58 73 133.7 112.4
Ordu Turkey-local population 58 73 113.0 97.0
Sivas Turkey-local population 57 73 116.4 87.5
Bursa Turkey-local population 62 76 116.7 96.2
*Means are averaged over four growing seasons (2003-2007) and three replicates
for years, sowing date and variety was obtained by using precipitation and other factors. Similar findings were the Least Significant Difference (LSD) test (Steel and indicated by Maloney et al. (1999).
Torrie, 1980). The hay yield of genotypes Yesilkoy-330,
RESULTS AND DISCUSSION 12.9 t haG , respectively) were higher compared with the
Precipitations and temperatures for the years under and Karaman had the lowest hay yield (5.21 and study are shown in Table 1. Cumulative precipitation both 5.87 t haG , respectively) (Table 5). The highest hay yield in autumn and in spring of 1st, 2nd and 3rd growing in spring sowing was obtained from Samsun and Kupa seasons was more than the normal yearly average. genotypes (8.25 and 7.77 t haG , respectively). This study However, cumulative precipitation in autumn and spring in the autumn sowing, hay yield of genotypes which had of fourth growing season was less than the normal yearly tall and late-maturing were generally higher than the other average. Mean temperatures over 30 years were similar for genotypes (Table 1, 3). Chapko et al. (1991) showed that the four growing season years (Table 1). tall, late-maturing genotypes were associated with high
Variance analysis of the 4 years data showed that forage yield.
significant effect of genotype, sowing date, year and their Similar results were reported by other investigators interaction on hay yield and hay quality. As shown in (Anderson and Kaufmann, 1963; Stuthman and Marten, Table 3-5 hay yield for both sowing dates in the growing 1972). On the contrary, there is no such a relationship in seasons 2003-04 (first year) and 2004-05 (second year) the spring sowing. Maturity differences among the was higher than 2005-06 (third year) and 2006-07 (fourth genotypes were much greater in autumn sowing than in year). This may result from the fact that the rainfall spring sowing. These results agree with those of Smith between March and May was much higher in the first and (1974) and found that a change from warm to cool second year compared with the third and fourth year temperature delayed panicle emergence in oat while a
(Table 1). change from cool to warm decreased time to reach this
Hay yield: Maturity period for hay among genotypes in
the autumn sowing was shorter than that of the spring Hay quality: Significant differences were found amongst
sowing. Maturity period of Checota and Karaman were years, the genotypes and sowing dates regarding earlier than that of the others both in the autumn and in crude protein, ADF, NDF, TDN, RFV and mineral the spring sowing (Table 2). Plant height of genotypes in contents of hay. Crude protein content of forage is one of autumn sowing had taller than in spring sowing. Hay yield the most important criteria for forage quality evaluation of the genotypes in the autumn sowing was higher than (Caballero et al., 1995; Assefa and Ledin, 2001). The in the spring sowing. highest CP content was obtained in autumn sowing in the Comparison of hay yields by the sowing time third year and in the spring sowing in the second indicated a clear advantage of autumn sowing. Based on and third years (Table 4). CP concentrations for all oat 4 years data autumn sowed oat resulted in 56.4% higher genotypes were higher in spring sowing than in hay yield than the spring sowed crop (Table 3). This autumn sowing (104.0, 92.0 g kgG DM, respectively) result could be due primarily to air temperature, (Table 3). Among genotypes, CP concentrations were Yesilkoy-1779, Faikbey and Seydisehir (12.1, 12.2, 12.4 and
1
other genotypes in sowed in autumn. Genotypes Sivas
1
1
maturity stage.
Table 3: Effects of sowing date on the parameters investigated in the study as 4 year average
Sowing HY CP ADF NDF TDN RFV Ca K P Mg
date (t haG )1 (g kgG )1 (g kgG )1 (g kgG )1 (g kgG )1 (%) (g kgG )1 (g kgG )1 (g kg )-1 (g kgG )1
Autumn 9.87a 92.0b 384.7a 614.6a 516.8b 89.7b 4.69 17.77 3.20b 1.17a
Spring 6.31b 104.0a 374.4b 597.7b 530.1a 93.5a 4.73 17.46 3.37a 1.11b
HY: Hay yield, CP: Crude protein, NDF: Neutral detergent fibers, ADF: Acid detergent fibers, TDN: Total digestible nutrients, RFV: Relative feed value, Ca: Calcium, K: Potassium, P: Phosphor, MG: Magnesium. Means within a column followed by the same lowercase letter are not significantly different (p<0.01)
Table 4: Effects of sowing date on the parameters investigated in the study as 4 year average
Sowing HY CP ADF NDF TDN RFV Ca K P Mg
date Years (t haG )1 (g kgG )1 (g kgG )1 (g kgG )1 (g kgG )1 (%) (g kgG )1 (g kgG )1 (g kgG )1 (g kgG )1
Autumn 1 10.30ab 89.4bc 385.5b 600.9b 515.8a 91.6ab 4.53b 17.16b 3.17b 1.24b 2 10.70a 92.1b 378.5b 605.2b 524.8a 91.8a 4.82a 17.31b 3.31a 1.38a 3 9.65b 99.2a 380.3b 623.1a 522.5a 89.1b 4.63ab 18.96a 3.14b 1.07c 4 8.80c 87.3c 394.5a 629.2a 504.2b 86.5c 4.81a 17.66b 3.19b 1.02c Spring 1 6.77a 101.8b 387.4a 610.7a 513.4c 90.1b 4.21c 18.28a 3.28b 1.08 2 6.60ab 105.7a 358.1c 563.3b 551.2a 101.3a 4.43c 16.11c 3.41a 1.11 3 6.24b 108.1a 365.8b 608.4a 541.3b 92.7b 5.57a 18.02a 3.41a 1.13 4 5.64c 100.5b 386.3a 608.3a 514.8c 90.0b 4.74b 17.47b 3.37a 1.11
HY: Hay yield, CP: Crude protein, NDF: Neutral detergent fibers, ADF: Acid detergent fibers, TDN: Total digestible nutrients, RFV: Relative feed value, Ca: Calcium, K: Potassium, P: Phosphor, MG: Magnesium. Means within a column followed by the same lowercase letter are not significantly different (p<0.01)
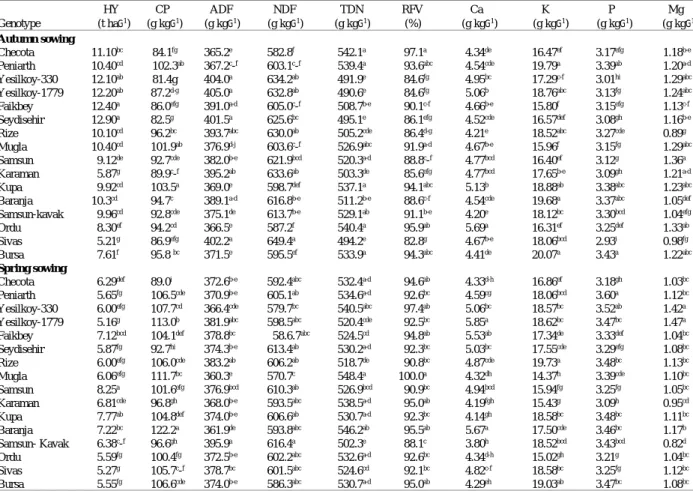
Table 5: Hay yield (HY), some quality characters and mineral concentration of oat genotypes in the autumn and spring sowing
HY CP ADF NDF TDN RFV Ca K P Mg
Genotype (t haG )1 (g kgG )1 (g kgG )1 (g kgG )1 (g kgG )1 (%) (g kgG )1 (g kgG )1 (g kgG )1 (g kgG )1
Autumn sowing
Checota 11.10bc 84.1fg 365.2e 582.8f 542.1a 97.1a 4.34de 16.47ef 3.17efg 1.18b-e
Peniarth 10.40cd 102.3ab 367.2 -c f 603.1 -c f 539.4a 93.6abc 4.54cde 19.79a 3.39ab 1.20a-d
Yesilkoy-330 12.10ab 81.4g 404.0a 634.2ab 491.9e 84.6fg 4.95bc 17.29c-f 3.01hi 1.29abc
Yesilkoy-1779 12.20ab 87.2d-g 405.0a 632.8ab 490.6e 84.6fg 5.06b 18.76abc 3.13fg 1.24abc
Faikbey 12.40a 86.0efg 391.0a-d 605.0 -c f 508.7b-e 90.1c-f 4.66b-e 15.80f 3.15efg 1.13c-f
Seydisehir 12.90a 82.5g 401.5a 625.6bc 495.1e 86.1efg 4.52cde 16.57def 3.08gh 1.16b-e
Rize 10.10cd 96.2bc 393.7abc 630.0ab 505.2cde 86.4d-g 4.21e 18.52abc 3.27cde 0.89g
Mugla 10.40cd 101.9ab 376.9d-j 603.6 -c f 526.9abc 91.9a-d 4.67b-e 15.96f 3.15fg 1.29abc
Samsun 9.12de 92.7cde 382.0b-e 621.9bcd 520.3a-d 88.8 -c f 4.77bcd 16.40ef 3.12g 1.36a
Karaman 5.87g 89.9 -c f 395.2ab 633.6ab 503.3de 85.6efg 4.77bcd 17.65b-e 3.09gh 1.21a-d
Kupa 9.92cd 103.5a 369.0e 598.7def 537.1a 94.1abc 5.13b 18.88ab 3.38abc 1.23abc
Baranja 10.3cd 94.7c 389.1a-d 616.8b-e 511.2b-e 88.6c-f 4.54cde 19.68a 3.37abc 1.05def
Samsun-kavak 9.96cd 92.8cde 375.1de 613.7b-e 529.1ab 91.1b-e 4.20e 18.12bc 3.30bcd 1.04efg
Ordu 8.30ef 94.2cd 366.5e 587.2f 540.4a 95.9ab 5.69a 16.31ef 3.25def 1.33ab
Sivas 5.21g 86.9efg 402.2a 649.4a 494.2e 82.8g 4.67b-e 18.06bcd 2.93i 0.98fg
Bursa 7.61f 95.8 bc 371.5e 595.5ef 533.9a 94.3abc 4.41de 20.07a 3.43a 1.22abc
Spring sowing
Checota 6.29def 89.0i 372.6b-e 592.4abc 532.4a-d 94.6ab 4.33d-h 16.86ef 3.18gh 1.03bc
Peniarth 5.65fg 106.5cde 370.9b-e 605.1ab 534.6a-d 92.6bc 4.59cg 18.06bcd 3.60a 1.12bc
Yesilkoy-330 6.00efg 107.7cd 366.4cde 579.7bc 540.5abc 97.4ab 5.06bc 18.57bc 3.52ab 1.42a
Yesilkoy-1779 5.16g 113.0b 381.9abc 598.5abc 520.4cde 92.5bc 5.85a 18.62bc 3.47bc 1.47a
Faikbey 7.12bcd 104.1def 378.8bc 58.6.7abc 524.5cd 94.8ab 5.53ab 17.34de 3.33def 1.04bc
Seydisehir 5.87fg 92.7hi 374.3b-e 613.4ab 530.2a-d 92.3bc 5.03bc 17.55cde 3.29efg 1.08bc
Rize 6.00efg 106.0cde 383.2ab 606.2ab 518.7de 90.8bc 4.87cde 19.73a 3.48bc 1.13bc
Mugla 6.06efg 111.7bc 360.3e 570.7c 548.4a 100.0 a 4.32dh 14.37h 3.39cde 1.10bc
Samsun 8.25a 101.6efg 376.9bcd 610.3ab 526.9bcd 90.9bc 4.94bcd 15.94fg 3.25fg 1.05bc
Karaman 6.81cde 96.8gh 368.0b-e 593.5abc 538.5a-d 95.0ab 4.19fgh 15.43g 3.09h 0.95cd
Kupa 7.77ab 104.8def 374.0b-e 606.6ab 530.7a-d 92.3bc 4.14gh 18.58bc 3.48bc 1.11bc
Baranja 7.22bc 122.2a 361.9de 593.8abc 546.2ab 95.5ab 5.67a 17.50cde 3.46bc 1.17b
Samsun- Kavak 6.38 -c f 96.6gh 395.9a 616.4a 502.3e 88.1c 3.80h 18.52bcd 3.43bcd 0.82d
Ordu 5.59fg 100.4fg 372.5b-e 602.2abc 532.6a-d 92.6bc 4.34d-h 15.02gh 3.21g 1.04bc
Sivas 5.27g 105.7 -c f 378.7bc 601.5abc 524.6cd 92.1bc 4.82c-f 18.58bc 3.25fg 1.12bc
Bursa 5.55fg 106.6cde 374.0b-e 586.3abc 530.7a-d 95.0ab 4.29eh 19.03ab 3.47bc 1.08bc
CP: Crude protein, NDF: Neutral detergent fibers, ADF: Acid detergent fibers, TDN: Total digestible nutrints, RFV: Relative feed value, Ca: Calcium, K: Potassium, P: Phosphor, MG: Magnesium. Means within a column followed by the same lowercase letter are not significantly different (p<0.01), Means are averaged over four growing seasons (2003-2007) and three replicates
greater in Kupa, Peniart, Mugla than in the other Baranja had greater CP concentration than the other genotypes in autumn sowing. But, in spring sowing, genotypes (Table 5). Some researchers pointed out that
crude protein content of hay changed among oat DDM and Dry Matter Intake (DMI). Forages with an RFV genotypes significantly (Ericson et al., 1977; Kim et al.,
2006). Same researchers also showed that CP content of late-maturing oat varieties was higher than the early-maturating varieties. The results were consistent with the findings of Ericson et al. (1977) and Kim et al. (2006).
Other important quality characteristics for forages are the concentrations of ADF and NDF (Caballero et al., 1995; Assefa and Ledin, 2001). In this experiment, the values for ADF and NDF in spring sowing were lower than those in autumn sowing (Table 3). The values for ADF in the fourth year were greater than those in the first, second and third in autumn sowing. In spring sowing, however, these values in the first and fourth years were greater than those in the second and third (Table 4). The NDF values were in autumn sowing greater in the third and fourth years compared with the first and second year in spring sowing the NDF values were in the first, third and fourth years greater than second year (Table 4). The ADF and NDF values significantly differed with oat genotypes. Checota, Peniarth, Mugla, Kupa, Samsun-Kavak, Ordu and Bursa had lower the ADF and NDF values than those of the other genotypes in autumn sowing (Table 5). In spring sowing, much smaller differences were observed regarding the ADF and NDF values among genotypes and Mugla showed the lowest the ADF and NDF values (360.3 and 570.7 g kg G DM,1
respectively) (Table 5).
The TDN refers to the nutrients that are available for livestock and are related to the ADF concentration of the forage. As ADF increases there is a decline in TDN which means that animals are not able to utilize the nutrients that are present in the forage. TDN value was higher in spring sowing than in autumn sowing (530.1 and 516.8 g kgG DM, respectively) (Table 3). The values for1
TDN in the 4th year were lower than those in the 1st, 2nd and 3rd in autumn sowing.
In spring sowing, however, these values in the first, third and fourth years were lower than those in the second. Genotypes Checota, Peniarth, Mugla, Kupa, Ordu and Bursa had the highest values for TDN during both season (Table 5). Additionally to these genotypes, the highest TDN values was obtained from the genotypes Samsun and Samsun-Kavak in autumn sowing and from the genotypes Yesilkoy-330, Seydisehir, Karaman and Baranja in spring sowing. Kim et al. (2006) showed that TDN value has significant differences among oat varieties (Table 5).
The RFV is an index that is used to predict the intake and energy value of the forages and it is derived from the
value over 151, between 150-125, 124-103, 102-87, 86-75, and fewer than 75 are considered as prime, premium, good, fair, poor and reject, respectively. In the present experiment, the RFV value was higher in the spring sowing than in the autumn sowing. Genotypes Checota, Mugla and Bursa were higher in RFV value than the other oat genotypes in both autumn and spring sowing (Table 5). Since RFV value was calculated from ADF and NDF, the observed differences were reflective of previously described ADF and NDF differences. Thus, a more comprehensive assessment on forage quality should be done for the different oat varieties in the different regions and at different seasons. This conclusion is consistent with the findings of Kim et al. (2006) who studied yield and quality of oat varieties.
There were significant differences amongst genotypes and years regarding their mineral content. Differences in Ca contents were not significant between sowing dates. Ca contents of the genotypes varied from 4.20 (Samsun-Kavak) to 5.69 (Ordu) g kgG DM in the1
autumn sowing, while Ca contents of the genotypes varied from 3.80 (Samsun-Kavak) to 5.85 g kgG DM in the1
spring sowing (Table 5). Tajeda et al. (1985) reported that forage crops should contain at least 3.0 g kgG of Ca for1
ruminants. The American National Research Council (NRC, 1984) recommended that forage crops should contain 3.1 g kgG Ca concentration for beef cattle.1
Results obtained for Ca concentration in this study were more than these recommended values. In the autumn sowing, K contents of the genotypes varied from 15.80 (Faikbey) to 20.07 (Bursa) g kgG DM while K contents of1
the genotypes changed between 14.37 (Mugla) and 19.73 (Rize) g kgG DM in the spring sowing (Table 5).1
Differences in K contents of sowing date were not significant. This conclusion is consistent with the findings of Mut et al. (2006) who studied yield and quality of triticale, barley, rye and barley varieties. These results were higher than suggested values of 8.0 g kgG by1
Tajeda et al. (1985). But high K concentration may cause Mg deficiency (Loreda et al., 1986).
P content was higher in spring sowing (3.37 g kgG )1
than in autumn sowing (3.20 g kgG ). In the autumn 1.051
concentrations of 1.8-3.9 g kgG for forage crops are1
recommended for ruminants (National Research Council, 2001). Results obtained for P concentration in this study were adequate for ruminants.
Mg content was higher in autumn sowing than in spring sowing and this difference was statistically significant. In both sowing dates, Mg concentration in the
all genotypes was between 0.82 and 1.47 g kgG (Table 5).1 Braunwart, K., D. Putnam and G. Fohner, 2001. Alternative Mg concentrations for forage crops are recommended
as 2.0 g kgG for ruminants by Tajeda et al. (1985) and1
1 g kgG for beef cattle by the NRC (1984). Grass tetany or1
hypomagnesemic tetany in cattle is caused by an imbalance of K, Ca and Mg in the diet. Mineral imbalances, deficiencies or excess and low bio-availability of essential minerals result in negative economic impacts when animal performance and health are compromised (Van Soest, 1982). Magnesium deficiency may lead to a reduction in weight gain, milk production and conception rate (Stuedemann et al., 1983).
Osman and Nersoyan (1986) pointed out that monocultures of common vetch or cereals do not provide satisfactory results for forage production. Similarly, Lithourgidis et al. (2006) indicated that forage quality of cereal hay is usually lower than that required to meet satisfactory production levels for many categories of livestock. On the other hand, Lawes and Jones (1971) showed that small grain cereals provide high yields in terms of dry weight.
CONCLUSION
The study showed that sowing date had great effect on hay yield and quality potential of oat genotypes. Comparison of hay yields by the sowing date indicated a clear advantage of autumn sowing. Based on 4 years data autumn sowed oat resulted in 56.4% higher hay yield than the spring sowed crop. However, in spring sowing, oat genotypes had higher quality values than in autumn sowing. This study also showed that late-maturing and tall genotypes like Yesilko-330, Yesilkoy-1779, Faikbey and Seydisehir performed better hay yield in autumn sowing but showed lower hay quality. On the contrary, there is no such a relationship in the spring sowing. With regard to low forage quality of cereals, forage yield and quality could be increased by growing suitable oat genotypes with legume forage crops.
REFERENCES
Anderson, L.J. and M.L. Kaufmann, 1963. A study of oat varieties for use as ensilage. Can. J. Plant Sci., 43: 157-160.
Assefa, G. and I. Ledin, 2001. Effect of variety, soil type and fertilizer on the establishment, growth, forage yield, quality and voluntary intake by cattle of oats and vetches cultivated in pure stands and mixtures. Anim. Feed Sci. Technol., 92: 95-111.
annual forages-now and in the future. Proceedings of 31st California Alfalfa Symposium, Dec. 12-13, University of California, Davis, pp: 38-44.
Caballero, A.R., E.L. Goicoechea-Oicoechea and P.J. Hernaiz-Ernaiz, 1995. Forage yields and quality of common vetch and oat sown at varying seeding ratios and seeding rates of vetch. Field Crops Res., 41: 135-140.
Celik, N. and V. Bulur, 1996. Tahillarin yem olarak kullanimi ve gelecekteki potansiyeli. Turkiye 3. Cayir-Mera ve Yembitkileri Kongresi, 17-19 Haziran, Erzurum. pp: 513-519.
Chapko, L.B., M.A. Brinkman and K.A. Albrecht, 1991. Genetic variation for forage yield and quality among grain oat genotypes harvested at early heading. Crop Sci., 31: 874-878.
Cherney, C.H. and G.C. Marten, 1982. Small grain crop forage potential: I. Biological and chemical determinants of quality and yield. Crop Sci., 22: 227-231.
Ericson, D.O., N.R. Riveland and E.W. French, 1977. The nutritional value of oat hay harvested at several stages of maturity. North Dakota Farm Res., 35: 13-16.
Fohner, G., 2002. Harvesting maximum value from small grain cereal forages. Proceedings Western Alfalfa and Forage Conference, Dec. 11-13, California, pp: 28-33.
Folkins, L.P. and M.L. Kaufmann, 1974. Yield and morphological studies with oats for forage and grain production. Can. J. Plant Sci., 54: 617-620.
Hoy, M.D., K.J. Moore, J.R. George and E.C. Brummer, 2002. Alfalfa yield and quality as influenced by establishment method. Agron. J., 94: 65-71.
Juskiw, P.E., J.H. Helms and D.F. Salmon, 2000. Competitive ability in mixtures of small grain cereals. Crop Sci., 40: 159-164.
Kaufmann, M.L., 1961. Yield-maturity relationships in oats. Can. J. Plant Sci., 41: 763-771.
Kim, J.D., S.G. Kim, S.J. Abuel, C.H. Kwon, C.N. Shin, K.H. Ko and B.G. Park, 2006. Effect of location, season and variety on yield and quality of forage oat. Asian-Aust. J. Anim. Sci., 19: 970-977. Kjos, N.P., 1990. Evaluation of the feding value of fresh
forages, silage and hay using near infrered reflectance analysis (NIR). I.A comparison of different methods for predicting the nutritive value. Norwegian J. Agric. Sci., 4: 305-320.
Lawes, D.A. and D.I.H. Jones, 1971. Yield, nutritive value and ensiling characteristics of whole-crop spring
cereals. J. Agric. Sci., 76: 479-485. Riveland, N.R., D.O. Erickson and E.W. French, 1977. An Linn, J.G. and N. P. Martin, 1989. Forage Quality Tests
and Interpretation. University of Minnesota, St. Paul. Lithourgidis, A.S., I.B. Vasilakoglou, K.V. Dhima, C.A. Dordas and M.D. Yiakoulaki, 2006. Forage yield and quality of common vetch mixtures with oat and triticale in two seeding ratios. Field Crops Res., 99: 106-113.
Loreda, C.M.A., G.A. Ardilla and V.J. Alvarez, 1986. Variation in mineral concentrations in grasses in the cattle farming area of the coribbean herb. Abstract, 56: 928-929.
Maloney, T.S., E.S. Oplinger and K.A. Albrecht, 1999. Small grains for fall and spring forage. J. Prod. Agric., 12: 488-494.
Moreira, N., 1989. The effect of seed rate and nitrogen fertilizer on the yield and nutritive value of oat-vetch mixtures. J. Agric. Sci., 112: 57-66.
Mut, Z., I. Ayan and H. Mut, 2006. Evaluation of forage yield and quality at two phenological stages of triticale genotypes and other cereals grown under rainfed conditions. Bangladesh J. Bot., 35: 45-53. NRC. (National Research Council), 1984. Nutrient
Requirements of Domestic Animals: Nutrient Requirements of Beef Cattle. 6th Revised Edn., NAS/NRC., Washington DC., USA.
National Research Council, 2001. Nutrient Requirements of Dairy Cattle. 7th Rev. Edn., National Academy of Sciences, Washington, DC.
Osman, A.E. and N. Nersoyan, 1986. Effect of the proportion of species on the yield and quality of forage mixtures and on the yield of barley in the following year. Exp. Agric., 22: 345-351.
Poblaciones, M.J., S. Rodrigo, N. Simoes, M.M. Tavares-de-Sousa, A. Bagulho and L. Olea, 2008. Instantaneous determination of chemical composition of Festuca sp. and Dactylis sp. at two different cut times using near infrared spectroscopy (NIRS). Options Mediterraneennes Ser. A, 79: 227-230.
evaluation of oat varieties for forage. N.D. Farm Res., 35: 19-22.
Smith, D., 1974. Influence of temperature on growth of Froker oats for forage. I. Dry matter yields and growth rates. Can. J. Plant Sci., 54: 725-730. Steel, R.G.D. and J.H. Torrie, 1980. Principles and
Procedures of Statistics: A Biometrical Approach. McGraw Hill Co., New York, USA.
Stuedemann, J.A., S.R. Wilkinson, H. Cioria and A.B. Caudle, 1983. Effect of levels of nitrogen fertilization of Kentucky-31 tall fescue (Festuca
arundinacea Schreb.) on brood cow health.
Proceedings of the International Grassland Congress, (IGC’83), Westwiev Press, Lexington, pp: 728-732.
Stuthman, D.D. and G.C. Marten, 1972. Genetic variation in yield and quality of oat forage. Crop Sci., 12: 831-833.
Tajeda, R., L.R. Mcdowell, F.G. Martin and J.H. Conrad, 1985. Mineral element analyses of various tropical forages in Guatemala and their relationship to soil concentrations. Nutr. Rep. Int., 32: 313-324. Van Soest, P.J., 1982. Nutritional Ecology of the Ruminant.
O and B Books Inc., Corvalis.
Waldo, D.R. and N.A. Jorgensen, 1981. Forages for high animal production: Nutritional and effects of conservation. J. Dairy Sci., 64: 1207-1229.
Zadok, J.C., T.T. Chang and C.F. Konzak, 1974. A decimal code for growth stages of cereals. Weed Res., 14: 415-421.
Zhang, Y.S., X.M. Zhou and Q.J. Wang, 1998. A preliminary analysis of production performance of Oat at alpine meadow pasture. Acta Agrestia Sin, 6: 115-123.