Assessment of the Effect of Beef and Mutton Meat Prices on Chicken
Meat Prices in Turkey Using Different Regression Models and the
Decision Tree Algorithm
Ahmet Cumhur AKIN
1,a
Mehmet Saltuk ARIKAN
2,bMustafa Bahadır ÇEVRİMLİ
3,cMustafa Agah TEKİNDAL
4,d1 Department of Animal Health Economics and Management, Mehmet Akif Ersoy University Faculty of Veterinary Medicine, TR-15030 Burdur - TURKEY
2 Department of Animal Health Economics and Management, Fırat University Faculty of Veterinary Medicine, TR-23119 Elazig - TURKEY
3 Department of Livestock Economics and Management, Selcuk University Faculty of Veterinary Medicine, TR-42003 Konya - TURKEY
4 Department of Biostatistic, Selcuk University Faculty of Veterinary Medicine, TR-42003 Konya - TURKEY
a ORCID: 0000-0003-3732-0529; b ORCID: 0000-0003-4862-1706; c ORCID: 0000-0001-5888-242X; d ORCID: 0000-0002-4060-7048
Article ID: KVFD-2019-22195 Received: 07.03.2019 Accepted: 18.07.2019 Published Online: 22.07.2019
How to Cite This Article
Akın AC, Arıkan MS, Çevrimli MB, Tekindal MA: Assessment of the effect of beef and mutton meat prices on chicken meat prices in Turkey using
different regression models and the decision tree algorithm. Kafkas Univ Vet Fak Derg, 26 (1): 47-52, 2020. DOI: 10.9775/kvfd.2019.22195
Abstract
Determination of the extent to which increases in the price of red meat is reflected in the price of chicken meat will shed light to the sector in many areas, including production planning. The purpose of this study is to present how the increases in the price of red meat are reflected in the consumer prices of chicken meat and to determine the estimation rate of the consumer prices of chicken meat by analysing the monthly average consumer prices of chicken meat, beef and mutton (TRY/kg) in Turkey between January 2005 and September 2018 using different regression models and the decision tree algorithm. The results of the study indicate that in predicting the prices of chicken meat using the prices of beef, the cubic regression equation gives accurate predictions at a rate of 91.4%, and in predicting the prices of chicken meat using the prices of mutton, the cubic regression equation gives accurate predictions at a rate of 89.9%. It was estimated that 1 unit increase in the prices of beef would result in an increase by 1.35 unit in the prices of chicken meat, and a 1 unit increase in the prices of mutton would result in an increase by 0.39 unit in the prices of chicken meat. Keywords: Red meat, Chicken meat, Price, Regression, Turkey
Türkiye’de Dana ve Koyun Eti Fiyatlarının Tavuk Eti Fiyatlarına Etki
Düzeylerinin Farklı Regresyon Modelleri ve Karar Ağacı Algoritması
İle Değerlendirilmesi
ÖzTürkiye’de kırmızı ette yaşanan fiyat artışlarının tavuk eti fiyatlarına yansımasının ne düzeyde olduğunun belirlenmesi, sektörün üretim planlaması başta olmak üzere pek çok hususta sektöre ışık tutacaktır. Bu çalışmanın amacı, 2005/01 Ocak ile 2018/09 Eylül döneminde aylara göre Türkiye geneli tavuk, dana ve koyun eti tüketici ortalama fiyatlarının (TL/kg) farklı regresyon modelleri ve karar ağacı algoritması ile analiz edilerek, kırmızı ette yaşanan fiyat artışlarının ne ölçüde tavuk eti tüketici fiyatlarına yansıdığını ortaya koymak ve tavuk eti tüketici fiyatlarının tahmin oranlarının belirlenmesidir. Çalışmanın sonuçlarına göre dana eti fiyatlarını kullanarak tavuk eti fiyatlarının tahmin edilmesinde kübik regresyon denklemi ile %91.4 açıklama oranında başarılı bir tahmin yapılırken, koyun eti fiyatlarında kübik regresyon denklemi ile %89.9 açıklama oranında başarılı bir tahmin yapılabileceği belirlenmiştir. Dana eti fiyatlarında meydana gelecek 1 birimlik değişimin kübik regresyona göre tavuk eti fiyatlarında 1.35 birimlik bir artışa, koyun eti fiyatlarında meydana gelecek 1 birimlik değişimin ise tavuk eti fiyatlarında 0.39 birimlik bir artışa yol açacağı tahmin edilmiştir.
Anahtar sözcükler: Kırmızı et, Tavuk eti, Fiyat, Regresyon, Türkiye
İletişim (Correspondence)
+90 248 2130000-2046 Mobile: +90 530 6945509INTRODUCTION
Foods of animal origin are important for sustainability of individual and social development. Easy access to and availability of such healthy foods that are one of the essential needs of humans is one of the common characteristics of developed countries. However, animal products are not supplied to all segments of the society at affordable prices and in sufficient amounts in Turkey.
In addition to the problems in the supply of red meat in Turkey, the amount of consumption of animal products is restricted by price level and consumers’ income level, two major factors underlying the preference for meat [1]. In Turkey between 2005 and 2018, per capita meat consumption increased by 3.06% for sheep, 211.29% for beef and 50.92% for chicken meat [2]. The sudden increase in the consumption of beef can be associated with imports after 2009. In the same period, meat prices increased. Chicken meat prices showed an increase of 214.24%, beef prices increased 273.80% and mutton prices increased by 349.59% [3]. As chicken meat is more affordable than red meat, consumers considerably shift their preferences to chicken meat when the price of red meat increases [4-7]. The major reason for this is that chicken meat and red meat are substitute goods [1]. Although costs are the primary factor affecting the formation of red meat and chicken meat prices, it can be said that there are also different variables that affect the prices [8]. Inputs such as feed raw materials, broiler breeder prices [9], packaging materials and energy costs are the factors that affect the price of chicken meat in Turkey [10]. On the other hand, consumer preferences [4] and socio-economic, psychological, seasonal factors also have an important role on the market price and supply-demand balance of chicken meat [11].
In the formation of red meat demand and price, production costs [12], consumer preferences [13], import decisions [14], government interventions in the red meat market, implemented policies and subsidies [15] are effective. The studies delving into the interaction between red meat and chicken meat in Turkey focus on the effects of taxes and beef prices on consumption of chicken meat [16], the factors affecting the consumption of red meat and chicken meat by households [17] and the factors affecting the consumption of fresh red meat [18].
Studies on livestock breeding use different linear and non- linear regression models. Such models were used in estimating the prices of beef and feed [19] and the optimum growth curve for cattle [20] and sheep [21]. The decision tree method, which is an alternative to general linear models [22], is widely used in estimating the price of chicken meat [23], determining factors affecting the consumption of red meat [24], estimating the factors affecting the birth weight of dairy cows [25] and determining the factors affecting milk yield [26].
The purpose of this study is to present how the increases in the price of red meat are reflected in the consumer prices of chicken meat and to determine the estimation rate of the consumer prices of chicken meat by analyzing the monthly average consumer prices of chicken meat, beef and mutton in Turkey between January 2005 and September 2018 using different regression models and the decision tree algorithm.
MATERIAL and METHODS
Data Set
The material of the study consists of the monthly average consumer prices of chicken meat, beef and mutton (TRY/ kg) in Turkey between January 2005 and September 2018. The prices of chicken meat, beef and mutton used in the study were obtained from the monthly consumer prices data set of the Turkish Statistical Institute (TURKSTAT) [3]. The beginning of the data in the TurkStat system was 2005 and this year was taken as a starting point.
Analysis Method
First, the chicken meat prices, the dependent variable in the analysis, were subjected to a goodness of fit test. Then, all input variables were estimated independently one by one using appropriate regression models. SPPS 25 and EasyFit 5.4 Professional [27] were employed to evaluate the data.
Regression Curve Estimation Models were used in the first stage of the analysis. Estimation models for one or more curves can be obtained by regression analysis. The relation-ship between variables can have a linear or another type of distribution. In such cases, it is better to use different models.
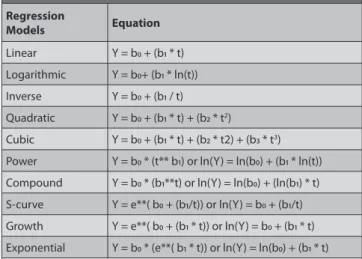
Among the models given in Table 1, the model with the Table 1. Regression models for estimating the consumer price of chicken
meat Regression Models Equation Linear Y = b0 + (b1 * t) Logarithmic Y = b0+ (b1 * ln(t)) Inverse Y = b0 + (b1 / t) Quadratic Y = b0 + (b1 * t) + (b2 * t2) Cubic Y = b0 + (b1 * t) + (b2 * t2) + (b3 * t3) Power Y = b0 * (t** b1) or ln(Y) = ln(b0) + (b1 * ln(t)) Compound Y = b0 * (b1**t) or ln(Y) = ln(b0) + (ln(b1) * t)
S-curve Y = e**( b0 + (b1/t)) or ln(Y) = b0 + (b1/t)
Growth Y = e**( b0 + (b1 * t)) or ln(Y) = b0 + (b1 * t)
Exponential Y = b0 * (e**( b1 * t)) or ln(Y) = ln(b0) + (b1 * t)
Y = dependent variable, b0 = regression equation’s constant term, b1=
highest coefficient of determination according to the result of the regression analysis was selected and evaluated. In the analysis section of the study, the relationship between the dependent variables and the independent variable is presented according to the result of the curve estimations. Then, in an attempt to conduct comparative analyses of major decision tree algorithms, C4.5(J48) [28], Decision Stump [29], Hoeffding Tree [30], LMT [31,32], Random Forest [33], Random Tree [34] and RepTree [35] algorithms on WEKA (Waikato Environment for Knowledge Analysis) were used. The original data set was randomly divided into ten equal parts using the 10-fold cross validation method. Subsequently, one of the parts was kept as validation data to test the model, and the remaining nine parts were used as training data. The cross validation process was carried out 10 times, using each of the 10 parts as validation data for once [36]. In obtaining the comparative results from the decision tree algorithms, no method was employed to select any of the attributes in the data set, and all attributes were taken into account in developing the classification model. The data set does not contain any missing values. For this
reason, it was not subjected to pre-processing. The price of chicken meat was assessed using the CRT (Classification And Regression Tree) algorithm.
RESULTS
In order to identify the relationship between the consumer prices of chicken meat and the consumer prices of beef and mutton, analyses were conducted using 10 different regression models. The results are given in Table 2 and
Table 3 below. The explanatory model of the cubic
regression model for beef and mutton was found to be the highest according to the R2 values of the regression models developed to estimate the consumer prices of chicken meat.
In estimating the consumer prices of chicken meat using the consumer prices of beef, the cubic regression equation (1) gives accurate estimations with a percentage of variance explained of 91.4%. It was estimated that a 1 unit increase in the consumer prices of beef would result in a 1.35 unit increase in the consumer prices of chicken meat according to the cubic regression model.
Table 2. Models for estimating the consumer prices of chicken meat by different regression equations for the consumer prices of beef
Equation Model Estimates Coefficients Estimates
R2 F sd1 sd2 P Constant b1 b2 b3 CONSUMER PRICES OF BEEF Linear 0.862 1014.590 1 163 0.001 1.838 0.171 Logarithmic 0.885 1256.042 1 163 0.001 -7.041 4.202 Inverse 0.858 988.745 1 163 0.001 10.282 -87.320 Quadratic 0.877 578.430 2 162 0.001 0.207 0.313 -0.003 Cubic 0.914 573.363 3 161 0.001 -7.830 1.404 -0.047 0.001 Compound 0.791 615.495 1 163 0.001 2.781 1.030 Power 0.862 1014.210 1 163 0.001 0.565 0.744 S 0.884 1244.513 1 163 0.001 2.516 -15.894 Growth 0.791 615.495 1 163 0.001 1.023 0.029 Exponential 0.791 615.495 1 163 0.001 2.781 0.029
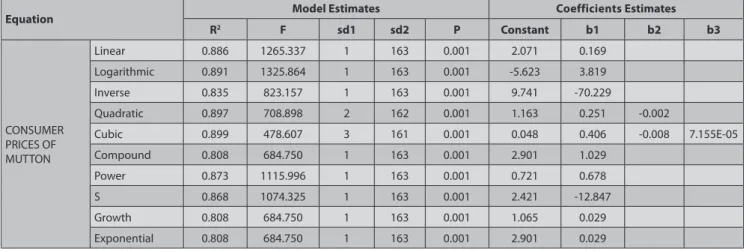
Table 3. Models for estimating the consumer prices of chicken meat by different regression equations for the consumer prices of mutton
Equation Model Estimates Coefficients Estimates
R2 F sd1 sd2 P Constant b1 b2 b3 CONSUMER PRICES OF MUTTON Linear 0.886 1265.337 1 163 0.001 2.071 0.169 Logarithmic 0.891 1325.864 1 163 0.001 -5.623 3.819 Inverse 0.835 823.157 1 163 0.001 9.741 -70.229 Quadratic 0.897 708.898 2 162 0.001 1.163 0.251 -0.002 Cubic 0.899 478.607 3 161 0.001 0.048 0.406 -0.008 7.155E-05 Compound 0.808 684.750 1 163 0.001 2.901 1.029 Power 0.873 1115.996 1 163 0.001 0.721 0.678 S 0.868 1074.325 1 163 0.001 2.421 -12.847 Growth 0.808 684.750 1 163 0.001 1.065 0.029 Exponential 0.808 684.750 1 163 0.001 2.901 0.029
(for price of beef) (1) In estimating the consumer prices of chicken meat using the consumer prices of mutton, the cubic regression equation (2) gives accurate estimations with a percentage of variance explained of 89.9%. It was estimated that a 1 unit increase in the consumer prices of mutton would result in a 0.39 unit increase in the consumer prices of chicken meat according to the cubic regression model.
(for price of mutton) (2)
As is seen in Table 1 and Table 2, there is a statistically significant relationship between the consumer prices of beef and mutton and the consumer prices of chicken meat. However, the relationship of chicken meat prices with the beef prices is more significant, albeit slightly.
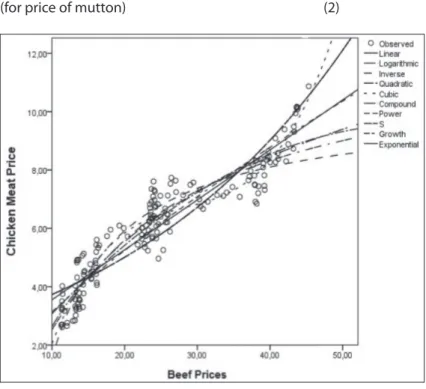
The results of the analyses conducted to relationship between the consumer prices of beef and the consumer prices of chicken meat (TRY/kg) and relationship between the consumer prices of mutton and the consumer prices of chicken meat (TRY/kg) are given in Fig. 1 and Fig. 2 below.
The results of the analyses conducted to identify the relationship between the consumer prices of chicken meat and the consumer prices of beef using CRT (Classification And Regression Tree) algorithm are given in Fig. 3 below. According to the CRT (Classification And Regression Tree) algorithm for the consumer price of chicken meat, the consumer price of beef affects the price of chicken meat significantly in the first step, and can be divided into two categories as ≤23.234 TRY and >23.235 TRY. It is 57.6% more effective to estimate the consumer price of chicken meat when the consumer price of beef is less than or equal to 23.234 TRY and 42.4% more eff ective to estimate the consumer price of chicken meat when the consumer price of beef is above 23.235 TRY.
Fig 2. Relationship between the consumer prices of mutton and the consumer
prices of chicken meat (TRY/kg)
Fig 1. Relationship between the consumer prices of beef and the consumer prices
of chicken meat (TRY/kg)
Fig 3. CRT algorithm for consumer price of chicken meat
DISCUSSION
This study is to present how the increases in the price of red meat are reflected in the consumer prices of chicken meat and to determine the estimation rate of the consumer prices of chicken meat. Formation of the prices of chicken and red meat is affected by many factors. They include production costs, feed amount and prices, natural and seasonal conditions, prices of substitute goods, consumer income and preferences, and purchasing power. These factors are dominant in the formation of retail prices of chicken meats [8,37]. Review of the main factors affecting the price of chicken meat is important to understand the issue. The levels of the effect of the cost items constituting the production cost and of external factors on the formation of prices differ.
In Turkey, production costs are the most important factors affecting the market price of chicken meat [9]. A study reports that a 10 percent increase in the price of soybean used in the poultry sector results in a 3.84 percent increase in the price of chicken meat in Turkey, and that the price of chicken meat and the prices of electricity and soybean are in an equilibrium relationship [7]. A study concerning the prices of chicken meat reported that a 50 percent decrease in the price of corn in China resulted in a 32 percent decrease in the price of chicken, whereas a 50 percent decrease in the price of soy flour resulted in a 16 percent decrease in the price of chicken [38]. It is understood that chicken meat prices decreased by 68% and feed prices decreased by 24% between the years 1990 and 2004. in the same study, it was shown that the feed was due to import origin [9].
A correlation analysis was performed with the aim of determining the level of relation between real whole chicken prices and feed prices in 1994-2006 period and the correlation coefficient was computed as (r = + 0.731 and P<0.05). This result demonstrates that, in the pricing of chicken meat, other factors are effective besides the feed input cost [8].
According to the regression model (r2 :0.93) established for the demand for chicken meat between 1983 and 1998, 1% increase in the price of chicken meat reduced the demand of 0.030%, 1% increase in beef meat increased the demand of 0.001% and 1% increase in the price of mutton meat increased the demand of 0.000002% [39].
Apart from the production costs, another factor that affects the prices of chicken meat is the presence of substitute goods. Substitute goods may affect the consumer demand for each other according to their quality and price. A study reports that the consumer prices of mutton affect the consumption of chicken meat [39]. It is reported that the price of chicken meat and people’s level of income increase the consumption of beef [1]. Another study focusing on the increases in the prices red meat and chicken meat
reported that the need for animal protein was met by consuming cheaper products, and that the increase in the consumption of chicken meat stemmed from the increases in the price of red meat [18].
In a study delving into the effects of taxes and the price of beef on the consumption of chicken meat in Turkey with a partial equilibrium approach, the tax elasticity was calculated to be -0.23, the price elasticity of demand for chicken meat 0.37, the income elasticity of demand for chicken meat 0.95 and chicken meat/beef elasticity -0.81 [16]. In another study aimed at identifying the factors that affect the consumption of red meat and chicken meat in 2.690 households living in provincial centers in Turkey using an ideal demand analysis model, the expenditure elasticities of chicken meat and beef were calculated to be 0.9394 and 0.8691, respectively [17].
The products with the highest income elasticity of demand were found to be goat meat (0.53), mutton (0.48) and beef (0.32), whereas the income elasticities of demand for chicken and fish were calculated to be 0.08 and 0.11, respectively. Additionally, the price elasticities of demand for chicken and fish were found to be -0.32 and -0.20, respectively [40]. A 1% increase in the beef price would decrease beef consumption by approximately 7.6% in the long run. A 1% change in the price of chicken meat will result in a long run change of approximately 4.2% in beef consumption [1]. In same study, In the long run, beef consumption, chicken meat prices, and income level contribute to beef prices by 18.95%, 13%, and 0.19%, respectively. The results also indicate that a 30.5% portion of chicken meat prices is explained by its own innovations whereas the contributions of beef consumption, beef prices, and the per capita income level are 4.17%, 64.44%, and 0.87%, respectively. It was estimated that a 1 unit increase in the consumer prices of beef would result in a 1.35 unit increase in the consumer prices of chicken meat according to the cubic regression model. It was estimated that a 1 unit increase in the consumer prices of mutton would result in a 0.39 unit increase in the consumer prices of chicken meat according to the cubic regression model.
The increase in beef prices has lead Turkish consumers to shift from beef to chicken meat [1]. According to one study, it was stated that the reason for the preference of chicken meat was its suitable price compared to other meat [41]. The results of the study indicate that in estimating the consumer prices of chicken meat using the consumer prices of beef and mutton, the cubic regression equation has a high explained variance, suggesting that it is a good model to make a successful estimation. It can be said that the consumer prices of beef and mutton affect the consumer prices of chicken meat, and that the effect of the consumer price of beef on the consumer price of chicken meat is higher than that of the consumer price of mutton.
The main reason why the effect of the consumer price of beef is higher than that of the consumer price of mutton is that the output and the marketing opportunities of beef are higher. Furthermore, consumer habits and health reasons should be noted that the consumer is removed from the mutton. It can be said that the consumer prices of beef affect the consumer prices of chicken meat according to the decision tree algorithm.
REFERENCES
1. Erdoğdu H, Çiçek H: Modelling beef consumption in Turkey: The
ARDL/bounds test approach. Turk J Vet Anim Sci, 41 (2): 255-264, 2017. DOI: 10.3906/vet-1606-43
2. OECD: Meat consuption. OECD Agriculture Statistics: OECD-FAO. Agricultural Outlook, 2018.
https://data.oecd.org/agroutput/meat-consumption.htm; Accessed: 10.05.2019
3. TURKSTAT: Turkish Statistical Institute. Consumer prices data. Ankara,
2018. https://biruni.tuik.gov.tr/medas/?kn=110&locale=tr Accessed: 15.03.2018.
4. Aral Y, Aydın E, Demir P, Akın AC, Cevger Y, Kaya Kuyululu ÇY, Arıkan MS: Consumer preferences and consumption situation of chicken
meat in Ankara Province, Turkey. Turk J Vet Anim Sci, 37 (5): 582-587, 2013. DOI: 10.3906/vet-1210-36
5. Keskin B, Demirbaş N: Türkiye’de kanatlı eti sektöründe ortaya çıkan
gelişmeler: sorunlar ve öneriler. U Ü Ziraat Fak Derg, 26 (1): 117-130, 2012.
6. Akın AC, Arıkan MS, Çevrimli MB: Effect of import decisions in Turkey
between 2010-2017 on the red meat sector. In, 1st International Health
Science and Life Congress in Burdur, May 2-5, Burdur-Turkey, 2018. 7. Çınar G, Keskin B: The spillover effect of imported inputs on broiler
prices in Turkey. New Medit, 17 (1): 37-47, 2018. DOI: 10.30682/nm1801d
8. Demir P, Aral Y, Cevger Y, Aydın E: An economic assessment of the
chicken meat/feed price interactions in Turkish broiler sector. In, 2nd
Mediterraean Summit of WPSA, Prospects of World Poultry: A Mediterrane an Perspective, 04-07 October, Antalya - Turkey, 2009.
9. Çiçek H, Tandoğan M: Türkiye’de piliç eti fiyatları ve etkili faktörler. JPR,
7 (1): 52-57, 2007.
10. Koca S: Piliç eti sektörü: Hedefler ve potansiyel problemler. In, I. Uluslararası Beyaz Et Kongresi, 11-15 Mayıs, Antalya-Turkey, 2011. 11. Aral Y, Demir P, Cevger Y, Aydın E: An economic assessment of the
chicken meat/feed price interactions in Turkish broiler sector. J Anim Vet
Adv, 9 (9): 1366-1369, 2010. DOI: 10.3923/javaa.2010.1366.1369
12. Aydın E, Sakarya E: Kars ve Erzurum illeri entansif sığır besi
işletmelerinin ekonomik analizi. Kafkas Univ Vet Fak Derg, 18 (6): 997-1005, 2012. DOI: 10.9775/kvfd.2012.6917
13. Aral Y, Demir P, Aydın E, Akın AC, Sakarya E, Çavuşoğlu E, Polat M:
Factors affecting beef consumption and consumer preferences in Turkey
A case of Ankara Province. In, 64th Annual Meeting of the European
Federation of Animal Science-EAAP, 26-30 August, Nantes - France, 2013. 14. Aydın E, Aral Y, Can MF, Cevger Y, Sakarya E, İşbilir S: Türkiye de
son 25 yılda kırmızı et fiyatlarındaki değişimler ve ithalat kararlarının etkilerinin analizi. Vet Hekim Der Derg, 82 (1): 3-13, 2011.
15. Arıkan MS, Çevrimli MB, Akın AC, Tekindal MA: Determining the
change in retail prices of veal in Turkey by GARCH method between 2014-2017. Kafkas Univ Vet Fak Derg, 25 (4): 499-505, 2019. DOI: 10.9775/ kvfd.2018.21187
16. Fidan H: The impacts of beef prices and VAT on chicken meat
consumption: A partial equilibrium approach. Turk J Vet Anim Sci, 29 (5): 1083-1091, 2005.
17. Sacli Y, Özer OO: Analysis of factors affecting red meat and chicken
meat consumption in Turkey using an ideal demand system model. Pak J
Agri Sci, 54 (4): 933-942, 2017. DOI: 10.21162/PAKJAS/17.5849
18. Demirtas B: The effect of price increases on fresh meat consumption
in Turkey. Acta Univ Agric Silvic Mendelianae Brun, 66 (5): 1249-1259, 2018.
DOI: 10.11118/actaun201866051249
19. Çiçek H, Doğan İ: Türkiye’de canlı sığır ve sığır eti ithalatındaki
gelişmeler ve üretici fiyatlarının trend modelleri ile incelenmesi. Kocatepe
Vet J, 11 (1): 1-10, 2018.
20. Bayram B, Akbulut Ö: Esmer ve siyah alaca sığırlarda büyüme
eğrilerinin doğrusal ve doğrusal olmayan modellerle analizi. J Anim Prod, 50 (2): 33-40, 2009.
21. Yıldız G, Soysal Mİ, Gürcan EK: Tekirdağ ilinde yetiştirilen Karacabey
merinosu x kıvırcık melezi kuzularda büyüme eğrisinin farklı modellerle belirlenmesi. Tekirdağ Ziraat Fak Derg, 6 (1): 11-19, 2009.
22. Eyduran E, Karakus K, Keskin S, Cengiz F: Determination of factors
influencing birth weight using regression tree (RT) method. J Appl Anim
Res, 34 (2): 109-112, 2008. DOI: 10.1080/09712119.2008.9706952 23. Shih ML, Huang BW, Chiu NH, Chiu C, Hu WY: Farm price prediction
using case-based reasoning approach-A case of broiler industry in Taiwan.
Comput Electron Agr, 66 (1): 70-75, 2009. DOI: 10.1016/j.compag.2008.12.005 24. Ercan U, Canbazoğlu E: Determination of socioeconomic and
demographic factors affecting household red meat consumption by CHAID analysis. In, International Conference on Food and Agricultural
Economics, 27-28 April, Antalya - Turkey, 2017.
25. Yılmaz I, Eyduran E, Kaygısız A: Determination of non-genetic
factors influencing birth weight using regression tree method in brown-swiss cattle. Can J App Sci, 1 (3): 382-387, 2013.
26. Bakır G, Keskin S, Mirtagioglu H: Determination of the effective
factors for 305 days milk yield by Regression Tree (RT) method. J Anim Vet
Adv, 9 (1): 55-59, 2010. DOI: 10.3923/javaa.2010.55.59
27. Schittkowski K: EASY-FIT: A software system for data fitting in
dynamical systems. Struct Multidiscipl Optim, 23, 153-169, 2002. DOI: 10.1007/s00158-002-0174-6
28. Quinlan JR: C4. 5: Programs for Machine Learning. Elsevier. 2014. 29. Witten IH, Frank E, Hall MA, Pal CJ: Data Mining: Practical Machine
Learning Tools and Techniques. Morgan Kaufmann, 2016.
30. Domingos P, Hulten G: Mining high-speed data streams. In, Proceedings of the sixth ACM SIGKDD International Conference on Knowledge Discovery and Data Mining. 71-80, 20-23 August, Boston-Massachusetts, 2000. 31. Landwehr N, Hall M, Frank E: Logistic model trees. Mach Learn, 59
(1-2): 161-205, 2005. DOI: 10.1007/s10994-005-0466-3
32. Doetsch P, Buck C, Golik P, Hoppe N, Kramp M, Laudenberg J, Mauser A: Logistic model trees with auc split criterion for the kdd cup
2009 small challenge. In, Proceedings of the 2009 International Conference
on KDD-Cup 2009-Volume 7: 77-88, 28 June-01 July, Paris, 2009. 33. Breiman L: Random forests. Mach Learn, 45 (1): 5-32. 2001.
34. Fan W, Wang H, Yu PS, Ma S: “Is Random Model Better? On Its
Accuracy and Efficiency”, In, The Third IEEE International Conference on
Data Mining, 51-58, 22 November, Melbourne, 2003.
35. Zhao Y, Zhang Y: Comparison of decision tree methods for finding
active objects. Adv Space Res, 41 (12): 1955-1959, 2008. DOI: 10.1016/j. asr.2007.07.020
36. Onan A: Şirket iflaslarının tahmin edilmesinde karar ağacı algoritmalarının
karşılaştırmalı başarım analizi. BTD, 8 (1): 9-19, 2015. DOI: 10.17671/ btd.36087
37. Turhan Ş, Erdal B, Çetin B: Türkiye’de kırmızı ette fiyat oluşumu ve
etkileyen faktörler. In, Türkiye IX. Tarım Ekonomisi Kongresi, 22-24 Eylül Şanlıurfa-Türkiye, 2010.
38. Gale F, Arnade C: Effects of rising feed and labor costs on China’s
chicken price. Int Food Agrıbus Man, 18, 137-150, 2015.
39. Dağdemir V, Demir O, Keskin A: Estimation of supply and demand
models for chicken meat in Turkey. J Appl Anim Res, 25 (1): 45-48, 2004. DOI: 10.1080/09712119.2004.9706472
40. Akbay C, Bilgic A, Miran B: Türkiye’de önemli gıda ürünlerinin talep
esneklikleri. Tarım Ekonomisi Derg, 14 (1-2): 55-65, 2008.
41. Akçay A, Sarıözkan S, Al S: Akademik personelin et tüketim tercihlerinin
analitik hiyerarşi prosesi ile değerlendirilmesi. Vet Hekim Der Derg, 89 (1): 11-24, 2018.