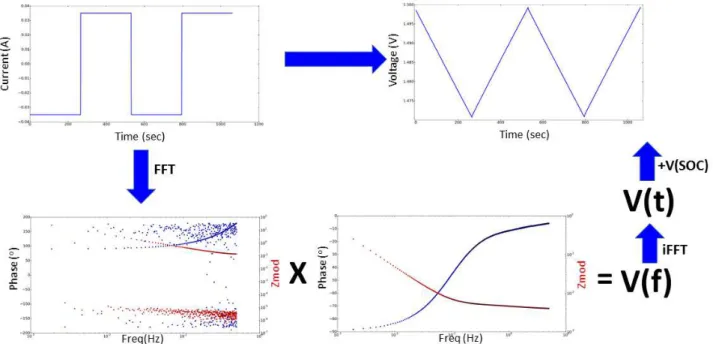
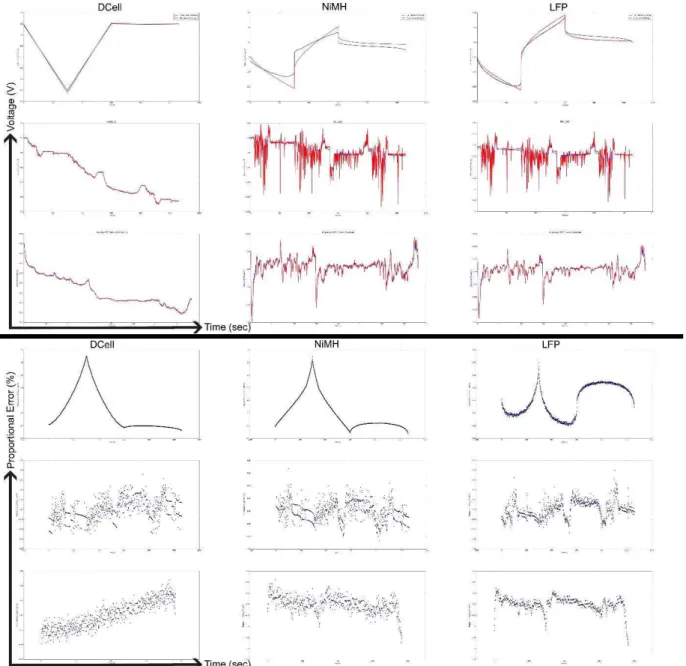
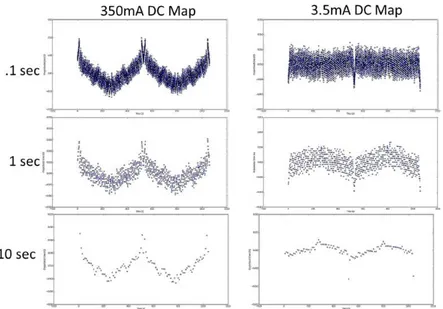
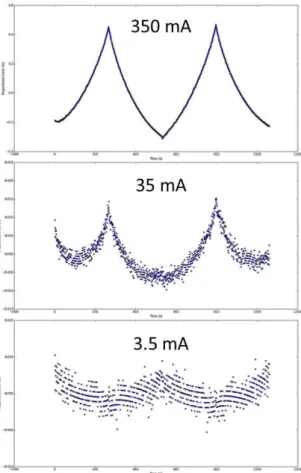
Analysis of errors in zero-free-parameter modeling approach to predict the voltage of electrochemical energy storage systems under arbitrary load
Tam metin
Şekil

Benzer Belgeler
This study presented a simulation based optimization approach based on the integration of EnergyPlus building performance simulation program with GenOpt optimiza-
Moment Zahhak wakes up and the reaction of courtiers.Gold and silver are used for the painting. The dominant color is warm colors including yellow, azure blue, red, pink, dark
Adli Tıp İhtisas Kurulu tarafından düzenlenmiş kararlarda; Sosyal Güvenlik Kurumu-Sosyal Sigorta Yüksek Sağlık Kurulu tarafından malulen emeklilik talepleri
Genel akademik başarı seviyelerine göre yapılan değerlendirmede ise Gregorc Öğrenme Stili Modeli’nde teknik öğretmen adaylarının en fazla kullanmayı tercih
Analjezik ahml3 kategoriye aynldl (analjezik kullamml yok, arahkh, duzenli). araSI, 0.5 km.den az olmak iizere kaydedildi. Cerrahi slfasll1da disk hernisinin lokalizasyonu,
ölüm yıl dönümüne raslıyan 24 şubat günü Abdül- hak HSmid Derneği ile Güzel Sanatlar Akademisi Öğ renciler Derneği ortaklaşa olarak bir anma töreni
In this study, following a brief discussion on the deviations of defense projects in terms of defense planning process, Program Management Approach, which may be defined briefly
Young people and low-inco- me smokers are two-to-three times more likely to quit or smoke less than other smokers after price increases, because these groups are the most
