ALTERATIONS IN THE MOLECULAR PROPERTIES OF
NEURAL STEM CELLS FROM AGED BRAINS AND
BRAIN TUMORS
A THESIS SUBMITTED TO
THE GRADUATE SCHOOL OF ENGINEERING AND SCIENCE
OF BILKENT UNIVERSITY
IN PARTIAL FULFILLMENT OF THE REQUIREMENTS FOR
THE DEGREE OF
MASTER OF SCIENCE
IN
NEUROSCIENCE
By
Özge Pelin Burhan
ii
ALTERATIONS IN THE MOLECULAR PROPERTIES OF NEURAL STEM CELLS FROM AGED BRAINS AND BRAIN TUMORS
By Özge Pelin Burhan June 2017
We certify that we have read this thesis and that in our opinion it is fully adequate, in scope and in quality, as a thesis for the degree of Master of Science.
Michelle Marie Adams (Advisor)
Gözde Akar
Ayşe Begüm Tekinay
Approved for the Graduate School of Engineering and Science
iii ABSTRACT
ALTERATIONS IN THE MOLECULAR PROPERTIES OF NEURAL STEM CELLS FROM AGED BRAINS AND BRAIN TUMORS
Özge Pelin Burhan M.Sc. in Neuroscience Advisor: Michelle Marie Adams
June 2017
It is known that new neuron formation in the brain continues throughout the life of an organism. In the adult human brain, it was proven that neurogenesis in the hippocampus is higher than expected, almost 700 new neurons are formed in a day. The formation of new neurons is supported by the stem cell subpopulation in the brain. With learning and the formation of new memories, the neuron production increases. However, changes in the cognitive abilities with advancing age are thought to be caused by the functional and molecular alterations in the stem cell populations. Molecular changes in neural stem cells throughout aging were found to be deterrents of the increased risk of cancer with age, such as tumor suppressor mechanisms. However, the activation and overlap of tumor suppressing mechanisms result in senescence in stem cells that have accumulated oncogenic mutations, which causes the stem cell pool exhaustion. It is thought that cancer cells acquire stem cell-like properties in order to have the unlimited proliferation and self-renewal properties, which are characteristics of both healthy and cancer stem cells. Neural cancer stem cells have the ability to produce glial and neural cells, like normal stem cells. The cancer stem cell subpopulations are implicated in the growth of tumor tissues. Hence, it is important to identify and characterize cancer stem cells and make a distinction between cancer and non-cancer stem cells. In this project, this issue was addressed by studying the marker expressions of brain tumor tissues obtained from humans, which confirmed that the cancer cells do express stem cell and progenitor cell markers, such as Sox2 and Vimentin. The presence of mature neurons was also established by the mature neuronal marker NeuN. In order to determine whether these stem cells may be different in young and old subjects, a study was also carried out in young and old zebrafish neural stem cells in order to identify the expression differences between the groups. The presence of proliferating stem cells and differentiated cells were identified in cell culture. This analysis of neural stem cells in old and young zebrafish revealed 18 differentially-expressed genes. The results indicated a higher
iv
differentiation rate in old zebrafish stem cells, which may be due to the increased loss of neural cells in the old zebrafish brain.
The development of markers that could be widely used for the diagnosis of cancer and the identification of cell types is important. For reliable diagnosis and identification of cancer cells, multiple cellular markers are used. Hence the distinction of cell types based on light scattering differences would speed up the process of diagnosis, and the elimination of marker used for the distinction of cell types would be beneficial. The final project mentioned in this thesis involves the analysis of C6 (rat glioma) cell line for scattering properties and cell cycle arrest. A general method for definition of a scatter data interval for C6 cells in different stages was developed and can be applied to other cell types and diseases. These studies show that the proliferation and stem cell markers’ expressions differ between cancer and healthy stem cells, and the expression of neuroprotective genes is differentially upregulated in old zebrafish neural stem cells compared to the young. This data could contribute to the knowledge on normal and cancer stem cell expression differences, as well as how age affects the expression, and supply information required for the development of a cancer stem cell identification and targeting methods.
Keywords: Neural stem cells, cancer stem cells, zebrafish, glioma, RNA-seq analysis, flow cytometry
v ÖZET
YAŞLI BEYİNDEN VE BEYİN TÜMÖRLERİNDEN ELDE EDİLEN NÖRAL KÖK HÜCRELERİN MOLEKÜLER ÖZELLİKLERİNDEKİ DEĞİŞİKLİKLER
Özge Pelin Burhan
Nörobilim Lisansüstü Programı, Yüksek Lisans Tez Danışmanı: Michelle Adams
Haziran 2017
Canlılarda yeni nöron oluşumu, nörogenez, her yaşta devam etmektedir. Yapılan araştırmalarda, yetişkin insan beyninin hipokampüs bölgesinde her gün yaklaşık 700 yeni nöron oluştuğu gözlemlenmiştir. Yeni nöron oluşumu beyindeki nöral kök hücre populasyonu tarafından desteklenmektedir. Öğrenme ve yeni anı oluşumunun nörogenezi arttırdığı gözlenmiştir. Yaşlı beyinde nörogenez devam etmesine rağmen bilişsel fonksiyonlar azalmaktadır. Buna yaşlanmayla birlikte kök hücre populasyonlarındaki moleküler ve fonksiyonel değişimlerin sebep olduğu düşünülmektedir. Yaşlı organizmalarda kök hücrelerin DNA tamir mekanizmalarının işlevselliğinin azaldığı ve bu sebeple kanser oluşumunu tetikleyici mutasyonların zamanla arttığı gözlemlenmiştir. Kanser oluşumunu engellemek için yaşlı organizmaların kök hücrelerinde tümör baskılayıcı yolakların aktifleştiği ve tumor oluşturma riski taşıyan kök hücrelerin hücre döngüsünü askıya aldığı belirlenmiştir. Yaşlanma sebebiyle kök hücrelerin senesens fazına girmesi replike olabilecek kök hücre sayısının azalmasına sebep olmaktadır. Kök hücrelere benzer özelliklere sahip olan kanser kök hücreleri de kendilerini replike edebilir, yenileyebilir ve normal kök hücreler gibi başkalaşmış hücreler oluşturabilirler. Kanser kök hücrelerinin tümör dokularında bulunduğu, tümörün büyümesi ve yayılmasına sebep olduğu düşünülmektedir. Bu sebeple, kanser kök hücre ve normal kök hücre ayrımı ve karakterizasyonu önem taşımaktadır. Bu projede normal ve kanser kök hücre işaretçi ifadelerini ve farklılıklarını inceledik. Vimentin ve Sox2 gibi kök hücre ve öncü hücre işaretçilerini ifade eden hücreleri, tümör içerisindeki kök hücre populasyonunun varlığını gösterdi. Beyin kök hücrelerindeki yaşa bağlı farklılıkların incelenmesi için genç ve yaşlı zebrabalığı beyinlerinden kök hücre elde edilmiş, immün boyamalarda elde edilen hücrelerin bölünme, başkalaşma ve kök hücre işaretçileri taşıdığı görülmüştür. Ayrıca yapılan RNA sekans analizlerinde genç ve yaşlı
vi
balık nöral kök hücreleri arasında farklı seviyelerde ifade edilen 18 gen saptanmıştır. Bu sonuçlar yaşlı balıklar kök hücrelerinde daha yüksek başkalaşım hızı olduğunu ve genç balıklara göree fazla ifade edilen genlerin nöron koruyucu özellikleri olduğunu göstermektedir.
Kullanılan hücre işaretçilerinin sadece kanser veya normal kök hücrelerde bulunmadığı gözlemlenmiştir. Sadece kanser kök hücrelerinde bulunan işaretçilerinin araştırılması hem diagnoz hem de hücre hedefli tedavi geliştirilebilmesi için önemlidir. Şu an kanser hücrelerinin karakterizasyonu için hastadan doku alınmakta ve birden çok hücresel işaretçi ifadesine bakılmakta ve bu işlemler diagnoz sürecini yavaşlatmaktadır. Bu tez çalışmasında bahsedilen son projede hücrelerin bilgisayar modellemesi için C6 (sıçan glioma) hücre hattının hücre döngüsünün farklı fazlarında akış sitometrisi cihazıyla ışık saçılım ölçümleri yapılmıştır. Bu çalışmada sağlıklı ve hastalıklı hücre tiplerine belirli ışık saçılım araklıklarının atanması hedeflenmiştir. Her hücre tipine özgü ışık saçılım değerlerinin belirlenmesiyle, hücre karakterizasyonu için işaretçi kullanımının gerekliliğinin ortadan kaldırılması amaçlanmıştır. Bu çalışmalar sonucunda kanser ve normal kök hücrelerinin bölünme, kök hücre ve başkalaşmış hücre işaretçilerini farklı olarak ifade ettikleri, RNA sekans analizindeyse yaşlı nöral kök hücrelerinin daha çok var olan olgun nöronları korumaya yönelik genleri ifade ettikleri gözlemlenmiştir. Bu veriler, normal ve kanserli kök hücre gen ifade farklılıklarının tanımlanması, yaşın kök hücrelerde gen ifadesine etkilerinin anlaşılması ve bir kanser kök hücre tanımlama ve hedefleme yöntemlerinin geliştirilmesi için gerekli bilgi sağlanmasına katkıda bulunabilir.
Anahtar sözcükler: Nöral kök hücreler, kanser kök hücreleri, zebrabalığı, glioma, RNA sekans analizi, akış sitometrisi
vii
Acknowledgement
I would first like to express my profound gratitude to my thesis advisor Assoc. Prof Michelle M. Adams and to Dr. Ayca Arslan-Ergul for their guidance, support and allowing me to work on intriguing projects that would build and expand my skills and knowledge. Without their encouragement, I would not have stepped into the field of bioinformatics.
I would like to thank Prof. Gozde Bozdagi Akar and Assoc. Prof. Ayse Begum Tekinay for their kindness on accepting to take part in my thesis committee. I am thankful to Assoc. Prof. Tekinay for also allowing me to use the flow cytometer in her lab.
I consider myself very fortunate to be a part of the lab that has become a second family. Elif Tugce Karoglu, Esra Senol, Naz Serifoglu, Melek Umay Tuz-Sasik, Begun Erbaba, and Narin Ilgim Ardic, I am thankful for their support and friendship.
I would like to thank Tekinay lab members, Gokhan Gunay, Canelif Yilmaz and Idil Uyan for their help.
I would also like to thank Furkan Akdemir for his patience, support and understanding. Without his help, the computational analyses in my thesis could not have been done.
I am thankful to my dear friends Irem Sozen, Yaprak Besik and Elcin Kinikli, Goksemin Fatma Sengul for their love, help and support.
Finally, I would like to express my profound gratitude to my family for providing me with unconditional love, support and encouragement. I could not have written the thesis without their help. Thank you.
viii
The projects mentioned in chapters 2 and 3 were supported by The Scientific And Technological Research Council of Turkey with grant number 114S548. The reagents used in the last project mentioned in Chapter 4 was bought from the budget of Communications and Spectrum Management Research Center (ISYAM).
ix
Contents
1INTRODUCTION ... 1
1.1 Neurogenesis ... 1
1.2 Stem Cells ... 3
1.3 Stem Cells, Cancer and Aging ... 4
1.4 Cell Markers ... 5
2 Stem Cell Isolation from Human Tumor Samples ... 7
2.1 INTRODUCTION ... 7
2.2 METHODS ... 11
2.2.1 Handling and Storage of Tumor Tissue ... 11
2.2.2 Stem Cell Extraction ... 11
2.2.3 Maintaining and Passaging of the Cells ... 12
2.2.4 BrdU treatments ... 12
2.2.5 Senescence Detection with Beta-Galactosidase Staining ... 12
2.2.6 Immunocytochemistry ... 14
2.3 RESULTS and DISCUSSION ... 15
2.4 CONCLUSION ... 22
3 Stem Cell Isolation from Old and Young Zebrafish Brains and RNA Expression Analysis 23 3.1 INTRODUCTION ... 23
3.2 METHODS ... 26
3.2.1 Dissection and Stem Cell isolation ... 26
3.2.2 Slide Coating ... 27
x
3.2.4 Immunocytochemistry ... 27
3.2.5 Total RNA isolation from cultured neural stem cells ... 28
3.2.6 RNA-Seq Methods ... 29
3.3 RESULTS and DISCUSSION ... 35
3.3.1 RNA-Seq Analysis ... 35
3.3.2 Immunocytochemistry ... 46
3.4 CONCLUSION ... 48
4 Cell Cycle Arrest and Flow Cytometry Analysis of C6 Cells ... 49
4.1 INTRODUCTION ... 49 4.2 METHODS ... 52 4.3 RESULTS ... 55 4.3.1 Flow Cytometry ... 55 4.3.2 Microscopy ... 58 4.4 CONCLUSION ... 59
5 Conclusions and Future Perspectives ... 60
Bibliography ... 63
Appendix A ... 74
Appendix B ... 75
Appendix C ... 76
xi
List of Figures
Figure 1: Immunostaining results of OE4-P2 cells . ... 16
Figure 2: Immunostaining results of OE4-P2 cells . ... 17
Figure 3: Immunostaining results of OE6-P4 and OE7-P1 cells . ... 18
Figure 4: Immunostaining results of OE7-P1 cells . ... 19
Figure 5: Immunostaining results of OE4-P5 cells . ... 19
Figure 6: Immunostaining results of OE4-P5 cells . ... 20
Figure 7: Immunostaining results of OE4-P5 cells . ... 20
Figure 8: Immunostaining results of OE7-P1 cells . ... 21
Figure 9: Color coding of the sample command lines. ... 30
Figure 10: Depiction of the Tuxedo protocol . . ... 31
Figure 11: Command line sample for bowtie2 tool . ... 32
Figure 12: Command line sample for tophat2 tool . ... 32
Figure 13: Command line sample for cufflinks tool. . ... 33
Figure 14: command line sample for cuffmerge tool . ... 33
Figure 15: command line sample for Cuffquant tool. . ... 34
Figure 16: command line sample for cuffdiff tool. . ... 34
Figure 17: Heat map of genes upregulated in old zebrafish neural stem cells . ... 36
Figure 18: Ugt8 expression difference graph . ... 38
Figure 19: fam101b expression difference graph . ... 39
Figure 20: Cx47.1 expression difference graph . ... 40
Figure 21: Crlf1a expression difference graph. . ... 41
xii
Figure 23: si:ch211-181d7.3 expression difference graph ... 44
Figure 24: Immunostaining result of old zebrafish neural stem cells. ... 46
Figure 25: Immunostaining results of old zebrafish neural stem cells. ... 47
Figure 26: Immunostaining results of old zebrafish neural stem cells. ... 47
Figure 27: Depiction of flow cytometer. ... 51
Figure 28: C6 cells’ forward vs. side scatter and count vs. PI graph, no nocodazole treatment. ... 55
Figure 29: Forward and side scatter graph and count vs. PI graph of the 0.1 µg/ml nocodazole-treated C6 cells. ... 55
Figure 30: Forward and side scatter graph and count vs. PI graph of the 0.25 µg/ml nocodazole-treated C6 cells... 56
Figure 31: Forward and side scatter graph and count vs. PI graph of the 0.5 µg/ml nocodazole-treated C6 cells. ... 56
Figure 32: Forward and side scatter graph and count vs. PI graph of the 1 µg/ml nocodazole-treated C6 cells. ... 57
Figure 33: C6 cells after 24 hours of 0.25 µg/ml nocodazole treatment. ... 58
xiii
List of Tables
Table 1: 1 M NaH2PO4 solution recipe ... 13
Table 2: 1 M Na2HPO4 solution recipe ... 13
Table 3: 40 mg/ml X-Gal recipe ... 13
Table 4: 100 mM K-ferricyanide solution recipe ... 13
Table 5: 100 mM K-ferrocyanide solution recipe ... 13
Table 6: 100 mM MgCl2 solution recipe ... 13
Table 7: 2 M NaCl solution recipe ... 13
Table 8: 200 mM Citric Acid recipe ... 13
Table 9: Na-P buffer recipe ... 14
Table 10: SAβG solution recipe ... 14
Table 11: Antibody dilutions used . ... 15
Table 12: Antibody dilutions used ... 28
Table 13: gene_exp.diff file obtained from cuffdiff... 35
1
CHAPTER 1
INTRODUCTION
1.1 Neurogenesis
Neurogenesis is the birth of neurons in the brain. Until recently, it was thought that the brain was not able to produce new neurons. It is now known that new neurons are born in some regions of the brain [1-2]. Hippocampus is a region that neurogenesis occurs even after old age, and it is one of the regions underlying learning and memory abilities [3]. There are studies conducted on the rodent hippocampus focusing especially on learning and memory. In the late 90’s, Gould et al. presented evidence on new neurons being born in the hippocampus and that the new neurons were associated with learning and memory formation [4]. Late-onset Alzheimer’s disease, dementia and the decrease in learning and performing cognitive tasks point to an error in the mechanism of neurogenesis, as one contributing factor. Though it is known that cellular changes throughout the process of aging are responsible for the decline in cognitive abilities, scientists have not arrived at a definite judgment. The evidence suggests that changes in the cellular processes mostly affect cognitive abilities, instead of neuron death [5].
Subpopulations of neural stem cells in the lateral ventricles of the brain give rise to neuroblasts which migrate to the olfactory bulb. This serves the purpose of odor discrimination and new odor memory formation. Another region of the human brain where neurogenesis occurs is the striatum, by tracing the iododeoxyuridine (IdU) carrying neurons of the cancer patients who received IdU treatment. The presence of radioactive uridine positive neurons indicated that the treatment receiving patients were also forming new neurons which were traced to the striatum. Although the functional purpose of the striatal neurogenesis is unknown, the fact that it is less observed in mice than rabbits and monkeys, and increases through evolutionary steps, suggests
2
that it serves the cognitive flexibility. Frisen et al. has shown that the neurogenesis in the adult human hippocampus is crucial for forming new memories and cognitive abilities [6]. In 2014 it was proven that neurogenesis takes place not only in the hippocampus but also in the subventricular zone (SVZ) of the lateral ventricle and the subgranular zone of the dentate gyrus [7]. Another study was done on 71 mammalian species and has shown that the hippocampal neurogenesis and its occurrence frequency varies among species. The neurogenesis rate of the aquatic mammals was found to be the lowest of all, not humans [8].
In cellular aging research, it is important to identify the proliferating and senescent cells. A commonly used method for the identification of proliferating cells is bromodeoxy uridine (BrdU) labeling. BrdU has a thymidine-like structure. Thymidine is incorporated into DNA during regular replication activities. If BrdU, which is structurally similar to thymidine, is added externally, it is incorporated into the DNA. In every cycle of DNA replication, more and more BrdU would be added into the DNA. The BrdU molecules in the nucleus can be visualized by specialized antibodies. This enables the detection of cells that are in the DNA replication stage [9]. BrdU screening experiments comparing 3 and 20 months old mice showed that there is a decrease in neurogenesis in the hippocampal dentate subgranular, up to 90%, and in the subventricular regions of old mice, up to 50% [10]. In the same study, after fibroblast growth factor (FGF)-2 and Heparin-binding EGF-like growth factor (HB-EGF) treatment, neuronal regeneration of old mice increased up to the levels that are seen in young mice; which shows that the aging process is reversible. In another experiment involving electron microscopy and 2 hour period of BrdU marking, it was reported that the stem cells which give rise to new neurons in adult mouse brain are located in the subventricular region and neuron regeneration is impaired with age [11]. Influencing the neurogenesis process by external means and observing the newly arisen neurons have been a topic of interest among researchers. Inhibiting
cortico-3
steroid levels in old animals, insulin-like growth factor (IGF)-I infusion and even exposing animals to a rich environment have been shown to induce neurogenesis [12].
1.2 Stem Cells
Stem cells are grouped in three: Totipotent stem cells, which can give rise to an entire organism; pluripotent stem cells that are capable of giving rise to every cell of the organism, but not the organism itself, multipotent stem cells are can give rise to the every type of cell of the organ it originates from. Adult neural stem cells are multipotent stem cells that can give rise to neurons, glia, and oligodendrocytes [13-14].
Stem cells continue their presence in most of the mammalian tissues throughout the organisms’ life and provide cell-renewal in the case of tissue damage and diseases. It was found that stem cells’ function decrease as the organisms age. Stem cells proliferate quickly during the fetal development in order to support organism growth. Throughout the organism’s young-adulthood, growth rate (proliferation of the stem cells) in the mammalian tissues decrease and most of the stem cells are inactive (quiescent) during this period, while active stem cells divide to maintain homeostasis of the tissue. In adult rats, it was shown that the proliferation rate of the granular progenitor cells in the hippocampus decreases significantly and neural stem cells obtained from old mice (24-26 months) had formed 50% fewer neurospheres compared to stem cells obtained from young mice (2-4 months) [15-16].
Adult neural stem cells can be maintained in cell culture since they keep proliferating in the presence of epidermal growth factor (EGF) and fibroblast growth factor (FGF). Neurospheres can be formed in cell culture and can be differentiated into neurons, astrocytes, and oligodendrocytes [17]. Use of defined neural inducers, co-use of TGF and BMP inhibitors - double SMAD inhibition have been shown to accelerate neural induction. Pluripotent stem cells
4
can be differentiated into dopaminergic, striatal, and glial cells, which can be used for studying potential treatments for Parkinson’s, Huntington’s, and myelin disorders, respectively [18].
1.3 Stem Cells, Cancer and Aging
The quantity of stem cells and their ability to self-renew may not decline with aging, but their capability of making new cells (progenitor and mature, differentiated cells) declines. Self-renewal of the stem cells presents a danger for the organism because the accumulation of DNA damage leads to malignant tissue formation. In older organisms, stem cells increase the expression of tumor suppressor genes and will eventually lead to cellular senescence [19]. Stem cells increasing the expression of tumor suppressor genes and other differences in the regulatory mechanisms of the stem cells suggest the presence of a developmental programming. The stem cells with DNA damage, if not repaired, can pass on to the daughter cells and accumulate. In order to prevent tumor formation, when mutations are detected in stem cells, tumor suppressor mechanisms engage (senescence or apoptosis) and arrest the cell cycle or dispose of the mutant stem cells. The malignant potential of the stem cells and the presence of tumor suppressing mechanisms may be contributing to the aging of the organism by the elimination or inactivation of stem cells. However, the increase in the incidence throughout aging is beyond dispute [20].
Stem cells in the healthy and neoplastic tissue are able to self-renew, and long cellular life causes mutations to accumulate and increase the risk of neoplasia and solid tumor formation. To cure cancer patients, the cancer cells should be eliminated, and the chances of chemotherapy to work decreases as the age of the patient advances, which also causes the stem cells’ functionality to decrease. Thus, the characteristics of stem cells that have acquired mutagenic accumulation should be thoroughly studied and a distinction should be made between healthy stem cells and cancer stem cells [21].
5 1.4 Cell Markers
While normal stem cells have phenotypes that are almost identical to each other and easier to identify, cancer stem cells are complex, different from one tumor to another, and appear to be affected by neoplastic transformation. Single–cell sequencing provided the identification of the different subpopulations of human breast cancer tissue and the opportunity to find out which of the subpopulation is the dominant and metastatic [22]. It should not be overlooked that many phenotypic markers, which allow stem cells to be grouped and isolated, may not be necessary for the functional integrity of stem cells [20]. CD34 is expressed in hematopoietic stem cells and progenitors, and endothelial cells. CD38 is expressed in hematopoietic cells, skeletal muscle, heart muscle and adult prostate cells. Both CD38 and CD44 are involved in the regulation of cell adhesion. CD38 is also involved in cell signaling as an ectoenzyme. CD38 and CD34 are cancer stem cell markers together in hematological cell tumors. In healthy tissue, leukocytes, epithelial, endothelial and mesenchymal cells express CD44. CD44 is also responsible for cell adhesion and migration, as well as cell signaling in healthy tissues. However, it can be used as a cancer stem cell marker for stem cells isolated from breast, colon, gastric, liver and pancreatic tumors. CD24 is expressed in B cells, epithelial cells, and granulocytes, and it is a marker for breast and pancreatic tumor stem cells. CD133 is expressed in the healthy fetal neural and renal stem cells and endothelial stem and progenitor cells. The function of CD133 is not fully understood but it is a cancer stem cell marker for brain, colon, lung, prostate, liver and ovarian tumors. ALDH is another marker that can be found in breast colon and liver tumors with CD133. Astrocytomas, GI tumors, gliomas lung and thyroid cancer stem cells can be distinguished from other stem cells by Hoechst 33342 exclusion [23]. The accurate identification and characterization of cancer cells for diagnosis requires the use of multiple markers. This causes the diagnosis procedure to spread to a long period of time. Hence, the elimination of markers for the identification of cancer cells would save time.
6
The aim of this thesis work was to isolate stem cells from human brain tumor samples, characterize the stem cells, as well as to identify the age-related gene expression differences in zebrafish brain stem cells and translate the findings into humans. To the last aim was to develop a method for the identification of cancer cells in the bloodstream for the detection of solid tumors.
7
CHAPTER 2
Stem Cell Isolation from Human Tumor Samples
2.1 INTRODUCTION
Until the presence of neurogenesis in the central nervous system was proven, it was thought that brain tumors emerged from the dedifferentiation of mature brain cells as a result of cancer-causing genetic modifications. With the new understanding of adult neural stem cells, it became clear that tumors arose from the stem cells that adopted cancer characteristics.
The stem cell theory of cancer states that within a population of cancer cells, only some cells (cancer stem cells) are capable of proliferating and sustaining cancer. cancer stem cells are similar to healthy stem cells that renew and divide to provide homeostasis and survival of a tissue. Hence, cancer cells that are not stem cells cannot cause cancer to spread to other parts of the body, they can only contribute to the mass growth of the tumor. Cancer stem cells have the ability to spread through the organism causing metastases and can also contribute to the relapse of cancer after treatment. Many anti-cancer therapies are used for their ability to shrink the size of the tumor. However, this only targets the mature cancer cells. The remaining cancer stem cell population is able to generate a new tumor. Thus, cancer stem cells should be targeted in anti-cancer therapies [24]. Stem cells are capable of proliferating and producing more stem cells. Stem cells can either divide symmetrically and produce two daughter stem cells or divide asymmetrically and produce one daughter stem cell, which maintains the stem cell reserves at a certain level. The commonly used stem cell identification methods are serial transplantation and in situ labeling. It is difficult to distinguish tumor stem cells from healthy stem cells. For a stem cell to be classified as a tumor stem cell; the xenograft model it forms should have the
8
original tumor characteristics and some of the daughter cells should be able to proliferate without forming single cell tumor clones [25-26].
It was found that, CD133+ cell subpopulation had stem cell characteristics in human brain tumors. Xenograft experiments have shown that the CD133+ brain tumor fraction can initiate tumors in the mouse, and only this fraction of the tumor could initiate tumors. When only 100 of these cells were transplanted, serially transplantable tumors with the original tumors’ characteristics were formed. It was also observed that about ten thousand of the CD133- cells did not develop tumors. CD133+ cells were purified with magnetic beads and transplanted into the frontal lobe of the 6-week-old mouse. In CD133+ xenografts, double staining of CD133 and glial fibrillary acidic protein (GFAP) suggests that tumor cells that have differentiated and undifferentiated cells coexist in the transplanted tumors. In addition, CD133+ cells may also give rise to CD133- tumor cells [22].
In addition to the mutations that induced the formation of the original tumor, mutations occur throughout the metastasis. This causes the metastatic clones to be heterogeneous. It is difficult to identify which mutations support tumor growth and which will cause the formation of metastatic clones. A nuclear receptor, TLX is found in the neural stem cells and has been associated with the stem cells’ and tumor stem cells’ self-renewal abilities. Using GFP as a reporter gene fused to the nuclear receptor tailless (Tlx) promoter sequence, Tlx+ cells were found to be silent in primary tumors. With lineage-testing experiments, Tlx+ cells have been shown to be able to regenerate themselves and produce Tlx- cells. This suggests that Tlx+ cells are brain tumor stem cells (BTC) [27].
Advanced genomic sequencing experiments have shown that cancer in a single patient is a heterogeneous mix, composed of genetically distinct subclones [28]. Non-genetic factors create a hierarchical organization of tumor tissues that serve the long-term clonal upkeep of the neoplasm with the support of a cancer stem cell subpopulation that is capable of self-renewal.
9
Cancer stem cells are found to be resistant to many therapies. The tumor microenvironment is also determinative of cellular functions. Gene expressions specific to cancer stem cells and normal stem cells carry prognostic value for many patients [29]. CD34 and CD38 are used as indicators of human tumor stem cells in acute myeloid leukemia disease. The ability to initiate leukemia is only seen in CD34 + CD38-clones. CD44 + CD24-clones have also been shown to be able to maintain breast cancer clones in the mouse. Each clone harbors cells in different mixes depending on their stem cell characteristics or proliferating ability. Some cells in the mix are in the quiescent state. This serves the functional diversity of the clone.
A recent study showed that silent tumor stem cells survived temozolomide (a chemotherapeutic agent) treatment and turned into a rapidly growing cell population [30]. This study has provided evidence that cancer stem cells exhibit chemotherapy resistance and cytotoxic treatments targeting only dividing cells should be supplemented with therapies targeting quiescent cells. One team, with a 16,000-component library, examined the components that can kill epithelial-mesenchymal transition (EMT) induced cancer stem cells [31]. This study showed that besides paclitaxel, the salinomycin drug could also reduce the tumor seeding ability by a factor of 100. Similar studies have been done for glioblastoma, ovary cancer, breast cancer, and acute myeloid leukemia (AML).
Zhu et al, have made double transgenic mice, by activating Ras with the p53 tumor suppressor gene and by combining the mutations of the neurofibromatosis type 1 (Nf1) gene, which increases astrocytoma formation in humans [32]. With the elimination of tumor suppressor genes, activation of oncogenes such as Ras and Akt in neuronal precursor cells has been shown to increase tumor formation [33]. It has also been shown that excessive production of platelet growth factor-beta (PDGFb) in nestin-positive precursor cells or GFAP+ astrocytes enhances glioma formation [34]. Inhibition of the CDKN2A locus in which INK4a and ARF tumor suppressors are present and high expression of the EGF receptor (EGFR) cause mature
10
astrocytes to form glioma-like lesions after being transplanted into the skull [34]. Genetic subclones should be isolated in order to study cancer stem cells. One method, suggested by Kreso et al., is the transplantation of cells in clonal doses. For solid tumors, it is important to select from different regions of the tumor [23].
Recently, Tomasetti and Vogelstein have reported that replication-associated stem cell mutations explain the relationship between lifetime cancer risk and the number of stem cell divisions in tissues [35]. Telomeric shortening may increase the clonal dominance of mutant stem cells during tissue aging. Telomeres in critical shortness induce loss of chromosomal stability and heterozygosity in yeast. In telomerase knockout mice, unstable chromosomal intestinal stem cells on intestinal epithelium accumulated in the absence of p53, which was the first experimental proof that telomere dysfunction draws a response from p53-dependent mechanisms that prevents tissue loss by the extermination of unstable stem cells [36]. Endogenous expression of telomerase, when combined with damage to DNA repair mechanisms, result in genetically unstable cells, which is a characteristic of human aging [37-38]. Reprogramming mature somatic cells and making them pluripotent is a powerful tool for modeling human diseases. However, the reversal of cellular aging during reprogramming produces induced pluripotent cell (iPSC) which causes problems in modeling for age-related diseases [39].
The aim of this project was to isolate stem cells from human brain tumors obtained from patients and characterize the cells by looking at differential marker expressions. Moreover, differences between tumor types and how the age of the patients potentially affects tumor stem cell marker expression were investigated. Information obtained from this work might provide potential biomarker targets for future drug therapies.
11 2.2 METHODS
2.2.1 Handling and Storage of Tumor Tissue
Tissue storage solution (130-100-008, Miltenyi Biotec) was given in 50 ml falcons to the brain surgeons at Ankara Atatürk Training and Research Hospital. The tissues were put into the storage solutions immediately after the surgery and kept at 4oC. The tissue samples were transferred to UNAM, Bilkent University in an organ cooler with ice. The tissue-containing falcons were put into hood after 70% ethanol disinfection and the remaining portions of the protocol were carried out in a sterile environment to avoid contamination. Ethics permission granted by Ankara University Ethics Committee (11.11.2015) (See Appendix A for a copy of the ethics permission).
2.2.2 Stem Cell Extraction
In order to culture the cells from the tumor tissue, a brain tumor dissociation kit (130-095-939, Miltenyi Biotec) was used. First, the tissues were weighed and cut it into small pieces with a scalpel, then the pieces were washed with HBSS (without Calcium and Magnesium, BE10-543F, Lonza) and transferred into a 15 ml falcon. The samples were centrifuged at 1000 RPM for 2 minutes and the supernatant was discarded. The reagents of the kit were added according to the instructions and incubated in the solution for 15 minutes at 37 oC under slow and continuous rotation. The samples were further dissociated with the help of fire-polished Pasteur pipettes. After incubation and mechanic dissociation, the cell suspension was run through a 70 nm strainer. The sample was centrifuged again at 1000 RPM for 10 minutes and the pellet was resuspended in cell culture medium containing 500 ml DMEM:F12 (1:1) (11330-032, Gibco), 5 ml Penicillin-Streptomycin (15140-122, Gibco), and 50 ml fetal bovine serum (10270, Gibco).
12 2.2.3 Maintaining and Passaging of the Cells
The cell culture medium was changed every 3 days, and after the cells had reached 80% confluency, the cells were passaged by washing with PBS (L0615-500, Biowest) twice, then detaching cells with 0.25% Trypsin-EDTA (25200-056, Gibco) at 37 oC for 5 minutes. To deactivate trypsin, FBS containing cell culture medium was added and the cells were plated in a new cell culture flask in 1:3 dilution. The remaining of the solution was centrifuged at 2000 RPM for 5 minutes and the pellet was stored for protein and nucleic acid isolation.
2.2.4 BrdU treatments
Bromodeoxyuridine (5-bromo-2-deoxyuridine) is a synthetic thymidine analog and is used for the detection of newly synthesized DNA in the proliferating cells [40]. First, a stock solution of 10 mg/ml BrdU (B5002, Sigma) was prepared. One sterile cover slide was placed in each well of a 6-well plate and the cells were plated on the cover slips. The cells were treated with BrdU (1% in complete cell culture medium) and incubated at 37 oC for 24 hours. Prior to
immunostaining procedures, the BrdU-containing medium was aspirated and the wells were washed with phosphate buffered saline (L0615-500, Biowest) twice.
2.2.5 Senescence Detection with Beta-Galactosidase Staining
β-galactosidase staining (SaβG) is a common method for the detection of senescent cells. The method is based on the identification of increased lysosomal β-galactosidase enzyme activity. Cells, under normal conditions, produce the β-galactosidase enzyme in the lysosome. However, in senescent cells lysosomal mass is increased, thus the senescence-associated β-galactosidase can be visualized as a blue stain [41]. The solution used for the assay are described in Tables 1 to 10.
13 1 M NaH2PO4 (stored at 4oC)
4.8 g NaH2PO4
40 ml dd H2O
Table 1: 1 M NaH2PO4 solution recipe
1 M Na2HPO4 (heated up to 40 oC when dissolving)
7.12 g Na2HPO4
40 ml dd H2O
Table 2: 1 M Na2HPO4 solution recipe
40mg/ml of X-gal for stock solution 0.2 g of X-gal
5 ml dimethyl formamide for use in the β-gal assay
40 mg/ml stock solution in DMSO Table 3:40 mg/ml X-Gal recipe
100 mM K-ferricyanide
0.658 g K-ferricyanide 20 ml ddH2O
Table 4: 100 mM K-ferricyanide solution recipe 100 mM K-ferrocyanide
0.844 g K-ferrocyanide 20 ml ddH2O
Table 5: 100 mM K-ferrocyanide solution recipe 100 mM MgCl2
0.406 g of MgCl2
20 ml ddH2O
Table 6: 100 mM MgCl2 solution recipe
2 M NaCl
2.34 g NaCl 20 ml ddH2O
Table 7: 2 M NaCl solution recipe 200 mM Citric Acid
2.85 g trisodium citrate 40 ml ddH2O
Adjust pH to 6 with HCl Table 8: 200 mM Citric Acid recipe
14 Na-P Buffer
10.2 ml 1 M Na2HPO4
29.8 ml 1 M NaH2PO4
adjust pH to 6 with NaH2PO4
Table 9: Na-P buffer recipe SAβG solution 2.4 ml 200 mM citric acid 2.4 ml Na-P buffer 600 µl Ferricyanide 600 µl Ferrocyanide 900 µl 2 M NaCl 240 µl 100 mM MgCl2 300 µl X-Gal Table 10: SAβG solution recipe
Cells were fixed for 15 minutes with cold fixation buffer (FB001, Life Technologies), and incubated in the SaβG solution described in Table 10 for 3 hours at room temperature. Then washed twice with 1X phosphate buffered saline (14040133, Gibco). The assay was followed by the immunocytochemistry protocol described next.
2.2.6 Immunocytochemistry
After BrdU treatment and/or Saβg assay, the cells were washed with PBS twice, then they were fixed in ice-cold methanol for 10 minutes. The methanol was washed away with PBS, then 2N HCl was added to the wells dropwise and kept at 37 oC for 30 minutes, to permeabilize the cells.
HCl was aspirated and the cells were washed with borate buffer (1.9 g Borax in 50 ml PBS) to inactivate HCl. This step was followed by PBS wash. The cells were blocked in goat serum (Sigma) for 30 minutes at room temperature, then were incubated with primary antibody at room temperature for an hour. Anti-NeuN(ab177487, Abcam), neuronal marker, anti-PCNA (ab29, Abcam), proliferation marker, anti-BrdU (5292S, Cell Signaling Technologies), proliferation marker, anti-Sox2 (ab97959, Abcam), neural stem cell marker, anti-TAU
15
(ab64193, Abcam), neuron marker, were the primary antibodies used. The antibodies were diluted in blocking buffer (dilutions are shown in Table 11). The cells were washed in 0.5% PBS-T 5 times in half an hour on shaker. Secondary antibody incubation was for 50 minutes at room temperature (1:1000 diluted in PBS-T both Alexa 488 and 555), and again the cells were washed with PBS-T 5 times in half an hour.
The cells were either incubated with fluorochrome-conjugated or HRP conjugated secondary antibodies. HRP conjugated antibodies, Goat anti-mouse HRP (ab97023, Abcam) and Rabbit anti-goat HRP (ab97100, Abcam) were diluted 1:1000 in PBS-Tween and the cells were incubated for 50 minutes at room temperature. After 30 minutes wash in PBS-T, the cells were treated with DAB chromogen kit (ab64238, Abcam), 1 drop of DAB chromogen was added into 1.5 ml of DAB substrate and the solution was added onto the cells and kept in dark for 10 minutes. The cells were washed with PBS-T once and mounted with ProLong Gold Antifade (P36930, Life Technologies). Antibody Dilutions anti-Neun 1/250 anti-PCNA 1/500 anti-BrdU 1/500 anti-TAU 1/20 anti-Sox2 1/500
Table 11: antibody dilutions used
2.3 RESULTS and DISCUSSION
Not all information was available regarding the patients and each patient was given an “OE#” id. The sample from OE6 was a craniopharyngioma obtained from a 64-year old patient. Craniopharyngiomas are non-malignant tumors that usually form above the pituitary gland. The sample from OE7 was a meningioma, which is a benign intracranial tumor, obtained from a 21
16
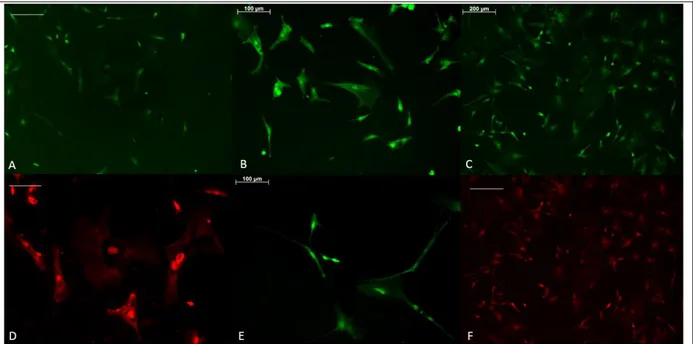
years-old patient. Meningiomas occur in the membrane that covers the brain and the spinal cord. Benign brain tumors can be life-threatening based on its location and size. Thus, the tumor samples that were used came from both young and old patients and were both solid and neoplastic tumors. The immunostaining results are shown in Figures 1 to 8. The presence of BrdU and PCNA signals indicate that the tumors were a mix of both proliferating cells and newly generated cells. NeuN and TAU are mature neuron markers and Sox2 expression is required for the self-renewal and proliferation properties of the stem cells. The absence of Sox2 signaling indicates differentiation of the cells. OE4-P2 cells were passaged 2 times after stem cell isolation protocol. The information about the patient OE4 was withheld.
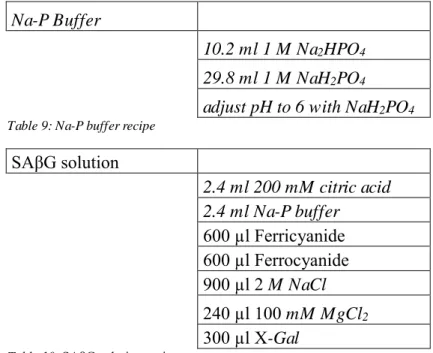
Figure 1: OE4-P2 cells, immunocytochemistry results after stem cell isolation protocol from tumor cells was performed. (a) NeuN staining, scale bar= 50 µm, (b) NeuN staining, same area as (a) with higher magnification, scale bar=20 µm, (c) PCNA staining, scale bar= 200 µm, (d) PCNA staining, same area as (c) with higher magnification, scale bar= 200 µm, (e) PCNA staining, scale bar PCNA staining, scale bar= 100 µm and (f) bright field visualization of the cells in area (e), scale bar= 200 µm.
Due to the absence of epidermal (EGF) or fibroblast (FGF) growth factor, the stem cells differentiated into neurons (Fig. 1a, b). As NeuN labels mature neurons, and BrdU staining indicates newly generated cells, the presence of both signals in a cell indicate newly formed neurons (Fig. 1).
17
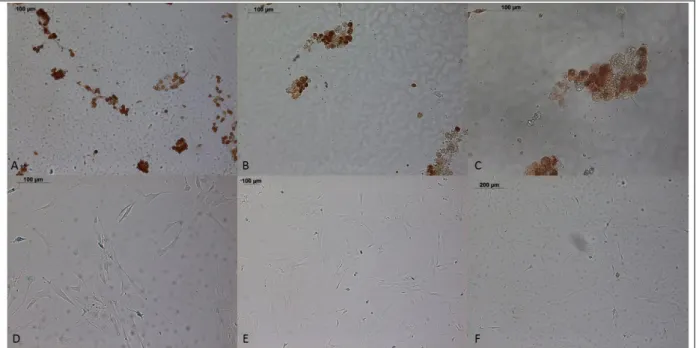
Figure 2: OE4-P2 cells, SAβG and PCNA-HRP immunocytochemistry results in bright field. Scale bar= 100 µm in figures (a), (b), (c), (d) and (e), in (f) scale bar =200 µm.
SaβG protocol stains the senescent cells in blue and PCNA expressing cells can be seen in brown as they are HRP conjugated. In tumor tissues, the cells proliferate uncontrollably, and the higher numbers of proliferating cells were expected. In Fig. 2 the cells with fibroblast-like shapes are stained for senescence whereas sphere-like cells are brown. The figure shows that the differentiated cells are senescent and non-differentiated cells are proliferating.
18
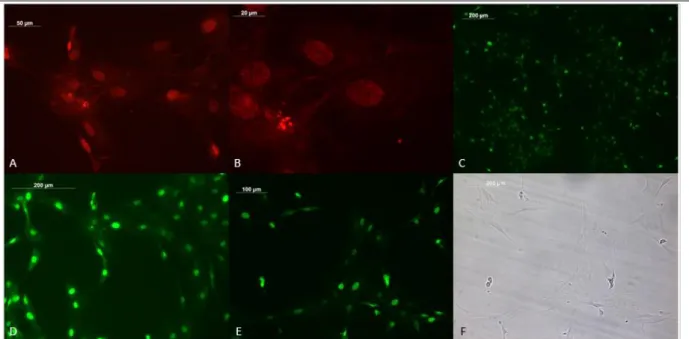
Figure 3: SAβG and immunostaining results. (a, b) OE6-P4 cells stained with BrdU-HRP and (c, d) OE7-P1 cells stained with PCNA-HRP, all scale bars = 200 µm.
A decrease in the total number of cells was observed after passage 4 (Fig. 3). Higher amounts of senescent cells were observed in OE6-P4 cells compared to OE7-P1 cells. The difference in overall cell numbers and senescent cell numbers could be due to the age difference or the differences between tumor types.
19
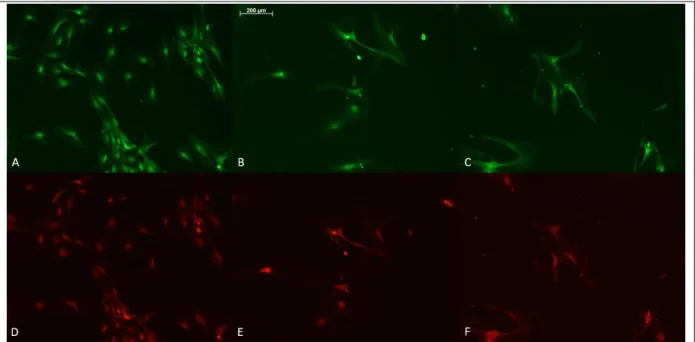
Figure 4: Immunostaining results of OE7-P1 cells. (a) PCNA staining, scale bar = 100 µm, (b) PCNA staining, scale bar= 100 mm, (c) PCNA staining, scale bar = 200 µm, (d) Sox2 staining, scale bar= 100 µm, (e) PCNA staining, scale bar=100 µm, (f) TAU staining of area in (c), scale bar= 200 µm.
OE7-P1 cells express proliferating cell characteristics as well as neural cell characteristics (Fig. 4). In Fig. 4 PCNA labeling (green) indicates proliferating cellsin Fig. 4d, neural stem cells expressing Sox2 are stained and Fig. 4f, TAU stained neurons can be seen. The presence of both TAU and PCNA signals in Fig. 4 c and f indicates the newly formed neurons.
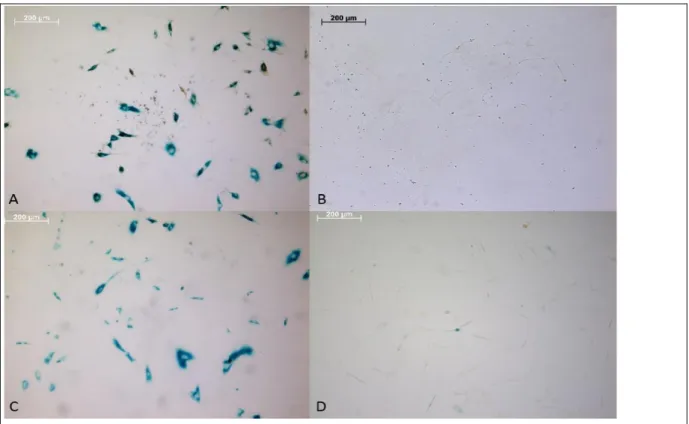
Figure 5: SAβG and BrdU-HRP immunostaining results of OE4-P5 cells. (a, b, f) scale bars = 100µm and (c,d,e) scale bars = 200 µm.
20
Figure 6: OE4-P5 immunocytochemistry results. (a) BrdU staining and (d) Sox2 staining of the same area. (b) BrdU staining, (e) Sox2 staining of the same area, (c) BrdU staining and (f) Sox2 staining of the same areas. Scale bar= 200µm.
Figure 7: OE4-P5 immunostaining results. (a), (b) and (c) PCNA staining, and (e), (f), (g) Tau staining. (c) and (f) are the same area. Scale bar = 200µm.
OE4-P2 cells in Fig. 2 had a higher rate of proliferation than OE4-P5 cells in Fig. 5. SaβG staining for senescent cells is not as distinguishable as it is in Fig. 3 (OE6 and 7 cells). The reason could be the difference in tumor types. It can be speculated that the OE4 patient had a more aggressive sarcoma compared to OE6 and 7. In Fig. 5, BrdU-HRP staining can be seen,
21
suggesting that the cells are continuing to divide. Fig. 6 and 7 a, b, c also showed the cells were proliferating.
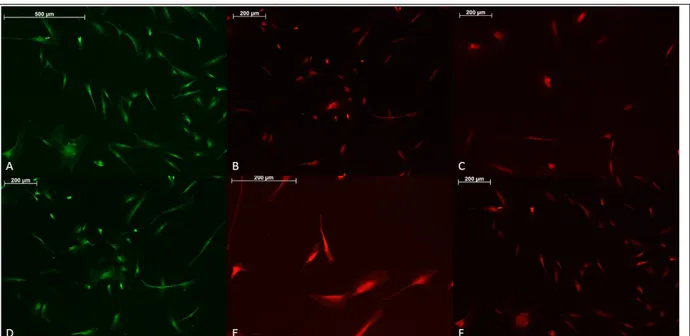
Figure 8: OE7-P1 immunostaining. (a) BrdU staining, scale bar = 500µm, (b) Sox2 staining, scale bar = 200 µm, (c) Sox2 staining, scale bar = 200 µm (d) PCNA staining, scale bar = 200 µm, (e) Tau staining scale bar = 500 µm, (f) Tau staining, scale bar = 200 µm.
OE7-P1 cells express proliferation markers in Fig. 8 a and d as well as neuron and stem cell markers, TAU in e and f and Sox2 in b and c, respectively.
In previous studies, it was found that BrdU, after 24 hours of exposure, decreases expressions of stem cell [42]. However, in Fig. 6 both BrdU and Sox2 positive cells can be seen, indicating that the BrdU was not effective enough to force the stem cells into senescence. This might be an indicator of cancer stem cell dominance in the cell culture. Comparison of Figures 1, 3 and 5 reveals that OE4 still has a higher proliferation rate after 5 passages, whereas OE7 cells have undergone senescence in the first passage. This could indicate that the stem cell reservoir of OE4 is larger than OE6 and 7, or has a higher proliferation rate. In both cases, this could be due to the metastatic nature of the OE4 tumor. It is known that metastatic cells have a higher proliferation rate than benign tumor cells, which may be the cause of the difference between OE4 cells’ higher proliferation and lower senescence rate, and OE6 and OE7 cells.
22 2.4 CONCLUSION
The results show that stem cells were isolated from tumor tissues successfully and the stem cell numbers decreased with each passage. The cell culture obtained consisted of both mature neural cells and neural stem cells. The distinction of cancer and healthy stem cells could not be made based on the markers used in this study because both cancer stem cells and healthy stem cells are capable of self-renewal and proliferation, expressing Sox2. In order to maintain a population dominated by stem cells, EGF and FGF supplements could have been used which would keep the differentiation of stem cells at a minimum and increase the stem cell proliferation.
The original tumor cases should be investigated further for the stem cell properties of each to be understood. For the identification of differences in cancer stem cells caused by age, the variables should be kept to a minimum. The project was not carried out further due to the lack of funding. However, future studies aimed at examining the changes in telomere length are planned in order to identify the link between telomere length and cancer stem cell markers. By investigating the changes in the cancer stem cell markers’ expression levels and find its relationship with telomere length in pathological tissues, a novel indicator for diagnostic use based on marker-telomere length associations could be found.
23
CHAPTER 3
Stem Cell Isolation from Old and Young Zebrafish Brains and
RNA Expression Analysis
3.1 INTRODUCTION
Zebrafish is an ideal model organism to study human disease states, especially those regarding aging deficiencies. Zebrafish live up to 3 years in average and like humans, they age gradually [43–45]. Their genome is similar to human genome; for many human genes, a zebrafish ortholog has been identified [46]. Cognitive decline is observed with aging and it is under the influence of genetic and environmental factors [47]. Zebrafish have a brain that is comparable to a human’s; forebrain, midbrain (consisting of the cerebellum, telencephalon, diencephalon) and hindbrain parts are established. They have an integrated nervous system and exhibit higher level processes such as memory and social behavior [45]. Neurogenesis in the human hippocampus, which is responsible for memory and learning has a comparable structure in the zebrafish brain which is the lateral pallium region [48].
Biological aging of the cells trigger the activation of cyclin-dependent kinase inhibitors (CDKI) and cause a cell cycle arrest. Senescent cells are stopped at the G1 phase of the cell cycle and do not go through S phase. For the cells to move to S phase, in order to replicate their DNA, E2F factors should be released from their inhibitory partner retinoblastoma protein (pRb). The release of E2F factors requires the phosphorylation of pRb by cyclin-dependent kinases (CDKs), especially CDK4/6 and CDK2. CDKIs have an active role in cellular aging and control the CDK’s regulation. P16INK4a and p15INK4b inhibit CDK4/CDK6 and CDK2 is inhibited by
24
Arslan-Ergul et.al. have conducted a microarray analysis of samples from varying ages of zebrafish. In the two-group study; young (7.5 and 8.5 months old) and old (31 and 36 months old); the brains were removed as a whole and whole RNA isolation was performed. Following RNA isolation, microarray experiments were conducted in the attempt to find out differentially expressed elements between young and old zebrafish brain and validate the role of these elements during aging among individual animals. Next, gene ontology analysis was carried out to determine whether the differentially expressed genes were making a meaningful group. Old and young, and female and male ontology comparisons among genes that had significant expression differences were taken into consideration. Genes involved in brain development, angiogenesis, neurogenesis, cell differentiation and other processes were found to be significantly differentially expressed between groups. It was found that gene groups implicated in neurogenesis differed in expression levels, significantly, between young and old brains. Furthermore, the same gene group was differentially expressed between male and female fish; and the gene enrichment was in favor of young group (in the young-old comparison) and male group (in male-female comparison). Even among the genes functioning in bigger cellular processes (containing more than 9000 genes involved), the results were in favor of old and male groups [50].
In order to visualize neurogenesis in the fish brain, a BrdU staining procedure for zebrafish brain tissue sections has shown that the number of newly born neurons in the old zebrafish brain was lower than young zebrafish. The decrease in neurogenesis was more evident in the diencephalic ventricular zone within the telencephalon [51]. A recent study has shown that throughout aging, neurogenesis decreases significantly in zebrafish. A comparison between 3-months old and 6 3-months old zebrafish indicated a dramatic decrease in the formation of new neurons in the 6 months old group. Still, neurogenesis was demonstrated to be present in even 20-months old fish [52].
25
In the adult zebrafish brain, radial glial cells are capable of self-renewal, proliferation and producing neurons. There are two types of radial glial cells; type one cells are BrdU-, PCNA-, GFAP+, S100β+ and BLBP+, and type two cells that are BrdU+, PCNA+, GFAP+, S100β+, and BLBP+. Type one radial glial cells are in a quiescent state, they do not proliferate. Type two radial glial cells proliferate and differentiate to type 3 cells (neuroblast). Newborn neurons mostly settle in the subventricular zone during the development of the central nervous system. However, when neurogenesis is induced by brain damage, the newborn cells can migrate long distances to repair the damaged tissue [53]. The pathway that signals the cells to migrate is still unknown. Although it is known that the activation of stem cells decrease throughout aging, it is unknown which stem cell types decrease. It is believed that aging affects different stem cell types in different ways and neurogenesis continues in the regions that are related to certain brain functions [54]. In a more recent study, stem cells were isolated from the zebrafish brainstem. It was observed that the stem cells obtained were mitotically active but neuronal differentiation required the cells to escape cell cycle. This method enables the investigation of stem cells’ interactions and different stem cell types of the zebrafish [55].
Within the scope of the project “Stem Cell Isolation from the Aging Zebrafish Brain”,the main goal was to isolate and characterize the stem cells of zebrafish brain, and compare the young and old zebrafish neural stem cells’ in terms of expressed markers. Neural stem cell culture was used to answer the following questions: 1) Do stem cells enter senescent state? 2) Do stem cells’ phenotypic and metabolic properties change throughout aging? 3) Do the stem cell reserves in the brain decrease with age? The secondary goal was to identify the changes in gene expression in neural stem cells. Gene expression analysis from whole transcriptome sequencing was performed in order to find out how stem cells are affected by the global gene expressions, and which gene groups’ activities increase or decrease through aging.
26 3.2 METHODS
3.2.1 Dissection and Stem Cell isolation
The fish were separated into two groups: young and old. The young fish were between 7-8 months old and the old fish were 25-28 months old. For total RNA extraction protocol, each group consisted of 5 fish, both wild-type AB strain. For immunocytochemistry protocol, the old group contained 3 fish, while the young group contained 9. The fish were anesthetized in ice cold water then decapitated. The animal protocol for this study was approved by the Local Animal Ethics Committee of Bilkent University (HADYEK) (see Appendix B for the copy of the ethics permission).
The heads of the fish were washed with 70% EtOH, the brains were put in ice cold L15 medium (21083-027, Gibco) containing 1% Penicillin-Streptomycin (15140-122, Gibco). Macs neural tissue dissociation kit (130-093-231, Miltenyi Biotec) was used for the isolation of neural stem cells. The solutions and enzymes were used according to the manual. The brain tissues were submerged into the solutions for 25 minutes at 28 oC with continuous rotation, then the brain tissue was cut into smaller pieces with the help of a fire polished pipette by pipetting up and down 20 times. Then the tissue pieces were pipetted with a smaller glass Pasteur pipette for 20 more times. The cell suspension was then put through a 70 µm cell strainer on a 15 ml falcon tube. The strainer was then rinsed with L15 containing 1% Pen-Strep and 5% FBS (washing medium) to collect the remaining cells. Then the solution was centrifuged at 1300 rpm for 10 minutes. The supernatant was discarded and the pellet was resuspended in washing medium and centrifuged at 1200 RPM for 8 minutes. The pellet was resuspended in 15 ml L15 containing 150 µl Pen-Strep, 750µl FBS, 3 µl 0.1 mg/ml Epidermal Growth Factor (PHG0314, Gibco) and 3 µl 0.1 mg/ml Fibroblast growth factor (PHG0024, Gibco). The cells were plated
27
in Laminin and Poly-D-Lysine coated slides for immunocytochemistry and for total RNA isolation experiments the cells were plated in bio-coated CellBind flasks (3290, Corning). The plates were kept in a non-CO2 incubator at 28 oC. All of the cell culture medium was replaced
the day after the cells were plated, half of the medium was changed on the second day [51].
3.2.2 Slide Coating
10 µg/ml poly-D-lysine (P7280-5mg, Sigma) was prepared and added directly to the slides and left in cell culture hood overnight at room temperature. Then the solution was removed and the slides were washed with water 3 times. The slides were air-dried and once completely dry, they were coated with 5 µg/ml laminin(23017-015, Gibco) in DMEM:F12 (11330-032, Gibco).
3.2.3 BrdU Treatment
Young fish were transferred from their tanks in the fish facility and placed in system water containing 30 µg/ml BrdU for 4 hours. Then anesthetized in ice-cold water and decapitated immediately after. Old fish were put into a separate tank with system water and ice cubes to keep the temperature around 12 oC. The fish were anesthetized and injected with 15 µl of 10 mg/ml BrdU intraperitoneally. After the injection, the fish were placed into another tank with system water at 28 oC and sacrificed after 4 hours. The young and old fish were treated
differently due to the difference in their sizes and the difficulty in handling young fish and performing intraperitoneal injection. Stem cell isolation protocol was carried out following the decapitation of the fish.
3.2.4 Immunocytochemistry
First, the cells were washed with PBS twice, then they were fixed in ice-cold methanol for 10 minutes. The methanol was washed away with PBS, then 2 N HCl was added to the wells
28
dropwise and kept at 37 oC for 30 minutes, to permeabilize the cells. HCl was aspirated and the cells were washed with borate buffer (1.9 g Borax in 50 ml PBS) to inactivate HCl. This step was followed by PBS wash. The cells were blocked in goat serum (Sigma) for 30 minutes at room temperature, then were incubated with primary antibody at room temperature for an hour. Anti-NeuN (ab177487, Abcam), neuronal marker, anti-Sox2 (ab97959, Abcam), neural stem cell marker, anti-PCNA (ab29, Abcam), proliferation marker, anti-vimentin (ab8978), intermediate filament marker in radial glial cells, anti-Islet 1 (ab209977, Abcam), neural stem cell marker and anti-BrdU (5292S, Cell Signalling Technologies), proliferation marker, were the primary antibodies used. The antibodies were diluted in blocking buffer according to the Table 12. The cells were washed with 0.5% PBS-T 5 times in half an hour on shaker. Secondary antibody incubation was for 50 minutes at room temperature, Alexa 555 and 488 were used and diluted to 1:1000 in PBS-T. The cells were washed with PBS-T 5 times in half an hour. The coverslips were mounted on slides with ProLong Gold Antifade (P36930, Life Technologies).
Antibody dilutions anti-Neun 1/250 anti-PCNA 1/500 anti-BrdU 1/500 anti-Vimentin 1/100 anti-Islet 1/50 Anti-Sox2 1/500
Table 12: Antibody dilutions used
3.2.5 Total RNA isolation from cultured neural stem cells
Three to five days after the stem cells were plated, the cells were detached from the flask using StemPro Accutase (A11105-01, Gibco). RNeasy Mini Kit (74104, Qiagen) was used for the isolation of total RNA, the instructions of the kit were followed. The protocol consisted of the
29
following steps: lysis of the cells and protein contaminant reduction with β-mercaptoethanol (β-ME), precipitation of genetic material with 70% ethanol, column purification of RNA (discarding the DNA), washing and RNA elution. Next, in order to purify the RNA samples from the contaminating DNA, DNase treatment was performed with Ambion Turbo DNA-free Kit (AM1907, Ambion). Isolated and DNase-treated RNA samples’ concentrations were measured with NanoDrop™ 2000.
3.2.6 RNA-Seq Methods
RNA sequences isolated (by Begun Erbaba) were sent to TUBITAK MAM and were sequenced using Illumina HiSeq 2500 system. Sequence data received was analyzed for expression differences between samples.
3.2.6.1 System Specifications
CPU:Intel i5-3337U
GPU: NVIDIA GeForce GT740m
RAM: 8 GB
HDD/SSD: SeaGate 500GB 5400RPM
OS: Ubuntu 16.04
3.2.6.2 Preprocesses
For checking the quality of the RNA sequence data obtained from TUBITAK, FastQC analysis program was run. Fastqc does raw sequence data quality checks and provides information on whether the data is contaminated with adapter sequences or has any problems that should be considered and corrected before the next steps of RNA-sequence analysis.
30
The zebrafish (Danio rerio) genome, version GRCz10, was downloaded from Ensembl database [56]. The folder downloaded contained soft masked and repeat masked fasta files as well as non-masked files of each chromosome of zebrafish. Since “masked” reads mean that the repetitive parts of the reference genome are masked, the bases are converted to “N”s, thus if the RNA to be aligned to the reference genome cannot be aligned to the repeats resulting in a false mapping of the reads. Thus, the unmasked genome files were used. In order to minimize the time consumed by running Bowtie2 separately with each genome file, fasta files of each chromosome were concatenated. The concatenation process takes short time with popular Linux command: “cat”. Fig. 9 shows the color coding in sample command lines from Fig. 9 to 16, and the sample command line used for the “cat” function.
Figure 9: Color coding of the sample command lines and concatenation of genome containing .fasta files into one .fasta file
31 3.2.6.3 RNA-Seq Analysis
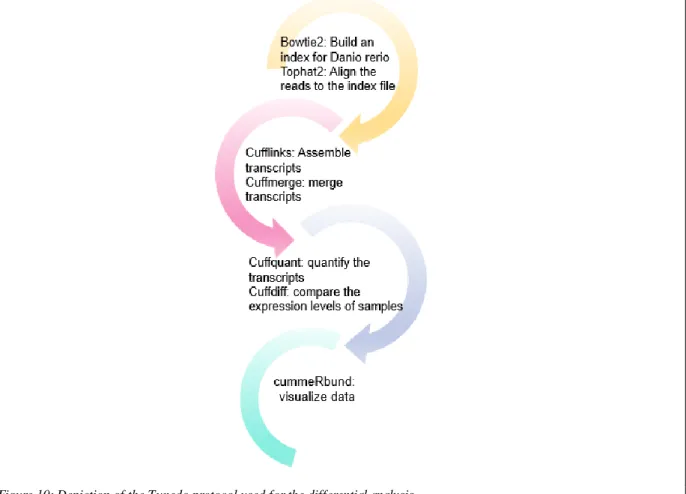
Figure 10: Depiction of the Tuxedo protocol used for the differential analysis.
The pipeline used in this study is depicted in Fig. 10. Bowtie2, which is the first step of the pipeline, is a fast, short read aligner that maps the FASTQ reads to a reference sequence. Transcriptome or reference genome could be used for aligning the reads. However, transcriptome alignment may exclude transcripts that are not annotated. Thus, I mapped the reads to the reference genome and used the “build” command of BowTie2 to create an index from the genome file obtained from the Ensembl database. Since our reads vary in length, a short read mapper was not preferred, TopHat was used instead for the alignment. Bowtie2 takes the concatenated fasta file that contained the reference genome of zebrafish as an argument and it builds the index folder containing .bt2 files.
32 Figure 11: Command line sample for bowtie2 tool
TopHat2 was used to align reads from each group (old and young) to the reference genome. It is used for aligning reads to the reference genome. Transcripts contain introns and may span exon-exon junctions. Hence the tool for aligning the RNA-Seq reads must be capable of identifying exon-exon junctions by splitting reads. TopHat2 utilizes Bowtie2 which identifies split reads by looking for “coverage islands”. Coverage islands are regions with read coverage, the tool looks for continuous regions or closely related regions with coverage that are separated by non-coverage regions that correspond to introns or untranscribed regions and tries to find if the coverage regions are transcripts of the same gene.
Figure 12: Command line sample for tophat2 tool
For alignment, TopHat2 takes the output of Bowtie2, the index file, and the reads as inputs (Fig. 12) and gives .bam files as output. The output files contain mapped and unmapped reads as well as deletions and insertions. The alignment process with TopHat2 takes longer to align reads to the reference genome than Bowtie2 takes for building an index.
Next, Cufflinks was used. Cufflinks assembles transcripts and estimates fragments per kilobase million (FPKM). A gene may contain more than one transcript that are of multiple exons. Multiple transcripts of the gene share exons, thus the reads align probabilistically (different isoforms of a gene have different expression values). FPKM is a unit of measurement where
33
the counts are normalized for sequencing depth and gene length. First, the total count of a sample is divided by a million, for the “per million” scaling. Then the read count of a certain gene is divided by the scaling factor obtained in the previous step, this gives the “fragments per million” (FPM) value. Finally, the FPM value is divided by the length of the gene, in kilobases, resulting of the normalized data of FPKM. Cufflinks was given aligned old or young RNA-seq files obtained from TopHat2 and annotation file downloaded from Ensembl database (.gtf file), and it output 2 .gtf files, and 2 fpkm files.
Figure 13: Command line sample for cufflinks tool.
When dealing with multiple RNA-seq samples, combining the data into a set of transcripts is a helpful step before performing comparative analysis. Replicates of each condition (young and old) are aligned to the reference transcriptome annotation (.gtf file) and merges all of the samples assemblies. This way Cuffmerge rescues less expressed genes that may not have full reconstruction in each replicate. Cuffmerge takes transcripts.gtf files obtained from Cufflinks for each sample, annotation .gtf file from ensemble database and reference genome .fasta file and returns a merged.gtf file.
Figure 14: command line sample for cuffmerge tool, the use of this tool is optional.
Cuffquant provides quantification of gene expression levels. The output of TopHat (.bam file) and merged.gtf file obtained from cuffmerge is fed into cuffquant, the output (.cxb) file is used in the following step cuffdiff for further processing.
34 Figure 15: command line sample for Cuffquant tool.
Cuffdiff is the tool that compares the expression levels of genes from different samples. Merged.gtf file and cuffquant output files for each sample is given to cuffdiff as an input and the results are output in FPKM tracking files.
Figure 16: command line sample for cuffdiff tool.
The final step of the differential expression analysis is the visualization of the data. CummeRbund was used to analyze the results of RNA-Seq data from the output of cuffdiff. CummeRbund stores data from the output files of cuffdiff analysis in a local SQLite database in order to speed up access to certain features contained such as isoforms, genes CDS. The data elements can be manipulated through RSQLite package enabling fast access and search in upcoming analyses [57].
35
3.3 RESULTS and DISCUSSION
3.3.1 RNA-Seq Analysis
Table 13: gene_exp.diff file obtained from cuffdiff output folder listing the comparison of genes between sample groups, young and old, expression values in FPKM and significance levels (yes or no).
Cuffdiff compared 31077 genes between samples and found that the expression levels of 34 genes are significantly different between samples (Table 13). However, some of the expression values were 0 which indicates the absence of data and a numerical significance cannot be assigned to the statistical significance of the expression comparison. Hence the genes with 0 FPKM values in either sample were omitted (Table 14).
36
Table 14: gene_exp.diff file after the genes with 0 FPKM values were deleted from the list. Sorted according to q-values.
Figure 17: Heat map of some genes upregulated in old zebrafish neural stem cells
Fig. 17 shows the heat map generated with cummerbund, an R package. The first 9 genes that are differentially expressed are depicted in the figure. FABP2, Tuft1a, Cd82a, U3, fam101b,