The Role of Ocular Response Analyzer in Differentiation of Forme
Fruste Keratoconus From Corneal Astigmatism
Ahmet Kirgiz,
M.D., Sevil Karaman Erdur,
M.D., Kursat Atalay,
M.D., and Ceren Gurez,
M.D.Purpose: To determine the diagnostic accuracy of corneal biomechanical factors in differentiating patients with forme fruste keratoconus (FFKC) from astigmatic and normal cases.
Methods: A total of 50 eyes with FFKC, 50 with astigmatism and 50 normal eyes, were included in this study. All patients had a detailed ophthalmologic examination including slit-lamp evaluation, Goldmann tonometry, indirect fundoscopy, topography by Scheimpflug imaging biomicroscopic anterior and posterior segment examination, and corneal biomechanical and intraocular pressure evaluation with ocular response analyzer (ORA).
Results: All topographic findings were statistically significant among the three groups (P.0.05). Although there was no statistically significant dif-ference in the corneal-compensated intraocular pressure (IOPcc) among the three groups, the Goldmann-correlated intraocular pressure (IOPg), corneal hysteresis (CH), and corneal resistance factor (CRF) were statistically sig-nificantly lower in the FFKC group, compared with the other groups (P,0.001). There were no statistically significant difference in the IOPg, CH, and CRF between astigmatism and control groups (P¼0.99, 0.79, and 0.86, respectively). The area under the receiver operating characteristic (AUROC) curve was greater than 0.85 for IOPg (0.80), CH (0.85), and CRF (0.90) for discriminating between FFKC and controls; whereas the AUROC was greater than 0.85 for IOPg (0.80), CH (0.79), and CRF (0.85) for discriminating between FFKC and astigmatism groups.
Conclusion: Based on our study results, in differentiation of patients with FFKC from normal control cases or astigmatic patients, corneal bio-mechanical parameters play a role particularly in patients with suspicious results. We suggest using ORA in combination with corneal topography for better and more accurate diagnosis of FFKC.
Key Words: Corneal biomechanical properties—Corneal hysteresis— Forme fruste keratoconus—Anterior segment parameters—Astigmatism— Ocular response analyzer.
(Eye & Contact Lens 2019;45: 83–87)
K
eratoconus is a progressive, noninflammatory, usually bilat-eral corneal ectasia characterized by corneal thinning and protrusion.1 Most of the cases can be diagnosed with cornealtopography because of the presence of a typical topographic
pat-tern.2 However, in some cases, mild changes in keratoconic
cor-neas cannot be detected using the most sophisticated topographic modalities. The main problem is the detection of these subclinical forms that may be indicative of early stage keratoconus. Although there is no establish consensus on the definition of this condition, it refers to suspicious keratoconus or forme fruste keratoconus (FFKC).3,4Although FFKC often has a keratoconus-like
asymmet-ric bow tie pattern as assessed by corneal topography, astigmatic eyes may also have this pattern rather than symmetric pattern.5
Therefore, the corneal steepening and astigmatism formation may be found in the topographic maps of both FFKC and astigmatism cases. Although all astigmatic patients do not have keratoconus, distinction of patients with FFKC and astigmatism may be chal-lenging.6In refractive surgery, diagnosing patient with FFKC is
critical, as these patients are at risk of ectasia.7–9In addition, early
diagnosis of keratoconus is essential in follow-up and treatment of these patients.3
Ocular response analyzer (ORA) (Reichert Ophthalmic Instru-ments, Buffalo, NY) is a noninvasive device that measures corneal biomechanics and strength. It is used to determine the corneal biomechanical properties in vivo, through air pulse pressure to the central cornea with inward and outward movements.10,11In
partic-ular, pathologies such as keratoconus characterized by weakened corneal structure have shown to impair corneal biomechanics.12–14
Because keratoconus is a progressive disease, biomechanical prop-erties of corneas with FFKC may also show early additional diag-nostic clues. In addition, the data about the role of ORA in differentiation of FFKC from normal or astigmatic eyes are limited in literature.
In this study, we aimed to determine the diagnostic accuracy of corneal biomechanical factors in differentiating patients with FFKC from astigmatic and normal cases.
MATERIALS AND METHODS
In this prospective study, a total of 150 eyes of 150 patients including, 50 with FFKC, 50 with astigmatism, and 50 normal eyes, between November 2015 and July 2016 at Bagcilar Education and Research Hospital, Istanbul, Turkey, were investigated. The study was approved by the local ethics committee and was conducted in accordance with the principles of the Declaration of Helsinki. Written informed consent was obtained from each participant.
In this study, three groups (astigmatic, FFKC, and control) were compared. The patients having a topographic cylindrical value of greater than 0.75 diopters in topographic analysis were included in the astigmatism group. The patients who were diagnosed with “sus-picious keratoconus” (defined as an anterior asymmetry index [SIf]
From the Department of Ophthalmology (A.K., K.A., C.G.), Bagcilar Training and Research Hospital, University of Health Sciences, Istanbul, Turkey; and Department of Ophthalmology (S.K.E.), Istanbul Medipol University, Istanbul, Turkey.
The authors have no funding or conflicts of interest to disclose. Address correspondence to Sevil Karaman Erdur, M.D., Department of Ophthalmology, Istanbul Medipol University, Istanbul, Turkey; e-mail: [email protected]
Accepted July 1, 2018.
of .0.50 and/or a posterior asymmetry index [SIb] of .0.30 in combination with corneal thinning) with the topography device, those having mild steepening on topography, and no clinical signs of keratoconus such as Vogt striae, Fleischer rings, and ruptures in Bowman were included in the FFKC group. Normal eyes were selected from the patients who were admitted to the ophthalmology department for routine controls without any symptoms and who had completely normal topographic results. Exclusion criteria were as follows: corneal scarring or severe dry eye, a history of corneal surgery, or pregnancy or breastfeeding during the course of the study.
All patients had a detailed ophthalmologic examination includ-ing biomicroscopic anterior and posterior segment examination, topography by Scheimpflug imaging (Sirius, Costruzione Stru-menti Oftalmici, Florence, Italy), corneal and intraocular pressure (IOP) evaluation using a biomechanical waveform analysis device (Ocular Response Analyzer, software version 1.02, Reichert, Inc.), and Goldmann tonometry.
Anterior segment parameters were obtained using a rotating Scheimpflug camera, Sirius, a topography device consisting of a combination of two rotating Scheimpflug cameras, and a Placido disk. All measurements were in compliance with the manufac-turer’s instructions by a single trained examiner. Maximum kera-tometry (K) value (Kmax), average K value (avgK), topographic cylindrical value (topographic astigmatism) (Cyl), symmetry index front (SIf), symmetry index back (SIb), central corneal thickness (CCT), and thinnest point of the cornea were recorded from the
topography data generated by the Scheimpflug system. The Kmax was defined as the steepest point of the anterior corneal surface. The SIf was the symmetry index of the anterior curvature and defined as the difference of the mean anterior tangential curvature of two circular zones centered on the vertical axis in the inferior and superior hemispheres. The SIb was the symmetry index of the posterior curvature and defined as the difference of the mean pos-terior tangential curvature of two circular zones centered on the vertical axis in the inferior and superior hemispheres.
The ORA was used by a single examiner. Minimum four measurements were performed in each eye. The highest waveform score was recorded for the statistical analysis.11The ORA reports
two IOPs: Goldmann-correlated IOP (IOPg) and corneal-compensated IOP (IOPcc). Corneal hysteresis (CH) and corneal resistance factor (CRF) were also evaluated with ORA. Two dif-ferent bidirectional (inward and outward) applanation pressure measurements are recorded by the ORA device, and the difference between these two pressures is the CH, which is an indicator of corneal viscosity. Corneal resistance factor is considered as the indicator of the overall resistance of the cornea, which is mainly associated with the elastic properties of the cornea.
Statistical Analysis
Statistical analyses were performed using the Number Cruncher Statistical System (NCSS) 2007 statistical software (NCSS, LLC, Kaysville, UT). Descriptive statistics were expressed as mean and SD. One-way analysis of variance was used to compare the groups, whereas the Tukey variance analysis was performed for the subgroup analyses, and the chi-square test was performed for the qualitative data. For the diagnosis of FFKC, the area under the curve (AUC) was calculated using the receiver operating
TABLE 1. Topographic Findings of the Subjects
FFKC Group (n:50), Mean6SD Astigmatism Group (n:50), Mean6SD Control Group (n:50), Mean6SD Pa Thinnest point (mm) 476.9629.25 530.3635.04 552.46632.34 ,0.001 CCT (mm) 488.66630.46 556.42638.31 579.72637.62 ,0.001 Kmax (D) 48.0561.77 47.1362.16 44.1361.31 ,0.001 avgK (D) 44.4761.21 44.7261.97 42.9861.17 ,0.001 Cyl (D) 2.2761.45 2.661.05 0.4560.19 ,0.001 SIf 1.860.74 0.7060.45 0.3360.26 ,0.001 SIb 0.5360.28 0.1360.08 0.1060.07 ,0.001
aOne-way ANOVA and post hoc Tukey test.
CCT, central corneal thickness; Cyl, topographic cylindrical value; FFKC, forme fruste keratoconus; avgK, average keratometry value; Kmax, maximum keratometry value; SIb, symmetry index back; SIf, symmetry index front.
TABLE 2. Comparison of Ocular Response Analyzer Findings Among Groups FFKC Group (n:50), Mean6SD Astigmatism Group (n:50), Mean6SD Control Group (n:50), Mean6SD Pa IOPcc (mm Hg) 14.3362.45 15.7262.89 15.2963.6 0.06 IOPg (mm Hg) 11.2662.96 15.0663.19 15.1363.47 ,0.001 CH 8.5661.39 10.2961.51 10.4761.2 ,0.001 CRF 7.5661.71 10.1961.76 10.3661.2 ,0.001 a
One-way analysis of variance and post hoc Tukey test. CH, corneal hysteresis; CRF, corneal resistance factor; FFKC, forme fruste keratoconus; IOPcc, corneal-compensated intraocular pressure; IOPg, Goldmann-correlated intraocular pressure.
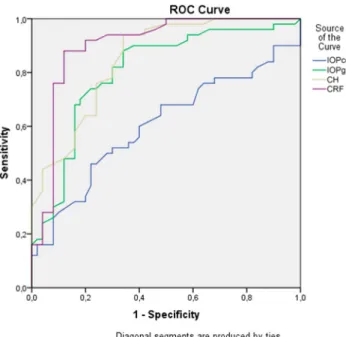
FIG. 1. Receiver operating characteristic (ROC) curves drawn for the ORA findings of control-FFKC groups. CH, corneal hysteresis; CRF, corneal resistance factor; FFKC, forme fruste keratoconus; IOPcc, corneal-compensated intraocular pressure; IOPg, Goldmann-correlated intraocular pressure; ORA, ocular response analyzer.
characteristic (ROC) curves for ORA variables, and sensitivity, specificity, positive and negative predictive values, and odds ratio were determined. A P value of#0.05 was considered statistically significant.
RESULTS
A total of 150 eyes of 150 patients were included in this study. There was no significant difference in the mean age and sex of the study groups (Table 1). The topographic data of the study partic-ipants are summarized in Table 1. All topographicfindings were statistically significant among the three groups. In the FFKC group, the CCT was significantly lower, whereas symmetry indices back and front were significantly higher, compared with normal and astigmatism groups. When astigmatism and FFKC groups were compared separately, there was a statistically significant difference, except avgK (P¼0.70) and Cyl (P¼0.27).
The ORAfindings of the three groups are summarized in Table 2. Although there was no statistically significant difference in the IOPcc among the groups, the IOPg, CH, and CRF were statistically
significantly lower in the FFKC group, compared with other two groups (P,0.001). When control and astigmatism groups were com-pared separately, there was no statistically significant difference in the IOPg (P¼0.99), CH (P¼0.79), or CRF (P¼0.86).
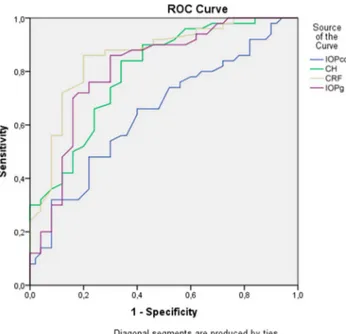
The ROC curves were drawn for the ORAfindings of control-FFKC (Fig. 1) and astigmatism-control-FFKC groups (Fig. 2), and the AUC values were calculated. Accordingly, in differentiation of FFKC patients from control or astigmatic cases, the IOPg, CH, and CRF results were above 0.80. The ROC curves were analyzed to define the best cutoff values having the highest sensitivity and specificity results (Tables 3 and 4).
DISCUSSION
In this study, we evaluated the diagnostic accuracy of ORA parameters in differentiation of FFKC from astigmatic or normal eyes. We found that IOPg, CH, and CRF were statistically significantly different in the FFKC group than the astigmatic and control patients. In the ROC curve analysis, the AUC for the IOPg, CH, and CRF was also statistically significant in differentiation of FFKC from both astigmatic and control patients. To the best of our knowledge, this is thefirst study in literature reporting that ORA and corneal biomechanical factors may be useful in differentiation of patients with astigmatism and FFKC.
The corneal steepening and astigmatism formation are the characteristics of both simple astigmatism and FFKC. Our topographical data also support this condition with significantly increased Cyl and Kmax values. However, the CCT was signi fi-cantly lower in the FFKC group, compared with normal and astigmatism groups. According to the results of ORA, in patients with FFKC, CH and CRF were lower than astigmatism and control groups. These results support the findings of previous reports suggesting that as the elasticity and the resistance of cornea decrease, protrusion and low tensile strength may occur, even at the very early phases.1,15However, in the astigmatism group, the
cor-neal skeleton was preserved, which is helpful in differentiation of FFKC and astigmatism based on the biomechanical features.
Although the diagnosis of keratoconus depends on the topo-graphic findings, the ability of the ORA to distinguish between normal eyes and eyes with keratoconus was also studied pre-viously.10Shah et al.16reported significantly decreased CH, CRF,
and CCT values in patients with keratoconus, compared with the control cases. Fontes et al.17also reported that CH and CRF were
statistically lower in keratoconic eyes than that of healthy thin cor-neas with a CCT of ,505 mm; however, they found very low sensitivity and specificity for discriminating the groups. Wolffsohn et al.12reported that additional corneal biomechanical metrics might
improve the detection and severity prediction of keratoconus
FIG. 2. Receiver operating characteristic (ROC) curves drawn for the ORA findings of astigmatism-FFKC groups. CH, corneal hyster-esis; CRF, corneal resistance factor; FFKC, forme fruste keratoconus; IOPcc, corneal-compensated intraocular pressure; IOPg, Goldmann-correlated intraocular pressure; ORA, ocular response analyzer.
TABLE 3. Comparison of Area Under the Receiver Operating Characteristic Curve, Selected Parameter Cutoff, Sensitivity, and Specificity for Ocular Response Analyzer Variables Between Forme Fruste Keratoconus and Control Groups
Parameter AUROC SE P Sensitivity Specificity Cutoff 95% CI
IOPcc (mm Hg) 0.60 0.058 0.076 60 60 14.45 0.49–0.71
IOPg (mm Hg) 0.80 0.045 ,0.001 82 70 11.75 0.71–0.89
CH 0.85 0.037 ,0.001 76 76 9.45 0.77–0.92
CRF 0.90 0.033 ,0.001 88 88 9.25 0.83–0.96
AUROC, area under the receiver operating characteristic curve; CH, corneal hysteresis; CI, confidence interval; CRF, corneal resistance factor; IOPcc, corneal-compensated intraocular pressure; IOPg, Goldmann-correlated intraocular pressure.
compared with traditional keratometric and pachymetric assessment of the corneal shape. Similarly, CH and CRF, and novel waveform-derived ORA parameters were reported to provide improved identi-fication of keratoconus patients.18However, the data on the role of
ORA in differential diagnosis of FFKC still remain limited. Because FFKC is one of the main causes of corneal ectasia after refractive surgeries, its early diagnosis is critically important. In the recent literature, biomechanical data were shown to be valuable in the identification of FFKC. Touboul et al.19compared eyes with
mild stages of keratoconus and control cases and reported that, using a threshold of 9.6, CH had a sensitivity of 66% with a spec-ificity of 67%, and that, using a threshold of 9.7, CRF had a sen-sitivity of 72% and a specificity of 77%. Similarly, Ayar et al.20
reported that CH and CRF were significantly lower in the FFKC patients, compared with normal control subjects, and the best cut-off values were reported as 9.3 and 8.8 mm Hg for CH and CRF, respectively. On the other hand, in a recent study, Luz et al.21
reported that, not the CH or CRF, but ORA waveform parameters were able to better differentiate FFKC from normal corneas. In addition, the ORA waveform parameters were also reported to improve the predictive value in the differentiation of FFKC from normal eyes, when combined with topographic data.22However,
Mohammadpour et al.23reported that although CH and CRF were
helpful in differentiating keratoconus from normal eyes, they were not valuable for detecting suspicious keratoconus. Similarly, Ven-tura et al.24reported that the waveform-derived ORA parameters
were able to better differentiate grades I and II keratoconus from normal corneas than the CH, IOPg, IOPcc, and CRF.
In this study, we found statistically significant AUC results regarding IOPg, CH, and CRF in the ROC analysis, in differen-tiation of FFKC cases from normal eyes. The best cut-off values for IOPg, CH, and CRF were reported as 11.75, 9.45, and 9.25, respectively. In addition, the AUC results regarding IOPg, CH, and CRF in the ROC analysis were also statistically significant, when FFKC and astigmatic groups were compared. Accordingly, the best cut-off values for IOPg, CH, and CRF were found to be 11.60, 9.24, and 8.85, respectively. To the best of our knowledge, this is the first study in the literature comparing FFKC cases with astigmatic patients using the ORA parameters.
In the literature, there are a limited number of data regarding the ORAfindings in patients with astigmatism. Hagishima et al.25
re-ported that there was no significant correlation between corneal astigmatism and IOPcc or IOPg as measured with ORA. Similarly, Wong et al.26reported that, at the default position, the IOPg and
CRF had a weak correlation with corneal astigmatism, whereas the IOPcc and CH were not significantly correlated with corneal astig-matism. In our study, we also found no statistically significant difference between the control and astigmatism groups in the ORAfindings including IOPcc, IOPg, CH, and CRF.
Nonetheless, there are some limitations of this study that should be mentioned. First, combination of different ORA parameters may increase the sensitivity or specificity of FFKC diagnosis, which may be a subject of another study. Second, sample size is small to generalize the study results to the overall population.
In conclusion, our study showed that corneal biomechanical parameters measured by ORA could be used in differentiation of patients with FFKC from normal control cases or astigmatic patients, particularly in patients with suspicious results. In addition, we suggest using ORA in combination with corneal topography for better and more accurate diagnosis of FFKC. However, further studies with larger groups are warranted to determine the exact role of ORA in the differential diagnosis of FFKC.
REFERENCES
1. Fontes BM, Ambrosio R Jr, Jardim D, et al. Corneal biomechanical metrics and anterior segment parameters in mild keratoconus. Ophthalmology 2010; 117:673e679.
2. Rabinowitz YS. Keratoconus. Surv Ophthalmol 1998;42:297–319. 3. Klyce SD. Chasing the suspect: Keratoconus. Br J Ophthalmol 2009;93:845–847. 4. Saad A, Gatinel D. Topographic and tomographic properties of forme fruste
keratoconus corneas. Invest Ophthalmol Vis Sci 2010;51:5546–5555. 5. Bogan SJ, Waring GO, Ibrahim O, et al. Classification of normal corneal
topography based on computer-assisted videokeratography. Arch Ophthal-mol 1990;108:945–949.
6. Bao F, Geraghty B, Wang Q, et al. Consideration of corneal biomechanics in the diagnosis and management of keratoconus: Is it important? Eye Vis (Lond) 2016;3:18.
7. Randleman JB. Evaluating risk factors for ectasia: What is the goal of assessing risk? J Refract Surg 2010;26:236–237.
8. Santhiago MR, Giacomin NT, Smadja D, et al. Ectasia risk factors in refractive surgery. Clin Ophthalmol 2016;10:713–720.
9. Kymionis GD, Bouzoukis D, Diakonis V, et al. Long-term results of thin corneas after refractive laser surgery. Am J Ophthalmol 2007;144:181–185. 10. Terai N, Raiskup F, Haustein M, et al. Identification of biomechanical properties of the cornea: The ocular response analyzer. Curr Eye Res 2012;37:553–562.
11. Goebels SC, Seitz B, Langenbucher A. Precision of ocular response ana-lyzer. Curr Eye Res 2012;37:689–693.
12. Wolffsohn JS, Safeen S, Shah S, et al. Changes of corneal biomechanics with keratoconus. Cornea 2012;31:849–854.
13. Hallahan KM, Sinha Roy A, Ambrosio R Jr, et al. Discriminant value of custom ocular response analyzer waveform derivatives in keratoconus. Oph-thalmology 2014;121:459–468.
14. Johnson RD, Nguyen MT, Lee N, et al. Corneal biomechanical properties in normal, forme fruste keratoconus, and manifest keratoconus after statistical correction for potentially confounding factors. Cornea 2011;30:516–523. 15. Saad A, Lteif Y, Azan E, et al. Biomechanical properties of keratoconus
suspect eyes. Invest Ophthalmol Vis Sci 2010;51:2912–2916.
16. Shah S, Laiquzzaman M. Comparison of corneal biomechanics in pre and post-refractive surgery and keratoconic eyes by ocular response analyser. Cont Lens Anterior Eye 2009;32:129–132.
17. Fontes BM, Ambrósio R Jr, Velarde GC, et al. Corneal biomechanical evaluation in healthy thin corneas compared with matched keratoconus cases. Arq Bras Oftalmol 2011;74:13–16.
TABLE 4. Comparison of Area Under the Receiver Operating Characteristic Curve, Selected Parameter Cutoff, Sensitivity, and Specificity for Ocular Response Analyzer Variables Between Forme Fruste Keratoconus and Astigmatism Groups
Parameter AUROC SE P Sensitivity Specificity Cutoff 95% CI
IOPcc (mm Hg) 0.646 0.055 0.072 64 60 14.45 0.54–0.75
IOPg (mm Hg) 0.808 0.044 ,0.001 86 70 11.60 0.72–0.89
CH 0.796 0.044 ,0.001 74 70 9.24 0.71–0.88
CRF 0.857 0.038 ,0.001 86 80 8.85 0.78–0.93
AUROC, area under the receiver operating characteristic curve; CH, corneal hysteresis; CI, confidence interval; CRF, corneal resistance factor; IOPcc, corneal-compensated intraocular pressure; IOPg, Goldmann-correlated intraocular pressure.
18. Luz A, Fontes BM, Lopes B, et al. ORA waveform-derived biomechanical parameters to distinguish normal from keratoconic eyes. Arq Bras Oftalmol 2013;76:111–117.
19. Touboul D, Bénard A, Mahmoud AM, et al. Early biomechanical kerato-conus pattern measured with an ocular response analyzer: Curve analysis. J Cataract Refract Surg 2011;37:2144–2150.
20. Ayar O, Ozmen MC, Muftuoglu O, et al. In-vivo corneal biomechanical analysis of unilateral keratoconus. Int J Ophthalmol 2015;8:1141–1145. 21. Luz A, Lopes B, Hallahan KM, et al. Discriminant value of custom ocular
response analyzer waveform derivatives in forme fruste keratoconus. Am J Ophthalmol 2016;164:14–21.
22. Luz A, Lopes B, Hallahan KM, et al. Enhanced combined tomography and biomechanics data for distinguishing forme fruste keratoconus. J Refract Surg 2016;32:479–494.
23. Mohammadpour M, Etesami I, Yavari Z, et al. Ocular response analyzer parameters in healthy, keratoconus suspect and manifest keratoconus eyes. Oman J Ophthalmol 2015;8:102–106.
24. Ventura BV, Machado AP, Ambrósio R Jr, et al. Analysis of waveform-derived ORA parameters in early forms of keratoconus and normal corneas. J Refract Surg 2013;29:637–643.
25. Hagishima M, Kamiya K, Fujimura F, et al. Effect of corneal astigmatism on intraocular pressure measurement using ocular response analyzer and Goldmann applanation tonometer. Graefes Arch Clin Exp Ophthalmol 2010;248:257–262.
26. Wong YZ, Lam AK. Influence of corneal astigmatism, corneal curvature and meridional differences on corneal hysteresis and corneal resistance factor. Clin Exp Optom 2011;94:418–424.