EFFECT OF ENVIRONMENTAL POLICY
ON LABOR MARKET
A Master’s Thesis
by
MOHAMMADREZA MOUSAVI ALMALEKI
Department of Economics
İhsan Doğramacı Bilkent University
Ankara
September 2016
ii
EFFECT OF ENVIRONMENTAL POLICY
ON LABOR MARKET
The Graduate School of Economics and Social Sciences of
İhsan Doğramacı Bilkent University
by
MOHAMMADREZA MOUSAVI ALMALEKI
In Partial Fulfillment of the Requirements for the Degree of
MASTER OF ARTS in
THE DEPARTMENT OF ECONOMICS İHSAN DOĞRAMACI BİLKENT UNIVERSITY
ANKARA
iv
ABSTRACT
EFFECT OF ENVIRONMENTAL POLICY ON LABOR MARKET MOUSAVI ALMALEKI, MOHAMMAD REZA
M. A., Department of Economics Supervisor: Prof. Erinç Yeldan
September 2016
This thesis examines the effect of environmental policy, i. e. tax on carbon emission, on the labor market as assessed in a directed technology change environment. Considerably positive and constructive effect on the labor market is demonstrated by this model, as are increases in both demand and wage of labor. Labor wage in free market is clearly less than the optimal wage, as predicted in the model. Labor wage has an increasing rate of return in optimal market. Clean technology and skilled labor are increasing as a result of the model, at the same time we see that labor wage is also increasing. The relation between clean technology and skilled labor is the key property of the optimal economy which makes the relation between supply of labor and their wage positive which is at odds with traditional economics. It is also interesting to notice that even if we change the production function from Cobb-Douglas to CES form we get similar results, regardless of the elasticity of substitution between factors the skill premium is increasing in the energy saving technology. Increases in the level of clean energy resulted in increases in wages and labor. Clean energy is benefiting the whole economy regardless of the elasticity of substitution between input factors.
Keywords: Climate Change, Directed Technology Change,Environmental Economics, Labor Market.
v
ÖZET
ÇEVRE POLITIKASININ İŞGÜCÜ PİYASASINA ETKİSİ
MOUSAVI ALMALEKI, MOHAMMAD REZA Yüksek Lisans, Ekonomi Bölümü
Tez Yöneticisi: Prof. Dr. Erinç Yeldan Eylül 2016
Bu çalışmada, karbon emisyonu vergisi gibi çevre politikasının işgücü piyasasına etkileri, teknolojinin içsel olduğu varsayımına dayalı bir model çerçevesinde incelenmiştir. Bu modelde, çevre politikasının işgücü piyasası üzerinde oldukça pozitif ve yapıcı etkileri olduğu sonucuna ulaşılmıştır. Model içerisinde, hem işgücü talebinin hem de ücretin arttığı varsayılmaktadır. Serbest piyasa koşullarında işgücü ücreti, modelde tahmin edildiği gibi, açıkça optimal ücret altındadır. Optimal piyasa koşullarında işgücü ücreti artan getiri oranına sahiptir. Model içerisinde temiz teknoloji ve nitelikli işgücü giderek artmaktadır, dolayısıyla işgücü ücretinin de artmakta olduğunu görmekteyiz. Geleneksel ekonomi anlayışıyla çelişen ve işgücü arzıyla işgücü ücreti arasında pozitif ilişki
olduğunu savunan optimal ekonomi anlayışının kilit özelliği, temiz teknoloji ve vasıflı işçi arasındaki ilişkidir. Ayrıca, üretim fonksiyonunu Cobb-Douglas şeklinden sabit ikame esneklikli üretim fonksiyonu (CES) formuna değiştirsek dahi; üretim faktörleri arasındaki ikame esnekliğini dikkate almaksızın nitelikli işgücü ücretinin, enerji tasarruflu ekonomide aynı şekilde arttığını görüyoruz. Temiz enerji düzeyini arttırarak her iki işgücünün ücret düzeyini arttırabiliriz. Sonuç olarak temiz enerji üretimi, üretim faktörleri arasındaki ikame esnekliğini dikkate almaksızın ekonominin tamamına fayda sağlamaktadır.
Anahtar Kelimeler: Çevre Ekonomisi, İçsel Teknoloji Değişikliği, İklim Değişikliği, İşgücü Piyasası.
vi
ACKNOWLEDGMENTS
I would like to declare my deepest thanks to my dearest one, my mother. Without her being I could not even write thank you mother!
I appreciate help and support of all my friends especially Ibrahim, Alican and Sebastien. Special thanks to my advisor Prof. Erinç Yeldan and thanks to Bilkent.
vii
Table of Contents
ABSTRACT ... vii
ÖZET ... vii
ACKNOWLEDGMENTS ... vii
LIST OF TABLES ... viii
LIST OF FIGURES ... vii
Chapter 1: Introduction ...1
1.1 Preface...1
1.2 Methodology ...2
Chapter 2: Literature Survey ...4
Chapter 3: Model ...12
3.1 Household Problem ...13
3.2 Production Side ...14
3.3 Definition of Competitive Equilibrium ...14
3.4 Laissez Faire ...15
3.5 Social Planner’s Allocation...16
3.6 Producing firm’s response ...18
Chapter 4: Calibration and Discussion ...21
Chapter 5: Conclusion ...27
References ...29
viii
LIST OF TABLES
ix
LIST OF FIGURES
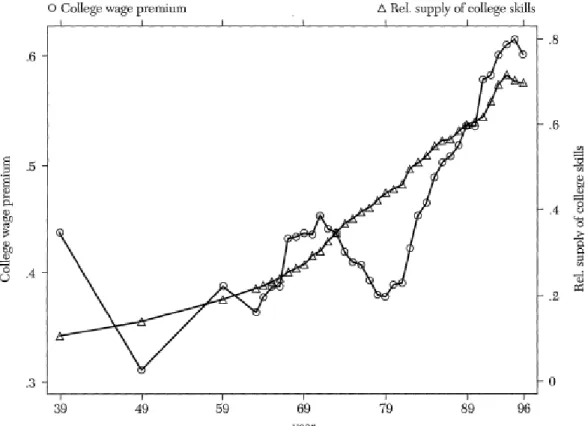
2.1 Supply and wage of college students in the US during 1939- 1996 ...8
2.2 Capital and Labor share in the US corporate and personal sector during 1929-2003 ...9
2.3 Labor Income Share Ratios for Turkey ...10
4.1 Laissez-faire capital and energy saving capital ...23
4.2 Optimal and laissez-faire outputs ...24
4.3 Laissez-faire emissions and temperature increase ...24
4.4 Optimal capital and energy saving capital ...25
4.5 Optimal emissions and temperature increase ...25
4.6 Optimal and laissez-faire wages ...26
INTRODUCTION
1.1 Preface:
Scientists have stated that the climate of the world is changing and we will experience higher temperature in the future. Increasing the temperature and other climate changes has several consequences on the globe which require both theoretical and practical attention. Economic evaluates are needed in order to manage adequate policies to contribute to the policy for managing climate change mitigation acts.
On the other hand the global financial crisis has made the opportunity to make new visions in economic growth models to obtain more efficient production and consumption path. On top of that environmental policies are necessary to reach a sustainable growth. Climate change is highlighting the importance of attention to low carbon economy with high efficient productivity and production functions with higher levels of technology that can reduce the usage of fuels and energy in their product factors. Innovation is one of the most critical parts of the problem. New technologies with reducing or omitting usage of fuels and non-reproducible energies are required to mitigate the climate change and carbon emission.
Green Economy Paradigm has been established as a mainstream in policy environment. The Green Jobs Act of 2007, "authorized up to $125 million in funding to establish national and state job training programs, administered by the U.S. Department of Labor, to help address job shortages that are impairing growth in green industries, such as energy efficient buildings and construction, renewable electric power, energy efficient vehicles, and biofuels development. Additionally, the American Recovery and
2
industries such as energy, utilities, construction, and manufacturing with a focus toward energy efficiency and more environmentally-friendly practices.
These acts and funds are being performed while there are critics who are pessimistic about the policies. The effects of these policies on current firms are greatly debated. Noticing that, at first glance new technologies seem to be more capital incentive and would have negative effects on labor market.
The impact of these policies on the labor market is important and under question. As these policies are being performed there are several consequences on labor market like change in relative production cost, change in the demand for products and technologies and re-orientation of R&D towards low emission and clean processes. This leads to the following questions: what are the regulation impacts on labor market? How are the dynamic forces of labor market adjustment formed and affected under the environmental policies? What are the issues of complementarity across labor market regulations and policies towards green growth? What are the dilemmas? Lack of studies reviewing these impacts makes both the policy makers and the economic sectors staggered since it is not clear what happens when billions of budget shares are being committed for creating green growth in different countries. Hence it is important to make a study in which we try to understand the dynamics of the labor market under these policies.
1.2 Methodology:
I will consider a directed technical changes model with high attention to labor dynamics. First the economy will work under laissez-faire and we will see it would make an
environmental catastrophic. Then government will intervene and put a tax on the consumption of energy which is fossil fuel. The amount of tax is calculated through comparing laissez faire and social planner’s optimal allocation. Then the representative firm will hire scientists to make inventions and bring high efficiency to the firm by reduce the amount of energy consumption. We will see this technological change toward scientists would be scientist (or skilled labor) increasing under specific conditions regarding the elasticity of substitution between the parameters in the model.
3
Furthermore, model calibration with considering current data on environmental
regulation will be part of the work. The developed model then would be characterized in Dynare to see the dynamics of factors especially labor through discrete time model.
4
Chapter 2:
Literature Survey
Macroeconomics of environmental change is a wide and a growing topic. There are several approaches dealing with the issue. There are foretime growth models that
consider exhaustible resources in their studies but does not include technology or relation of other factors in the economy with the environment, such as Hotteling (1931), Stiglitz (1974), Dasgupta and Heal (1974).
Substantial works that consider climate and economic relations with a more clear approach are Nordhaus works. His Dynamic Integrated Climate-Economy model
(DICE) (1994) extends Ramsey model in neoclassical frame work and considers climate change and economy interactions.
Another approach to the climate change literature is related to costs, risk, uncertainty and discounting. Naming studies like Stern (2007) and Dasgupta (2008).
Regarding technology in macroeconomics of climate change there are studies who assume technology as exogenous like Golosov et al. (2009). But in our study we want to take technology as an endogenous variable. Approaches based on exogenous technology could not help us evaluating the labor market under policies. In fact they end up with suggesting that optimal policies are the one who are resulting in reducing long-run growth. Nordhaus model is the modest one. Stern (2006) argues that permanent interventions are needed and will reduce long-run growth as the price for avoiding the environmental disaster.
A study done by Gerlagh et al. (2009) shows that subsidies for research and
development would decrease carbon tax. Diaz et al. (2004) introduce a neoclassical growth model with second type of physical capital that is being used in a way that it
5
reduces the consumption of energy. They call this capital good as “induced energy saving innovation” and call it energy saving capital. They show that there is a positive relation between energy price and this energy saving capital. A similar work by Atkeson and Kehoe (1999) also exhibits similar predictions.
Increasing number of works is highlighting the fact that Government intervention is needed to boost the engine of green economy. Considering the effect of these policies on
the labor market a 2004 study byKammen et al. at UC Berkeley reported that the
renewable energy sector generates more jobs than the fossil fuel-based energy sector per unit of energy delivered (i.e., per average megawatt) across a broad range of scenarios. It is often assumed that environmental protection inevitably comes at a financial cost. However, an increasing number of studies are finding precisely the opposite is true in the case of renewable energy: that greater use of renewable energy systems provides
economic benefits through investments in innovation, and through new job creation, while at the same time protecting the economy from political and economic risks
associated with over-dependence on too limited a suite of energy technologies and fuels. Another study by Bezdek et al. (2008) suggests that environmental regulations, economic growth, and jobs creation can be complementary and compatible: Investments in
environmental regulations can create jobs, not destroy them. This is in line with a more recent work: Bowen (2012) concludes: Renewable energy supply, an increase in which is a key component of global and local climate change policies, appears to be likely to be more labor intensive than traditional fossil-fuel based supply. On the other hand there is a limit in understanding of how the transition towards green growth will reshape labor markets as OECD report (2012) states. Some other works are rejecting the green jobs efficiency and argue that Governments intervention will not only result in net positive job creation, but also may damage the economy. Robert Michaels et al. (2009) warn most of the optimistic works rest on incomplete economic analysis, and consequently greatly overstate the net benefits of their policy recommendations. A more severe study done by Álvarez (2009) states in fact these policies destroys jobs, detailing this in terms of jobs destroyed per job created and the net destruction per installed. More recent book by Diana Furchtgott-Roth (2012) publicly challenged the green jobs concept and policy.
6
None of these studies set up a model considering climate change and environmental regulations with directed technology which is essential for analyzing the labor market dynamics. The effect of environmental regulations on the labor market is clearly an important issue which has been neglected in the literature.
Along the literature Daron Acemoglu, Philippe Aghion, Leonardo Bursztyn, and David Hemous (2012) introduce a clear environmental model which is a perfect benchmark to pursue evaluations of labor market using this model. In their model there is endogenous and directed technological progress within environmental framework. They also
consider the quality of environment as an argument in the house holds utility. They consider several issues like R&D expenditure, inventing machines, new possible
technologies and monopoly of patent right for inventor of new technology. It suggests a
very different answer to how to deal with climate change problem:Optimal
environmental regulation, or even simple suboptimal policies just using carbon taxes or profit taxes/research subsidies, would be sufficient to redirect technical change and avoid an environmental disaster without sacrificing long-run growth.A simple but important implication of Acemoglu’s analysis is that optimal environmental regulation should always use both an input tax (“carbon tax”) to control current emissions, and research subsidies or profit taxes to influence the direction of research. Even though a carbon tax would by itself discourage research in the dirty sector, using this tax both to reduce current emissions and to influence the path of research would lead to excessive distortions. Instead, optimal policy relies less on a carbon tax and instead involves direct encouragement to the development of clean technologies.
It was assumed that green economy regulations will harm the labor market as it is restrictive, but no strong evidence of this assumption was monitored. Rather, it has been believed that green economy policies will affect employment positively. As we take a close look at the literature there are two main assumptions: First, Environmental policies will result in expansion of some economic sectors, especially Environmental Goods and Services. Second, Production in environmental goods and services is mainly “labor intensive” than in traditional industries. Yet these assumptions have not been proved by solid empirical works. Although there are some works assessing these issues, they are
7
mainly concentrated on a specific sector like energy sector but not labor market as a whole. None of all works which have been done so far develop a systematic framework for the analysis of the impact of environmental regulations on the labor market. In the literature of Green Jobs no work seems to treat the economy as a standard holistic model. I will introduce a laissez faire model to capture a baseline model to calculate optimal carbon tax.
We need to consider changes in the technology as one of the most important
characteristics of the economy. Productivity in manpower has improved a lot during the last years and technology has become a core important member of every economic activity. Besides, as we will discuss there are stylized facts that we cannot explain them with simple routine concepts of traditional economics. For example data shows that while supply of college graduates is increasing during last decades, their wage is not
decreasing. Figure 1 shows that both supply and wage of college graduates are almost increasing during the past decades in the US ( Acemoglu, 2002a).
As traditional theories of supply and demand suggests the college premium should decrease with increase in supply of graduate students. Data shows that returns to college not only is not decreasing with abundant supply of college graduates but also is
increasing. If we assume that skilled and unskilled workers are imperfect substitutes, then increase in supply of skilled workers should decrease their wage which is not happening. For explaining this issue we should consider importance of technology. It is unlikely to take technology as given and just as a shift of production function. We should notice that technology is changing rapidly through last decades. Not only it is changing and not constant anymore, but also it benefits some parts of the economy and may hurt some other parts. It is not neutral. That’s why I consider technology as an endogenous factor in my model in this work.
8
Figure 2.1 Supply and wage of college students in the US during 1939- 1996
One interesting way to introduce technology change into the model is to capture the changes with changes in 𝐴(𝑡). To do so we need to know some basics about balanced growth path and Kaldor facts (Kaldor, 1963). Balanced growth path is a path of the economy in which Kaldor facts are satisfied, i. e. by increasing of the output per capita the followings would remain constant: capital output ratio, the interest rate, and the distribution of income between capital and labor.
As Piketty and Saez (2004) suggest in figure 2, the factor shares of capital and labor in GDP in the United States are almost constant for seven decades. As it can be seen approximately the share of labor is 2/3 and for capital is 1/3 which is consistent with the practical literature. For interest rate, Homer and Sylla (1991) show that it is not exhibit increasing or decreasing trend for centuries and over countries.
9
Figure2.2Capital and Labor share in the US corporate and personal sector during 1929-2003.
10
Despite these facts it is not surely true that we take them for granted. For example for Turkey the share of labor is not behaving as stated.
Figure 2.3 Labor Income Share Ratios for Turkey
In reality we cannot easily see Kaldor facts happening. Moreover, we can see so many growth patterns that are not balanced but for our work it is more convenient to consider our model in a balanced environment.
The reason that why we need to work in a balanced growth path environment is that if we want to take technology as endogenous and stochastic we cannot look at steady state, because income per capita would be dependent on technology A(t) and will increase over time. Consequently we cannot have steady state. To solve this we can take balanced growth as our steady state. Because balanced growth path is the same as steady state with some transformations. In addition to that balanced growth path necessitates all
technological change to be labor augmenting or Harrod neutral. This was first stated by Uzawa (1961) and later Schlicht (2006) proved it. However, Sala-i-Martin’s (2004) in his argument takes technology as both capital augmenting (Solow neutral) and labor
augmenting (Harrod neutral) which seems is not necessary and Schlicht’s proof shows that for balanced growth path the technological change should be labor augmenting. Acemoglu (2007) sums this up in a clear way: “if an economy has an asymptotic path
with constant growth of output, capital and consumption, then asymptotically
0 0,05 0,1 0,15 0,2 0,25 0,3 19 87 19 88 19 89 19 90 19 91 19 92 19 93 19 94 19 95 19 96 19 97 19 98 19 99 20 00 20 01 20 02 20 03 20 04 20 05 20 06
11
technological progress can be represented as Harrod neutral (purely labor augmenting)”.This indicates that we cannot achieve balanced growth path if
technological change is not labor augmenting.
Another interesting issue that we should note here is that different technological changes are important when the elasticity of substitution of capital and labor (generally production factors) is not same as one. If the elasticity of substitution between capital and labor is equal to one then change in technology is not anything but only a shift of production function which is happening in Cobb-Douglas production function. In Cobb Douglas production function the elasticity of substitution between factors are equal to one so different types of technological change are only a shift of production function. That’s when I want to consider endogenous change in my model I don’t use Cobb-Douglas production function and I‘d rather Constant Elasticity of Substitution (CES) production function.
12
Chapter 3:
Model
The importance of this model is considering energy efficiency as an endogenous property of the economy. Taking technology as a transform of production function does not seem to be efficient way of describing the economy, especially knowing that technology is mostly benefiting one part and hurting some other firms. Considering technology endogenously would help to explain the condition more efficiently, which means that agents would make investments in energy saving capitals in order to reduce energy usage. Energy saving capital could be thought of as “labors education” or “new inventions in some machines” that house hold is providing for the production part. Another issue is that efficiency that we expect here would decrease usage of energy in the economy. Hence there should be decrease of energy usage by increasing the level of technology. Energy is a fundamental part of the production function. There would be no production if energy is lower than a certain amount.
The relation of the economy and the climate is through producing final good which requires energy that makes carbon emission to the atmosphere. Increasing the level of carbon emissions in the atmosphere would increase the temperature of the globe. Temperature is the element that household cares about in her utility function. The more the level of the temperature the worse off the house hold would be. The utility function U( Ct , Tt) is increasing in consumption but decreasing in temperature.
There is a certain amount of temperature that if it goes beyond that there would be a catastrophe in the environment. To prevent the catastrophe government intervention is needed. The equation which relates temperature and energy introduces externality to the model that neither households nor firms take care of. That’s why government would
13
intervene and put tax on carbon emission or energy usage which the latter and former are being used interchangeably in this work.
Comparing the laissez faire part of the model with the government intervention would show us that there is a difference between competitive equilibrium and social planner’s problem. Hence, optimal tax that government would put on energy usage of the firm would be calculated by comparing them.
The economy accepts a representative house hold with the utility consist of consumption and level of the temperature. Level of the temperature will not affect consumption but will reduce the household’s utility if the temperature increases. Production side of the economy consists of a representative firm with capital, labor and energy and produces a final unique good. Producing firm purchases energy from an energy firm who extracts and distributes energy.In the model there is a single form of energy without which no production can take place. There is a known and limited stock of it.
3.1 Household’s problem:
Household’s preference problem is characterized as the following:
Max ∑ 𝛽𝑡 U( C t , Tt) ∞ 𝑡=0 Subject to: , , , , , 1 a, 1
c
(1
) k
(1
) a
t a t k t a t t k t t t t k t t t t t tI
I
r a
r k
w l
I
k
I
a
Where 𝒂𝒕 is energy saving capital. Energy saving capital could be thought of as “labors education” or “new inventions in some machines” that house hold is providing for the production part. It is inversely related to the energy which means that if the level of 𝑎𝑡 increases the economy would use less energy.𝑰𝒂,𝒕 and 𝑰𝒌,𝒕 are investments in producing
14
capital and energy saving capital respectively. Both capitals are depreciating with rate of depreciation δ.
3.2 Production side:
In the laissez faire representative firm uses a cobb-Douglas production function:
1 (z ) t t t t Y k l as long as t t t k e a
. 𝐞𝐭 is the energy consumed in the producing firm at time t and zt is the technology shock which is given and exogenous in laissez faire. If
energy is not available the production level would be zero. Energy is essential for the
economy and in every equilibrium this condition should be satisfied: lim lim t 0
t t t t k e a .
3.3 Definition of competitive equilibrium:
A competitive equilibrium consists of the allocation {ct,kt+1, et} 𝑡=0∞ ; prices {rt,wt, 𝑝𝑡}∞𝑡=0; profits{𝜋𝑡 }𝑡=0∞ ; temperature level {Tt} such that
• Taking as given k0, and {rt,𝜋𝑡 ,Tt}, allocations {ct , kt+1} solve household’s problem.
• Taking as given {rt,wt,pt}, allocations {l kt, ,e ,t t at} solve firm’s maximizing problem and generate the profit sequence {𝜋𝑡}.
• Prices {r p wt, t, t } are such that supply equals demand in goods and factor markets period by period. ctIa t, Ik t, r aa t t, r kk t t, wlt t, kt kt, et et, lt lt, at at.
• Given {et}, Yt generates {Tt} and Tt Tt period by period.
A competitive equilibrium is a laissez-faire equilibrium if there is no government intervention in the economy. Furthermore, let a competitive equilibrium with taxes be
15
defined as a competitive equilibrium with
t > 0 for some t. I will introduce it after showing that competitive equilibrium is not as the same as social planner’s allocation. Obviously this happens because of the environmental constraint which brings externality to the model.3.4 Laissez Faire:
Solving house hold problem in laissez faire is as the following.
, , 1 1 0 0 , 1 1 , 1 1 1 a, 1 , , 1 a, 1 1
U(C ,T )
(
(1
)k
(1
)a
c )
0
(1
)
0
(1
)
0
c
t t t t t a t t k t t t t t t t t t t t t t c t t t t t t k t t t t t t u t t c t t t c k t t tr a
r k
wl
k
a
u
r
r
du
u
dc
u
r
r
r
, 1 , 11
1
t t c t tc
u
c
16
1 , , , 2 , , ,(z
)
(1
)
t t t t t t t t a t t k t t t t t t t k t t t t t t t t l t t t k t t t t l t tY
k
l
k
e
a
Max Y
r a
r k
w l
p e
p
y
r
a
p k
r
a
w
y
dy
y
y
dk
k
y
y
l
Demand equation for the labor is
1 1 1 2t t t t t ra rk l k z
. We can see that there is a high
positive relation between energy saving capital (at) and labor but inverse relation with technology shocks which is assumed exogenous in laissez faire.
The equation for energy price is developed using Hotelling(1931) rule: t 1 t 1
t t
p c
p
c which says along a balanced growth path the price of energy is growing faster than inverse of the utility discount factor.
3.5 Social Planner’s allocation:
Due to the environmental externality government will intervene and put a tax on fuel consumption for producing firm. I will calculate the optimal tax 𝜏 by comparing competitive equilibrium and social planner’s allocation. Planner’s problem is as the following:
17 , , 1 1 U(C ,T ) s.t. c (1 ) T (z ) t t t a t k t t t t t t t t t t t t t t t t t t Max I I p e y tr tr e T De reg Y k l k e a
𝑻𝒕 is the temperature of the world at time t and 𝐞𝐭 is the energy consumed in the
producing firm at time t. D is the rate of environmental degradation and reg is the rate of environmental recovery or improvement. We can see that temperature will increase with more consumption of energy and will lead to a disaster if sufficiently increased.
Planner’s problem and its Lagrangian and first order conditions are the following:
1 1 0 0 1 0 , 1 1 1 1 1 1 , 1 1 1 1 1 1 U(C ,T ) ( (1 ) k (1 ) c ) ( (1 ) T ) : 0 : (1 ) ( ) 0 : t t t t t t t t t t t t t t t t t t t t t t t t t t c t t t t t t t t t t k t t t t t t t t y k a a e p e T De reg c u p D k y a a a a
1 1 1 1 1 1 1 1 2 2 1 2 1 1 1 1 1 1 , 1 1 (1 ) ( ) 0 : (1 reg) 0 t t t t t t t t t t t t t t t t t T t t k p k Dk a a a T u
We can obviously see that planner’s first order condition and competitive allocation’s first order conditions are not equal which is due to externality that temperature equation is bringing into the economy. By putting competitive equilibrium and planner’s solution equal we can find optimal tax value that planner can put on energy so that the temperature equation would be considered in the model. The derivation of optimal tax is as following:
18 , 1 1(1 reg) 0 t t t t u t t T t t D D c u
Where
t is the Lagrangian multiplier associated with the temperature equation and function of marginal utility of temperature.3.6 Producing firm’s response:
When fossil consumption tax is imposed, firm will hire some scientists (S) to increase the technology of production by reducing the amount of energy used. There is a new
production function with endogenous technology. Without loss of generality I drop the time index.
( ) 1t t t t t
y z k a L
Where 𝜌 = 𝜎𝐾,𝐿−1
𝜎𝐾,𝐿 represents the elasticity of substitution between capital and labor. L is total amount of labor which equals summation of Normal labor or unskilled labor with
Skilled labor , ,
0
s t n t tw
w
a
. As so their wages are wn t, and ws t, respectively.An important equation which determines the characteristics of technology and relates skilled labors to reducing energy consumption is the following equation:at zt(1
S )t . Normal technology (z),is the productivity of normal labors which can be understood as technology in the normal production side, accumulates along with the new technology (a) that depends on Skilled labor and a probability that they can improve technology.19
firm. The feature that (a) has an inverse relation with consumption of energy is coming
from the condition t
t t k e a .
The externality part of the model is still coming from the temperature equation
1 (1 )T
t t t
T De reg , where D is rate of destruction of the environment and reg is rate
of regeneration of the environment as before. Firm’s profit maximizing problem is:
, ,
{yt t t t t s t t n t t (pt t)e }t
Max rk ra w S w N
The essential first order conditions are as following:
, , , 2 , , , 2 p (1) k : 0 (p )( z ) (2) : (3) : (p ) k (4) : t t t k t t t t t t t s t s t t t t t n t n t t t t t a t t t y r a S y w r z a N y w a y r a
The amounts of taxes would come from optimal tax computed in previous part. Prices are evolving according to the Hotelling rule.
The derivatives of production function with respect to corresponding factors are being showed in the Appendix.
Two types of labors’ wages are w, ,(1 t t)
s t s t t z L y a
andyn t, wn t, .An interesting result is that skill premium, relative wages of skilled and normal labors, is: , n, w (1 ) w s t t t t t z L a
. It is interesting to notice that it does not depend on elasticity of
substitution between capital and labor or skilled and normal labors. It is a more strong result that suggests regardless of the elasticity of substitution between factors the skill
20
premium is increasing in the energy saving technology (a). We can see that derivative of skill premium with respect to energy saving technology is strictly positive. So by
increasing the level of clean energy, wage of both labors are increasing. Clean energy is benefiting both sectors regardless of the elasticity of substitution between input factors. This a stronger result compared to similar works including Acemoglu et al. (2012) that suggest skill premium direction is depending on elasticity of substitution between input factors.
21
Chapter 4:
Calibration and Discussion
For the utility function I assume it takes a form as
U(C ,T )t t uln( ) (1Ct u)ln(TT )t which in increasing in consumption and
decreasing in temperature.uis relative weight of household toward consumption and temperature which is assumed to be 0.5. T is a threshold of temperature increase that
household can tolerate which is calibrated as 10 units of increase in temperature. The values for the depreciation rate (δ), the discount rate (β), the share of capital in production ( ) are standard as in the literature.
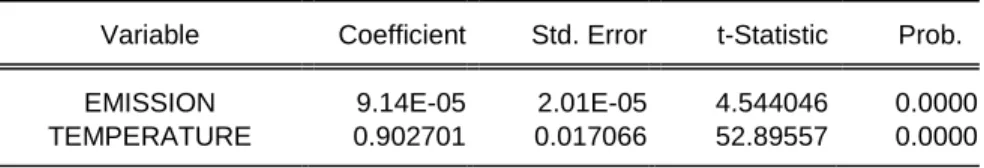
For environmental degradation and regeneration rates I estimate them by using global NOAA1 data for monthly carbon emission and temperature data. The result is as the following:
Table 4.1 Estimation of the Degradation and Regeneration rates of the environment
Variable Coefficient Std. Error t-Statistic Prob.
EMISSION 9.14E-05 2.01E-05 4.544046 0.0000 TEMPERATURE 0.902701 0.017066 52.89557 0.0000
For k0and a0 I take initial values as suggested in Doda (2011), 0.1840 and 0.0285 respectively. As a result initial vale for energy ise0k0/a00.6456. For interest rate I put ra t, rk t, 6%as a convenient value in the literature.
In the following figures, the results of the model are presented. In Figure 4.1 we can see that laissez-faire is a downward economy in terms of capitals. Energy saving capital is
22
decreasing which means that the clean technology which is a desirable technology to reduce the amount of carbon emission and make household better off is decreasing. This is why in the model government would interfere and put tax on carbon emission.
Although in Figure 4.2 we observe that optimal output of the economy, i.e. economy with tax, is more than double of laissez-faire output. This is clearly showing that why carbon emission is harming the economy even in terms of output. Figure 4.3 and 4.5 show the temperature increase and carbon emission in laissez-faire and optimal case. In
competitive case both temperature increase and emissions tend to have larger amount and a slightly increasing trend, but in the case of government interference it is another way around, which means the amount of temperature increase and carbon emission are clearly less and also they have slightly decreasing trend. In figure 4.4 capital and clean
technology represent an increasing trend in government interference case, which was not the case in laissez-faire. It shows that tax is increasing firm’s clean technology which is the desired aim of the government to interfere.
Figure 4.6 and figure 4.7 are the most considerable results which are the goals of this study. In figure 4.6 we can see the dynamics of labor wage in both free market and optimal market. Labor wage in free market is clearly less than optimal wage, as predicted in the model. Labor wage has an increasing rate of return in optimal market. Clean technology and skilled labor are increasing in the model, at the same time we see that labor wage is increasing as well. The relation between clean technology and skilled labor is the key property of the optimal economy which makes the relation between supply of labor and their wage positive which is in odd with traditional economics. Figure 4.7 shows the labor market dynamics. Optimal labor market is valued more than free market labor amount. Free market labor amount is increasing in trend, which is coming from the fact that normal technology shocks at the production function are totally labor
augmenting as balanced growth path necessitates.
As a conclusion the effect of environmental policy, i. e. tax on carbon emission, on the labor market is considerably positive and constructive in this model. Both demand and wage of labor are increasing in the model. It is also interesting to notice that even if we change the production function from Cobb-Douglas to CES form we get similar results
23
without considering the elasticity of substitution between production factors, regardless of the elasticity of substitution between factors the skill premium is increasing in the energy saving technology. Derivative of skill premium with respect to energy saving technology is strictly positive. So by increasing the level of clean energy, wage of both labors are increasing. Clean energy is benefiting both sectors regardless of the elasticity of substitution between input factors.
27
Chapter 5:
Conclusion
As we can see in two last figures both labor demand and labor wages have larger amount in optimal allocations. In short, environmental regulation in this study, which is tax on energy consumption propose positive effects on labor market. The level of labor demand is approximately six times greater in optimal market which is a huge difference. Also it could be seen that labor wage is higher in optimal allocation, although we can see that in long run labor demand in laissez free would surpass optimal labor demand which is a evidence of balanced growth path which necessitates technology change to be labor augmenting.
Labor wage in free market is clearly less than the optimal wage, as predicted in the model. Labor wage has an increasing rate of return in optimal market. Clean technology and skilled labor are increasing in the model, at the same time we see that labor wage is increasing as well. The relation between clean technology and skilled labor is the key property of the optimal economy which makes the relation between supply of labor and their wage positive which is in odd with traditional economics.
Optimal labor market is valued more than free market labor amount. Free market labor amount is increasing in trend, which is coming from the fact that normal technology shocks at the production function are totally labor augmenting as balanced growth path necessitates.
An interesting result is that skill premium, relative wages of skilled and normal labors, is: , n, w (1 ) w s t t t t t z L a
. It is interesting to notice that it does not depend on elasticity of
substitution between capital and labor or skilled and normal labors. It is a more strong result that suggests regardless of the elasticity of substitution between factors the skill premium is increasing in the energy saving technology (a). We can see that derivative of
28
skill premium with respect to energy saving technology is strictly positive. So by increasing the level of clean energy, wage of both labors are increasing. Clean energy is beneficial to both sectors regardless of the elasticity of substitution between input factors. This a much stronger result compared to similar works including Acemoglu et al. (2012) that suggest skill premium direction is depending on elasticity of substitution between input factors.
29
References
Acemoglu, (2007) "Equilibrium Bias of Technology," Econometrica, Econometric Society, vol. 75(5), pages 1371-1409, 09.
Acemoglu, Aghion, Bursztyn, and Hemous, (2012) “The Environment and
Directed Technical Change” The American Economic Review.
Atkeson, Kehoe, (1999) “Models of energy use: Putty-putty versus putty-clay”
American Economic Review, vol. 89(4), pp. 1028-43.
Bowen, Alex (2012) “Green Growth, Green Jobs and Labor Markets” The World
Bank Sustainable Development Network.
Cristina Martinez et al., (2010) “Green jobs and skills, the local labor market implications of addressing climate change” OECD/LEED.
Daniel M. Kammen, Kamal Kapadia, Matthias Fripp (2004) “Putting
Renewables to Work: How Many Jobs Can the Clean Energy Industry Generate?” UC Berkeley.
Daniel M. Kammen, Ditlev Engel, (2009) “Green Jobs and the Clean Energy
Economy,” Copenhagen Climate Council.
Dasgupta, P. and G. M. Heal (1974) ‘The Optimal Depletion of Exhaustible Resources’, Review of Economic Studies 41, Symposium, 3–28.
David J. Peters, Liesl Eathington, and David Swenson (2011) “An Exploration of
Green Job Policies, Theoretical Underpinnings, Measurement Approaches, and Job Growth Expectations,” Iowa State University.
Diana Furchtgott-Roth (2012) “Regulating to Disaster: How Green Jobs Policies
30
Diaz, A., Puch, L.A., & Guillo, M.D. (2004) “Costly capital reallocation and energy use”, Review of Economic Dynamics, vol. 7(2), pp. 494-518.
Doda, Lider, (2011) “Macroeconomics of climate change” University of
Toronto.
Gabriel Calzada Álvarez (2009) “Study of the effects on employment of public
aid to renewable energy sources,” Rey Juan Carlos University.
Gerlagh, Reyer, Snorre Kverndokk, and Knut Einar Rosendahl. (2009) “Optimal
Timing of Climate Change Policy: Interaction between Carbon Taxes and Innovation Externalities.” Environmental and Resource Economics 43(3): 369– 90.
Hotelling, Harold, (1931) “The Economics of Exhaustible Resources”
Journal of Political Economy Vol. 39, No. 2 pp. 137-175
Max Weia, Shana Patadiab, Daniel M. Kammen, (2010) “Putting renewables and
energy efficiency to work: How many jobs can the clean energy industry generate in the US?”, Energy Policy.
Michael Renner et al. (2009), “Low carbon Jobs for Europe, Current
Opportunities and Future Prospects”, WWF-World Wide Fund for Nature.
Nordhaus, William D. (2002). “Modeling Induced Innovation in Climate-Change
Policy.” In Technological Change and the Environment, edited by A. Grübler, N. Nakicenovic and W. D. Nordhaus, 182–209. Washington, D.C.: Resources for the Future Press.
Nordhaus, William D. (2008). A Question of Balance: Weighing the Options on
Global Warming Policies. New Haven, CT: Yale University Press.
Nordhaus, William D.( 2007). “A Review of the Stern Review on the Economics
of Climate Change.” Journal of Economic Literature 45(3): 686–702.
OECD Report (2012) “The jobs potential of a shift towards a low-carbon
economy,” FINAL REPORT FOR THE EUROPEAN COMMISSION, DG EMPLOYMENT.
31
Pearce, Stilwel, (December 2008) “Green-collar' Jobs: Employment Impacts of
Climate Change Policies” Journal of Australian Political Economy.
Piketty, Thomas and Emannuel Saez. 2004. "Income Inequality in the United States, 1913- 1998," MIT and Harvard mimeo.
Reports, (September 2008) “Green Jobs: Towards decent work in a sustainable,
low-carbon world”, UNEP2/ILO3/IOE4/ITUC5.
Robert Michaels, Robbert Murphy (2009) “Green Jobs, Fact or Fiction?”
Institute for Energy Research (IER).
Robert Pollin and Jeannette Wicks-Lim, (2008) “Job Opportunities for the Green
Economy: A State-by-State Picture of Occupations that Gain from Green
Investments”, Political Economy Research Institute, University of Massachusetts Amherst.
Robert Pollin et al., (2008) “Green Recovery: A Program to Create Good Jobs
and Start Building a Low-Carbon Economy”, Center for American Progress, Washington D.C.
Robin Hahnel, (2011) “Green Economics, confronting the ecological crisis”,
M.E. Sharpe.
Roger H. Bezdek, Robert M. Wendling, Paula DiPerna (2008) “Environmental
protection, the economy, and jobs: National and regional analyses,” Journal of Environmental Management.
Schlicht, Ekkehart, (February 2006) “A Variant of Uzawa’s Theorem,”
Economics Bulletin, 5 (6), 1–5.
Sidney Homer, Sylla , (2009) A History of Interest Rates, 4th Edition , ISBN: 978-0-471-73283-9.
2 . United Nations Environmental Programme.
3 . International Labour Organization.
4 . International Organisation of Employers.
32
Stern, N. (2008) “The economics of climate change” American Economic
Review, Vol. 98(2), pp. 1-37.
Stiglitz, Joseph E. (1974) "Growth with Exhaustible Natural Resources: The Competitive Economy," Review of Economic Studies, Oxford University Press, vol. 41(5), pages 139-152.
Uzawa, Hirofumi, ( February 1961) “Neutral Inventions and the Stability of
33
APPENDIX
A.1 Baseline Model:
A.1.1 Household’s problem:
, , , , , 1 a, 1 , , , , 1 1 0 0 U(C ,T ) U(C ,T ) ln( ) (1 ) ln( T ) c (1 ) k (1 ) a U(C ,T ) ( (1 ) k (1 ) a t t u u t t t t t a t k t a t t k t t t t k t t t t t t t t a t k t t t t t t t t a t t k t t t t t t t t t t Max C T I I r a r k w l I k I a y c I I p e r a r k w l k a
c )t , 1 1 , 1 1 1 a, 1 0 (1 ) 0 (1 ) 0 t t c t t t t t t k t t t t t t u r r , , 1 , 1 a, 1 1 , 1 c 1 1 u t t c t t t c t t k t t t c t t du u dc u c r r r u c 34
A.1.2 Firm’s Problem:
1 , , , 2 , (z ) t t t t t t t t a t t k t t t t t t t k t t t t t t t t l t Y k l k e a Max Y r a r k w l p e p y r a p k r a w y , 1 1 1 1 1 (1 ) 2 2 lim lim 0 t l t t t t t t t t t t t t t t t t t t t t t t t t t t t y y l r a r k l k z y r k w l a r y k a r p c p c k e a 35
A.1.3 Social Planner’s Problem:
, , 1 1 1 1 0 0 1 0 U(C ,T ) s.t. c (1 ) T (z ) U(C ,T ) ( (1 ) k (1 ) c ) ( (1 ) T ) t t t a t k t t t t t t t t t t t t t t t t t t t t t t t t t t t t t t t t t t t t t t t t t Max I I p e y tr tr e T De reg Y k l k e a y k a a e p e T De reg
, 1 1 1 1 1 1 , 1 1 1 1 1 1 1 1 1 1 1 1 1 1 2 2 1 2 1 1 1 1 1 1 , 1 1 : 0 : (1 ) ( ) 0 : (1 ) ( ) 0 : t t t c t t t t t t t t t t k t t t t t t t t t t t t t t t t t t t t t t t t t T t t c u p D k y a a a k p k Dk a a a a T u , (1 reg) 0 c u t t c t t t du u dc , 1 1(1 reg) 0 t t t t u t t T t t D D c u
36
A.2 Model with CES Production Function: A.2.1 Household’s problem:
, a, , a, , , , , , 1 a, 1 , , , 1 1 0 0 U(C ,T ) s.t. c (p ) e c (1 ) k (1 ) a U(C ,T ) ( (1 ) k (1 ) a c ) t t t k t t t t t t t k t t k t t a t t s t t n t t k t t t t t t t t t t t t t a t t s t t n t t t t t t t t t Max I I y I I r k r a w S w N I k I a r k r a w S w N k a
F. O. C s: , : t t 0 t c t t c u 1 1: 1 , 1 (1 ) 0 t t t t t k t k r 1 1: 1 a, 1 (1 ) 0 t t t t t t a
r
37
A.2.2 Firm’s problem:
1 ,l , , 1 , , ( ) 1 1 1 (1 S ) (1 ) T {y (p ) e } t t t t t k t t t n t s t t t t t t t t t t t t t t t s t t n t t t t t y z k a L L N S w w a z T De reg k e a Max r k r a w S w N
, p (1) k : t t 0 t k t t t y r a
, , 2 (p )(z ) (2) : t t t 0 t s t s t t t t S y w r z a
, , (3)N yt : n t wn t , 2 (p ) k (4) : t t t 0 t a t t t a y r a
1 1 1 , 1 1 1 s, n, 1 1 1 , k t t t t t t t t t a t t t t y y z k y y y a L y y a L s, n, , (5) t t t a t t a y y y L , , (2),(4) w (1 t t) (6) s t s t t z L y a
, n, w (1 ) w s t t t t t z L a
38 (1) , , , (6,3,5) y (p )e p (1) 0 t t t s t t n t t t t t t t k n s t t t t k t t t s k n s t t k n s t t r k w S w N r a y ky Nw Sw r a y r a SLz y y ky Nw Sw r a y ky Ny Sy r a a