www.rujec.org Publication date: 30 June 2020
An empirical analysis of financial fair-play:
The case of Russian Premier League
Selçuk Özaydın
*MEF University, İstanbul, Turkey
Abstract
The real impact of financial fair play (FFP) came along with the break-even rule which prevents clubs from over-spending through a variety of sanctions. As UEFA limited clubs’ expenses with their incomes, the transfer market took a hit. This paper demonstrates the impact of FFP on Russian Premier League teams’ transfer activity, examines how transfers’ demography and career profiles changed and investigates the changes in com-petitive balance after break-even. A regression discontinuity design is conducted in order to estimate the policy impact. The empirical results suggest that Russian clubs have been severely affected by break-even in terms of transfer expenditure and balance and started to transfer more U21 players and players from lesser leagues of the world. Furthermore, competitive balance in the Russian Premier League deteriorated in favor of the giants in the league as a result of break-even.
Keywords: financial fair-play, break-even rule, transfer market, regression discontinuity design,
Russian Premier League. JEL classification: Z2, Z28.
1. Introduction
Financial fair play (FFP) has been a game changer for European football. The regulations imposed by UEFA have affected all the stakeholders in the in-dustry. UEFA (2015) defines the purpose of financial fair play as “improving the overall health of European club football”. Perhaps the most compelling aspect of FFP has been the break-even condition which limits clubs’ expenditure so that it is commensurate with their revenue. So far numerous clubs have been fined by UEFA for failing to meet the FFP regulations. FK Vardar (MKD), PFC Levski Sofia (BUL) and Sporting Club de Portugal (POR) are the latest three clubs to have been fined by UEFA (UEFA, 2018). Furthermore, Manchester City are about
* E-mail address: [email protected]
© 2020 Non-profit partnership “Voprosy Ekonomiki”. This is an open access article distributed under the terms of the Attribution-NonCommercial-NoDerivatives 4.0 (CC BY-NC-ND 4.0).
to be banned from inter-European competitions due to the fraud they committed in their accounts in order to be able to comply with break-even. Disciplinary actions taken against a club vary depending on the offenses which are introduced in Section 2.1.
In the world of professional sports, it is not uncommon for the governing body to regulate the financial aspects of the league and teams. As Peeters and Szymanski (2014) demonstrate, strict regulations are present in North American professional leagues in terms of roster limits, salary caps, draft rules and gate revenue sharing. These regulations make sure that teams do not go bankrupt and enhance competitive balance.
Even though there have been debates about the compatibility of FFP regula-tions with EU laws (Flanagan, 2013), the regularegula-tions are implemented and since European football clubs’ competitive power mostly depends on their spending, the most decisive element of the FFP has been break-even. In the 2017/2018 season, some of the non-Big 5 major leagues such as Portugal, Russia and Turkey had a wage-to-revenue ratio higher than 70% which is the industry marker for club financial health. Whereas the average wage-to-revenue ratio for the Big 5 was 60% in the 2017/2018 season (Deloitte, 2019). Non-Big 5 clubs’ “unhealthy” financial structure causes difficulties in complying with FFP regulations.
In the 2017/2018 season, the Russian Premier League generated the 6th highest
revenue in European football with 813 million euros (Deloitte, 2019). Although the Russian Premier League is resourceful, Russian teams are the 2nd most
sanctioned, after the Turkish Super League teams, due to failing to meet the FFP requirements. Four Russian teams have been punished as of 2019; therefore they are being closely monitored by UEFA.
The main objectives of this paper are: to empirically illustrate the effects of break-even on Russian Premier League clubs’ transfer activity, to examine how it has affected the demographics and career profiles of transferred players and to reveal whether competitive balance has been affected by break-even or not. In order to reach the objectives, a period of 12 seasons is investigated between the 07/08 and 18/19 seasons. A regression discontinuity (RD) design is conducted to illustrate the effects of break-even on transfer activity. The first sanctions were applied in the 2013/2014 season, for failing to meet the break-even requirements, therefore 2013 is the point of treatment. To estimate the impact of break-even on transfer activity, transfer expenditure and transfer balance are used as outcome variables. Positive and negative impacts on transfer balance and transfer expen-diture are expected respectively. Furthermore, two probable spillover effects are investigated. Considering the limit on expenditure, an increase in the number of free and temporary (loans) transfers is an anticipated spillover effect.
Russian teams have over 70% wage-to-revenue ratio, therefore it would be reasonable to assume that Russian clubs will try reducing their wage bills to comply with break-even. However, since it won’t be possible to revise existing contracts, players who will accept lower wages will be transferred. Unfortunately, wage data regarding Russian teams is not available, therefore the impact on wages is estimated using a proxy variable which is introduced in the Materials and Methods section.
Finally, the impact of break-even on competitive balance is investigated using some of the measures from the literature which are presented in Section 3.
This paper proceeds as follows: the next section provides the theoretical background and additional information about the FFP regulations. Section 3 introduces the dataset, the model and the methodology, and Section 4 presents the results. Section 5 and 6 discuss the findings presented in the Results section and conclude the study.
2. Theory
Financial fair play regulations have been an area of interest for both policy makers and academics over the past years. So far, literature regarding FFP has been focusing on its influence on competitive balance. Vöpel (2011) argues that FFP regulations will only improve the competitive balance between the leading clubs of Europe rather than create a convergence chance for the poorer clubs. Drut and Raballand (2012) have an optimistic perspective and they believe FFP regulations can actually restore competitive balance, if enforced fairly. While the discussion regarding FFP continued, the renowned lawyer Jean-Louis Dupont, famous due to the Bosman case in 1995, issued a press release stating that he had filed a complaint regarding the compatibility of FFP regulations with EU laws in the name of Daniel Striani, a player agent. Dupont argued that FFP violated EU laws and restricted clubs’ investments as well as causing the fossilization of the market structure (Dupont, 2013). Interestingly, Dupont’s client was not a club but a player agent who is probably experiencing a significant reduction in his in-come due to the decreasing number of transfers, transfer fees and player salaries. In the light of the previous discussions, Peeters and Szymanski (2014) argue that the compulsory increase in clubs’ profitability would mean that a higher propor-tion of the rent generated by football will be acquired by clubs. Their model’s results coincide with Vöpel’s (2011) arguments and they expect that the com-petitive superiority of the top teams will be enhanced. Madden (2015) provides a different approach and discusses how the FFP regulations have impacted clubs’ utility and profit objectives.
The transfer market in European football has been subject to several studies, especially after the Bosman ruling came into practice in 1995. Simmons (1997) investigates the impact of the Bosman ruling on the English transfer market whereas Feess and Mühlheußer (2002) theoretically discuss the transfer regula-tions and their effects in pre and post Bosman periods. Frick (2007) illustrates how transfer fees grew over the years and how the number of paid transfers decreased after the Bosman case. Mourao (2016) provides an in-depth analysis regarding the clubs’ efficiency in transfers and tries to determine the most efficient teams in transferring players.
Despite being one of the major leagues in Europe, literature on the Russian Premier League is not as comprehensive as the literature on the Big 5 leagues. In recent years, few important studies have been conducted regarding the Russian Premier League. Charyev (2016) examines the effects of foreign players’ regula-tions on competitive balance, domestic players and attendance between 2000 and 2010. Coates et al. (2017) estimate the brand strength of Russian football clubs and try to identify the determinants. Zelenkov and Solntsev (2017), on the other hand, investigate the efficiency of Russian Premier League clubs using Data Envelopment Analysis (DEA) between 2012 and 2016.
As mentioned earlier, a regression discontinuity design (RD design) is con-ducted in order to estimate the policy impact. RD design has been a popular tool in treatment effect estimation in the economics literature thanks to Thistlethwaite and Campbell’s (1960) pioneering study. In the case of sports economics, several studies have been conducted using RD design. Especially the draft system in North American sports leagues creates perfect datasets for conducting RD de-signs as in the case of Keefer (2014). Regarding European football, few studies have been published using RD design. Radoman (2015) investigates the impact of the Bosman ruling on player productivity in the English Premier League and Hon and Parinduri (2016) illustrate the influence of the three-point rule on the number of scored and conceded goals in the German Bundesliga. Özaydın and Aksu (2019) investigate the effects of the changes in foreign player regula-tions on player productivity in the Turkish Super League.
Although there are studies about the impact of the Bosman ruling in the litera-ture, the effects of regulatory changes on the transfer market is incomprehensive, and there are no empirical studies regarding the effects of FFP. This study portrays the impact of FFP regulations on the Russian Premier League teams.
2.1. FFP and break-even regulation
UEFA releases a licensing and fair play regulations document each year which is publicly available. The information presented in this section and more can be found in “UEFA’s financial fair play: All you need to know” webpage and UEFA Club Licensing and Fair Play Regulations document’s 2018 edition.
Even though FFP regulations were approved in 2010 and the first evaluations were done in 2011, the assessment for break-even began in 2013. Break-even requires clubs to balance income and expenses in order to prevent the accu-mulation of unsustainable debts. Clubs are monitored every season and their accounts for the past three seasons are investigated. As of 2018/2019, clubs are allowed to incur losses for the investigation periods. Table 1 presents the moni-toring periods and acceptable losses for the seasons between 2013/2014 and 2018/2019.
Clubs which fail to meet break-even requirements face a number of sanctions depending on their accounts and financial status. Probable punishments clubs face are as follows (UEFA, 2015):
a) Warning; b) Reprimand; c) Fine;
d) Deduction of points;
e) Withholding of revenues from a UEFA competition;
f) Prohibition on registering new players in UEFA competitions;
g) Restriction on the number of players that a club may register for participa-tion in UEFA competiparticipa-tions, including a financial limit on the overall aggregate cost of the employee benefits expenses of players registered on the A-list for the purposes of UEFA club competitions;
h) Disqualification from competitions in progress and/or exclusion from future competitions;
In addition to the listed measures, UEFA Club Financial Control Body (CFCB) has offered settlement agreements in some cases and given clubs additional time as well as providing roadmaps for resolving financial issues.
So far, a number of clubs have been fined due to their failure to observe FFP regulations which are presented in Table 2.
Table 1
Financial fair play criteria.
Season Investigation seasons Acceptable loss,
million euros 2013/2014 – 2011/2012 2012/2013 45 2014/2015 2011/2012 2012/2013 2013/2014 45 2015/2016 2012/2013 2013/2014 2014/2015 30 2016/2017 2013/2014 2014/2015 2015/2016 30 2017/2018 2014/2015 2015/2016 2016/2017 30 2018/2019 2015/2016 2016/2017 2018/2019 < 30 Source: UEFA. Table 2
Clubs sanctioned by UEFA.
Team Country Team Country
Season 2014/2015 Season 2016/2017
Bursaspor Turkey ASA 2013 Targu Mureş Romania
CFR 1907 Cluj Romania FC Astana Kazakhstan
Ekranas Lithuania FC Dnipro Ukraine
FC Astra Romania Fenerbahçe Turkey
FC Dnipro Ukraine Galatasaray AŞ Turkey
FK Crvena Zvezda Serbia GNK Dinamo Zagreb Croatia Inter Baku Azerbaijan
Season 2015/2016 Trabzonspor AŞ Turkey
ASA 2013 Targu Mureş Romania
Beşiktaş JK Turkey Season 2017/2018
Bursaspor Turkey FC Porto Portugal
CFR 1907 Cluj Romania FK Parizan Serbia
CSKA Sofia Bulgaria Karabükspor Turkey
FC Astra Romania FC Irthys Kazakhstan
FC Botoşani Romania FC Sion Switzerland
FC Dnipro Ukraine FK Vojvodina Serbia
FC Dynamo Moscow Russia Galatasaray AŞ Turkey
FC Honka Finland KF Tirana Albania
FC Krasnodar Russia Maccabi Tel-Aviv Israel
FC Lokomotiv Moskva Russia Panathinaikos Greece
FC Rostov Russia
Hapoel Tel-Aviv Israel Season 2018/2019
Inter Baku Azerbaijan FK Vardar Macedonia
Karabükspor Turkey Levski Sofia Bulgaria
Panathinaikos Greece Sporting Club de Portugal Portugal Ruch Chorzow Poland
SC Braga Portugal
Sporting Club de Portugal Portugal
Note: Detailed information regarding the sanctions can be found at: https://www.uefa.com/insideuefa/ protecting-the-game/club-financial-controlling-body/
Turkish (6), Russian (4), Romanian (3) and Portuguese clubs (3) are the most troublesome clubs when it comes to complying with FFP regulations. The most sanctioned two leagues, Turkey and Russia, are also the highest revenue generat-ing leagues after the Big 5. Despite their high incomes, clubs from Turkey and Russia are failing to meet the FFP requirements.
3. Materials and methods
Data regarding Russian clubs’ transfer activity is gathered for the 12-season period between 07/08 and 18/19 from the German website Transfermarkt.com which has no credibility issues and have been used in academic studies numer-ous times. However, it should be noted that some transfers are completed with undisclosed fees and therefore the data regarding such transfers is unavailable. Out of the 2083 transfers, in the investigated period, 240 of them are transfers with undisclosed fees which were left out of the dataset.
The impact of the treatment on transfer activity is estimated on four different outcome variables which are: T.Exp, T.Bal, NofFree and NofLoans. These are: transfer expenditure, transfer balance, number of free transfers and number of loaned players for each team. Also, to investigate the impact of break-even on wages, a fifth outcome variable is used which is MjrArr — a dummy variable tak-ing the value 1 if the transferred player is an arrival from a major league other than Russia and 0 otherwise. Arrival from a major league is used as a proxy for wages with the underlying assumption that players from major leagues ask for higher wages. The impact on MjrArr will also illustrate the change in the career profiles of the transferred players. Due to the Russian Premier League’s geographical loca-tion and posiloca-tion in European football, players are likely to ask for higher wages when being transferred from the Big 5 or from some other major Western European and South American leagues. Therefore these leagues are included among major league arrivals. Finally, some leagues in the Middle East and Far East pay high salaries in order to attract players, therefore players arriving from these leagues are also included in major league arrivals. The leagues included in major leagues are: Argentina, Belgium, Brazil, China, England, France, Germany, Italy, Japan, Netherlands, Portugal, Qatar, Saudi Arabia, Scotland, Spain and Turkey.
Furthermore, the market value of the transfers is used as a covariate in the esti-mation of the break-even effects on outcome variables. There might be variations in the aggregate transfer expenditures for each team, due to the number of players transferred or due to the quality of the transferred players, from season to season. Using the market value of the transferred players as a covariate enables to control this variation and furthermore since market values are adjusted to inflation, it enables to control inflation in the transfer fees.
Finally, the probable effects of break-even on competitive balance are investi-gated. Out of numerous methods in the literature for measuring the competitive balance, the following three have been chosen due to their usability and popularity:1
1) Coefficient of variation of points; 2) Range of winning percentage; 3) Gini coefficient of points.
The summary statistics for the dataset are provided in Table 3. It should be noted that there are two market value variables, MVagg and MVind which are the
ag-gregate market value of a team’s transfers and the individual market value of each transfer. Aggregate market value is used as a covariate for transfer expenditure, transfer balance, number of free transfers and number of loans whereas individual market value is used as a covariate for major league arrivals.
Since there are no systematic differences between the observations below and above the cutoff point, conducting a RD design is appropriate to estimate the treatment effect and furthermore since the treatment is discontinuous at the cutoff, a sharp RD design is conducted (Stock and Watson, 2015). To decide whether to use parametric or non-parametric methods, normality tests are con-ducted. Table 4 presents the results of the Shapiro–Wilk tests for the outcome variables.
As test results suggest, data is not normally distributed, therefore non-parametric methods are used in the estimation of the policy impact. Following Imbens and Lemieux (2008), the average treatment effect can be estimated through local linear regression with covariates able to be estimated using the following equations: • the model below the cutoff is:
minα,β,δ
∑
i:c–h < Xi < c(Yi – αb – βb(Xi – c) – δi Zi)
2; (1)
• the model above the cutoff is: minα,β,δ
∑
i:c–h < Xi < c+h(Yi – αa – βa(Xi – c) – δi Zi)
2; (2)
Table 3
Summary statistics.
Obs Mean Std Dev Min Max
Pre Post Pre Post Pre Post Pre Post Pre Post
T.Exp 96 96 11.16 8.92 15.04 15.58 0 0 88.76 94.5 T.Bal 96 96 –5.86 0.23 14.2 18.47 –87.01 –78.78 27.60 98.45 NofFree 96 96 5.21 6.25 4.58 5.04 0 0 22 22 NofLoans 96 96 2.27 2.39 2.71 2.25 0 0 12 10 MjrArr 922 921 0.18 0.16 0.38 0.44 0 0 1 1 MVagg 96 96 18.70 24.24 14.11 18.24 0 3.2 67.05 95 MVind 922 921 2.12 1.73 2.76 2.49 0 0 37 20
Source: Author’s calculations.
Table 4
Normality test results
Obs W V Z p-value T.Exp 192 0.69 44.98 8.74 0.00 T.Bal 192 0.73 39.05 8.42 0.00 NofFree 192 0.92 11.39 5.59 0.00 NofLoans 192 0.90 13.74 6.01 0.00 MjrArr 1843 0.99 5.22 4.19 0.00
• therefore, the average treatment effect is: ^μ b(c) = ^αb + ^βb(c – c) = ^αb ; (3) ^μ a(c) = ^αa + ^βa(c – c) = ^αa ; (4) ^ τSRD = ^αa + ^ab , (5)
where Yi is the outcome variable, Xi is the running variable, Zi is a vector of
covariates, c is the cutoff point, h is the bandwidth and ^τSRD is average
treat-ment effect. Equations 1 and 2 are linear regressions to the observations within a distance h on below and above the cutoff point. The optimal bandwidths are obtained following Imbens and Kalyanaraman (2012).
Following the same methodology, the effects of break-even can be estimated using the following local linear regression models on five different outcome variables:
minα,β,δ
∑
i:c – h,c < Xi < c,c + h(T.Expi – αa,b – βa,b(Yeari – c) – δi MVi)
2; (6)
minα,β,δ
∑
i:c – h,c < Xi < c,c + h(T.Bali – αa,b – βa,b(Yeari – c) – δi MVi)
2; (7)
minα,β,δ
∑
i:c – h,c < Xi < c,c + h(NofFreei – αa,b – βa,b(Yeari – c) – δi MVi)
2; (8)
minα,β,δ
∑
i:c – h,c < Xi < c,c + h(NofLoansi – αa,b – βa,b(Yeari – c) – δi MVi)
2; (9)
minα,β,δ
∑
i:c – h,c < Xi < c,c + h(MjrArri – αa,b – βa,b(Yeari – c) – δi MVi)
2. (10)
The policy impact is estimated for transfer expenditure, transfer balance, number of free players, number of loaned players and major league arrivals us-ing market value as a covariate. The cutoff point is 2013, where the clubs were sanctioned for the first time due to failing to meet break-even requirements.
3.1. Checking the validity of the RD design
The external validity of an RD design can be tested by: 1) Checking the continuity at the cutoff,
2) Testing the continuity of the outcome variable at another cutoff,
3) Checking the continuity of the assignment variable’s density at the cutoff (Lee and Lemieux, 2010).
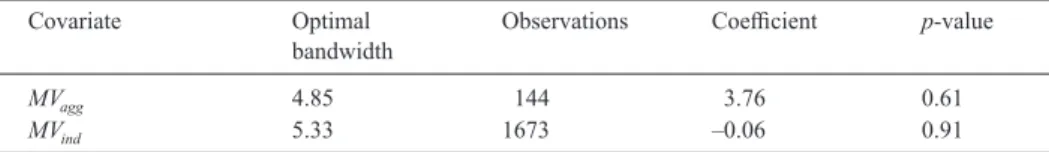
As presented in Table 3, there are two different market value covariates which are tested separately for discontinuity at the cutoff. Table 5 presents the results of the discontinuity checks of MVagg and MVind.
As the results in Table 5 suggests, the treatment effect at the cutoff is not significant for both MVagg and MVind therefore are both continuous at the cutoff.
Table 6 presents the results of the discontinuity check for the outcome variables at 2012. The p-value for NofLoans is 0.05 which indicates signifi-cance at 95% confidence therefore NofLoans fails the discontinuity check. The aver age treatment effect estimation for NofLoans is not presented in the Results section.
The third test for checking the validity of a RD design is to check the continuity of the assignment variable’s density at the cutoff. As Lee and Lemieux (2010) underline: “RD designs can be invalid if individuals can precisely manipulate the assignment variable.” The continuity of the assignment variable density indi-cates that individuals near the cutoff did not manipulate the assignment variable. Since time is the assignment variable in this case, it is not possible for individuals to manipulate, therefore the RD design passes all three tests, hence it is valid.
4. Results
Table 7 presents the results of the RD design for transfer expenditure, trans-fer balance, number of free transtrans-fers and major league arrivals. The coefficient column presents the average treatment effect of the break-even regulation on each outcome variable. Since NofLoans failed the alternative cutoff test, it was left out.
Table 5
Discontinuity checks for covariates. Covariate Optimal
bandwidth Observations Coefficient p-value
MVagg 4.85 144 3.76 0.61
MVind 5.33 1673 –0.06 0.91
Source: Author’s calculations.
Table 6
Discontinuity checks for outcome variables. Alternative cutoff (2012) Optimal
bandwidth Observations Coefficient p-value
T.Exp 4.03 144 –3.05 0.34
T.Bal 4.96 144 2.19 0.55
NofFree 5.04 176 0.19 0.91
NofLoans 3.22 112 2.80 0.05
MjrArr 5.62 1684 0.05 0.50
Source: Author’s calculations.
Table 7
Break-even effects.
Outcome variable Optimal
bandwidth Observations Coefficient p-value
T.Exp 5.22 176 –9.99 0.01
T.Bal 5.26 176 18.83 0.01
NofFree 5.82 176 1.75 0.17
MjrArr 4.24 1372 –0.15 0.01
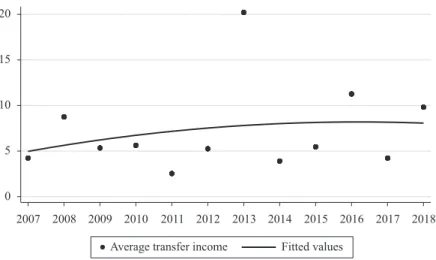
The results suggest that break-even is significantly effective on three of the four outcome variables with expected signs. Transfer expenditure and major league arrivals have been adversely affected by break-even and transfer balance is positively affected. When clubs decreased transfer expenditure, their transfer balance improved as expected but the improvement in transfer balance is greater than the reduction in expenditure. The remainder of the improvement comes from increased transfer income. Fig. 1 plots the average transfer income for Russian clubs in the investigated period.
As can be seen from the Fig. 1 there is an upward trend and in the break-even year the average transfer income skyrocketed in the hope of avoiding FFP sanc-tions yet four clubs failed and were sanctioned due to breaching break-even requirements. Although clubs can’t reduce the wages of the players in their squad, they can offer lower wages to new signings. Since there is no wage data for the Russian Premier League, MjrArr is used as a proxy for wages and the average treatment effect on wages is negative. There is a 15% decrease in the number of players arriving from major leagues; although the exact impact on wages can’t be precisely estimated, it is reasonable to assume that there is a substantial decrease in the wages of new transfers after break-even came into practice.
Although the coefficient of NofFree has the expected value, it is statistically insignificant in any of the acceptable confidence intervals. There is no evidence to suggest that Russian clubs completed more free transfers after break-even.
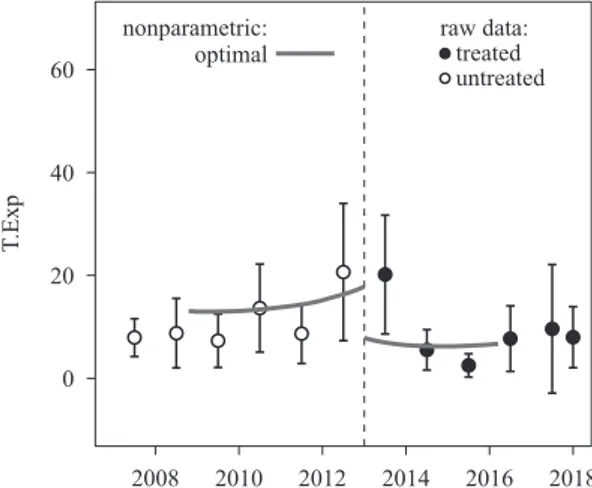
Figs. 2, 3 and 4 present the impact of break-even on transfer expenditure, trans-fer balance and major league arrivals as well as plotting the data bins. Figs. 2, 3 and 4 are the plots of the non-parametric RD design estimations’ results which were presented in Table 7. As the graphs illustrate there is significant discon-tinuity in transfer expenditure, transfer balance and major league arrivals after break-even came into practice in 2013.
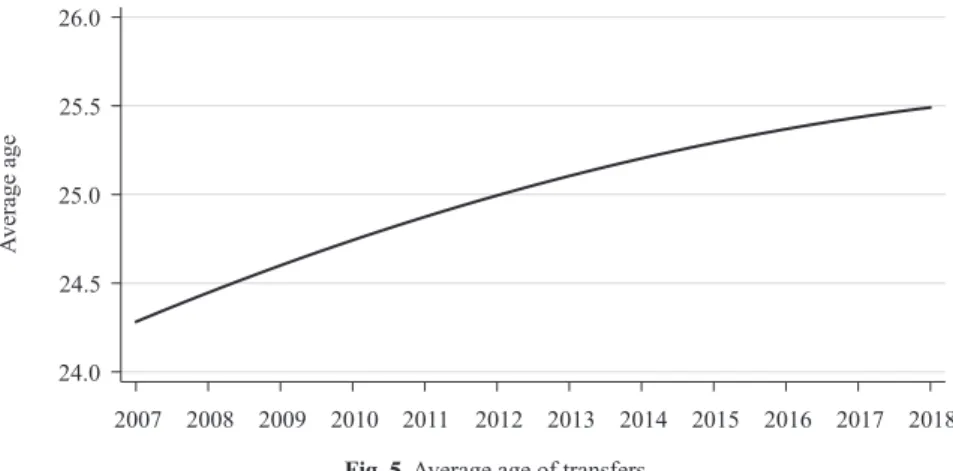
To investigate how break-even affected the demographics of transfers, in the Russian Premier League, the average age of transfers and the number of new under 21 (U21) and over 32 (O32) arrivals to the league are investigated. Fig. 5
Fig. 1. Average transfer income.
Fig. 2. Policy impact on transfer expenditure.
Source: Author’s calculations.
Fig. 3. Policy impact on transfer balance.
Source: Author’s calculations.
Fig. 4. Policy impact on major league arrivals.
illustrates the average age of transfers and Fig. 6 illustrates the number of U21 and O32 new arrivals.
The break-even did not have any effect on the average age of the transfers. However after break-even, the number of youngsters transferred by Russian clubs started to increase whereas there is no significant change in the number of O32 players.
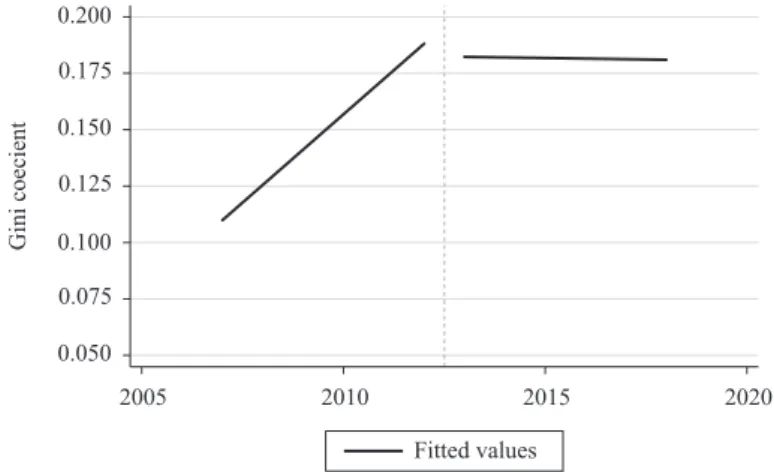
Figs. 7, 8 and 9 present the fitted values for coefficient of variation of points, range of winning percentages and Gini coefficient of points whereas Table 8 presents the average value for each measure in pre and post break-even periods.
Fig. 5. Average age of transfers.
Source: Author’s calculations.
Fig. 6. Newcomers to Russian Premier League.
Source: Author’s calculations.
Table 8
Measures of competitive balance in pre and post break-even periods.
Measure 2007–2008/2013–2013 2013–2014/2017–2018
Coefficient of variation of points 0.308 0.334 Range of winning percentages 0.473 0.495
Gini coefficient of points 0.149 0.182
Fig. 7. Coefficient of variation of points.
Source: Author’s calculations.
Fig. 8. Range of winning percentage.
Source: Author’s calculations.
Fig. 9. Gini coefficient of points.
5. Discussion
With the introduction of break-even, non-Big 5 clubs have been sanctioned numerous times as displayed in Table 2. In the investigated twelve-year period Russian clubs spent 1.93 billion euros on transfers which makes the Russian Premier League the sixth highest spending league in this period.2 In the hope of
keeping up with the teams of Big 5, Russian clubs over-spent on transfers and wages which led to the accumulation of debts that resulted in failing to meet FFP requirements, hence sanctions.
The immediate reaction for break-even is to cut expenses which reflects on transfer expenditure, therefore the Russian clubs reduced their transfer expendi-tures as Table 7 and Fig. 2 suggest. The aggregate transfer expenditure decreased almost 10 million euros on average due to break-even and the transfer balance improved by almost 19 million euros. The remaining improvement in the transfer balance is due to the increasing transfer income as Fig. 1 illustrates. However, the initial efforts in order to conform to break-even were not enough for some of the clubs. All of the four Russian teams, sanctioned due to breaching break-even, were punished in the 2015/2016 season because of recording losses of more than 30 million euros in total in the 2012/2013, 2013/2014 and 2014/2015 seasons.
An increase in the number of free transfers was an anticipated spill-over effect. However it is statistically insignificant, therefore the spill-over cannot be vali-dated. As mentioned earlier, Russian clubs have a 70% wage-to-revenue ratio and therefore wages are the top element of cost. Although preferring free transfers over paid transfer would reduce transfer expenditure, players’ salaries have to be paid which would increase the total cost. Often, teams of non-Big 5 have to pay huge salaries to attract players from the Big 5 leagues and some other major leagues. To investigate Russian clubs’ efforts to reduce wages and to examine how the career profiles of transfers have changed after break-even, the impact on MjrArr is estimated. As data in Table 7 illustrates, there is a 15% decrease in the number of players which arrived from the major leagues. This indicates two crucial points. In order to reduce their wage bills, Russian clubs started transfer-ring players from lesser leagues which might also indicate that the quality and the popularity of transfers have decreased after break-even came into practice.
Figs. 5 and 6 present the average age of the transfers and the number of U21 and O32 newcomers to the league. The average age of transfers is increasing and there is no break-even impact on it, however, after break-even Russian clubs started transferring more U21 players. First, U21 players are relatively cheaper and second, they might turn into transfer income in the following years if clubs can manage to improve them. Since the number of U21 players is increasing as well as the average age of transfers, it can be concluded that although Russian clubs are transferring few O32 players, they are transferring relatively older players.
Although break-even affects all clubs, those with lower revenues are affected more since break-even limits clubs’ expenditure so that it is commensurate with their income. Giants of the league such as Zenit, Spartak Moscow, Lokomotiv Moscow and CSKA Moscow, have more revenue to spare on wages and transfer
2 https://www.transfermarkt.com/transfers/transfersalden/statistik/plus/0?sa=&saison_id=2007&saison_id_
expenditure, whereas teams with lower income are on tighter budgets. Since teams with lower revenues cannot overspend and accumulate debt after break-even they are less able to compete with the giants of the league. As Table 8 and Figs. 7, 8, 9 suggest the competitive balance deteriorated, in all of the three measures, after break-even in the Russian Premier League. Vöpel (2011) argues that FFP will improve the competitive balance among the leading teams and that is the case in the Russian Premier League. In the post-break-even period, the four giants of the league were all able to win the title. However in the pre-break-even period, Rubin Kazan was able to win the title twice for the first time in their 70-year history. Rubin Kazan has become a regular relegation fighter since break-even. There are huge revenue gaps among teams and break-even limits teams’ expendi-ture, therefore surprise winners are less likely to occur in the coming years.
When UEFA introduced the FFP regulations, the primary objective was to improve the sustainability of football in Europe. Although FFP improves the fi-nancial sustainability of football, the sustainability of competition is as impor-tant. As the previous studies and this one suggests, FFP might be undermining the competitive balance which should not be disregarded.
6. Conclusion
This study provides empirical evidence regarding the influence of break-even regulation using evidence from the Russian Premier League. Break-even did not only force clubs to improve their finances but also affected the demographics of the transfers and the competitive balance in the Russian Premier League. The limit on clubs’ expenditure causes teams with lower revenues to transfer either younger or relatively lower profile players. Clubs which fail to find young and relatively cheaper talent will fail in inter-European competitions. In the case of the Russian Premier League, the competitive balance deteriorated in favor of the giants of the league. The latter have higher revenues, therefore they are able to spend more which causes the gap between them and lesser teams in the league to widen. The importance of success in domestic competitions is increasing in order to generate revenue, especially for the non-Big 5 leagues.
The long-term survival of clubs depends on their ability to prevent the ac-cumulation of debt. The stakes have grown too high over the last few decades in European football. A number of clubs, which failed to meet the financial regula-tions, have been sanctioned by UEFA and as a result they had to cut their costs which reflected on their transfer expenditures. Russian Premier League teams have experienced significant reductions in their transfer expenditures in order to comply with regulations. Although the decision has not been finalized yet, Manchester City, the first Big 5 team to get sanctioned, has been banned from UEFA competitions for failing to meet the FFP requirements. Not only clubs from other leagues but also from the Big 5 are in danger.
The financial health of the clubs from other leagues affects European football as a whole. In the 2018/2019 season, more than half of all registered players in both the English Premier League3 and German Bundesliga4 are foreigners and
3 https://www.transfermarkt.com/premier-league/startseite/wettbewerb/GB1 4 https://www.transfermarkt.com/1-bundesliga/startseite/wettbewerb/L1
most of these players come from Europe’s smaller leagues. The financial health of the clubs from smaller leagues is crucial for the sustainability of European football. As smaller league clubs improve their finances they will be able to compete with the giants of Europe, hence increasing the competitive balance. In this sense, Portuguese, Dutch, Russian and Turkish clubs are the first candidates in line to achieve something big in UEFA competitions. These leagues have higher competitive power both on and off the field compared to other small leagues.
European football clubs are going through a transition period and the ones who successfully complete their financial transition will eventually complete their competitive transition.
Acknowledgements
I would like to thank Fırat Bilgel for his valuable comments and suggestions.
References
Charyev, G. (2016). Consequences of the limit on foreign players in Russian football. Soccer & Society, 17(4), 571–587. https://doi.org/10.1080/14660970.2014.980727
Coates, D., Naidenova, Iu., & Parshakov, P. (2017). Determinants of Russian football club brands. International Journal of Sports Finance, 12(4), 321–341.
Deloitte (2019, May). Annual review of football finance 2019. Deloitte Sports Business Group. Drut, B., & Raballand, G. (2012). Why does financial regulation matter for European professional
football clubs? International Journal of Sports Management and Marketing, 11(1/2), 73–88. https://doi.org/10.1504/IJSMM.2012.045488
Dupont, J.-L. (2013). Football’s anticompetitive streak. Wall Street Journal, March 25.
Feess, E., & Mühlheußer, G. (2002). Economic consequences of transfer fee regulations in European football. European Journal of Law and Economics, 13, 221–237. https://doi. org/10.1023/A:1014722600686
Flanagan, C. (2013). A tricky European fixture: An assessment of UEFA’s Financial Fair Play regulations and their compatibility with EU law. International Sports Law Journal, 13(1–2), 148–167. https://doi.org/10.1007/s40318-013-0006-4
Frick, B. (2007). The football players’ labor market: Empirical evidence from the major European leagues. Scottish Journal of Political Economy, 54(3), 422–446. https://doi.org/10.1111/j.1467-9485.2007.00423.x
Goossens, K. (2006). Competitive balance in European football: Comparison by adapting measures: National measure of seasonal imbalance and top 3. Rivista di Diritto ed Economia dello Sport, 2(2), 77–122.
Hon, L. Y., & Parinduri, R. (2016). Does the three-point rule make soccer more exciting? Evidence from a regression discontinuity design. Journal of Sports Economics, 17(4), 377–395. https:// doi.org/10.1177/1527002514531790
Imbens, G., & Kalyanaraman, K. (2012). Optimal bandwidth choice for the regression discontinuity estimator. Review of Economic Studies, 79(3), 933–959. https://doi.org/10.1093/restud/rdr043 Imbens, G., & Lemieux, T. (2008). Regression discontinuity designs: A guide to practice. Journal of
Econometrics, 142(2), 615–635. https://doi.org/10.1016/j.jeconom.2007.05.001
Keefer, Q. (2014). Rank-based groupings and decision making: A regression discontinuity analysis of the NFL draft rounds and rookie compensation. Journal of Sports Economics, 17(7), 748–762. https://doi.org/10.1177/1527002514541448
Lee, D., & Lemieux, T. (2010). Regression discontinuity designs in economics. Journal of Economic Literature, 48(2), 281–355. https://doi.org/10.1257/jel.48.2.281
Madden, P. (2015). Welfare economics of ‘‘Financial Fair Play’’ in a sports league with benefactor owners. Journal of Sports Economics, 16(12), 159–184. https://doi. org/10.1177/1527002512465759
Mourao, P. R. (2016). Soccer transfers, team efficiency and the sports cycle in the most valued European soccer leagues — have European soccer teams been efficient in trading players? Applied Economics, 48(56), 5513–5524. https://doi.org/10.1080/00036846.2016.1178851 Özaydın, S., & Aksu, Y. E. (2019). The effects of foreign player regulations on player productivity
in the Turkish Super League. Journal of Research in Economics, 3(2), 177–191. https://doi. org/10.35333/JORE.2019.54
Peeters, T., & Szymanski, S. (2014). Financial fair play and its effect on European football. Economic Policy, 29(78) 343–390. https://doi.org/10.1111/1468-0327.12031
Radoman, M. (2015). Labor market implications of institutional changes in European football: The Bosman ruling and its effect on productivity and career duration of players. Journal of Sports Economics, 18(7), 1–22. https://doi.org/10.1177/1527002515594555
Simmons, R. (1997). Implications of the Bosman ruling for football transfer markets. Economic Affairs, 17(3), 13–18. https://doi.org/10.1111/1468-0270.00036
Stock, J., & Watson, M. (2015). Introduction to econometrics. Pearson Education.
Thistlethwaite, D., & Campbell, D. (1960). Regression-discontinuity analysis: An alternative to the ex post facto experiment. Journal of Educational Psychology, 51(6), 309–317. https://doi. org/10.1037/h0044319
UEFA (2015). Financial fair play: All you need to know. https://www.uefa.com/community/news/ newsid=2064391.html
Vöpel, H. (2011). Do we really need financial fair play in European club football? An economic analysis. CESifo DICE Report, 9(3), 54–59.
Zelenkov, Y., & Solntsev, I. (2017). Measuring the efficiency of Russian Football Premier League clubs. Electronic Journal of Applied Statistical Analysis, 10(3), 773–789.