An Assessment of Environmental Sustainability Corridor: The Role of
Economic Expansion and Research and Development in EU Countries
Festus Fatai Adedoyina
aDepartment of Accounting, Economics and Finance, Bournemouth University, United Kingdom
Email: [email protected]
Andrew Adewale Alola b, c
bFaculty of Economics Administrative and Social sciences, Istanbul Gelisim University, Istanbul, Turkey.
cDepartment of Financial Technologies, South Ural State University, Chelyabinsk, Russia
E-mail: [email protected]
Festus Victor Bekun b,d
bFaculty of Economics Administrative and Social sciences, Istanbul Gelisim University, Istanbul, Turkey
dDepartment of Accounting, Analysis and Audit School of Economics and Management South Ural State University, 76, Lenin Aven.,
Chelyabinsk, Russia 454080. E-mail: [email protected]
Abstract
Given that the European Union-28 countries proposed a target of 3% of the Gross Domestic Product on research and development (R&D) expenditure by 2020, the current study attempts to examine the role of R&D on environmental sustainability. In addition, the study further investigates the long-run and causal interaction between, renewable energy consumption, nonrenewable energy consumption, and economic growth in an ecological footprint-income function. Notably, the study incorporates research and development (R&D) expenditure to the model as an additional variable, and measures impact of each variable on ecological footprint. Empirical evidence is based on a balanced panel data between annual periods of 1997–2014 for selected EU-16 countries. The Pedroni, Johansen Multivariate and Kao tests all reveal a
cointegration between ecological footprint, economic growth, research and development expenditure, renewable, and nonrenewable energy consumption. The Fully Modified and Dynamic Ordinary Least Squares models (FMOLS and DOLS) both suggest a negative significant relationship between the countries’ research and development expenditure and ecological footprint in the long-run. This implies that spending on R&D significantly impacts on environmental sustainability of the panel countries. Our study affirms that nonrenewable energy consumption and economic growth increase carbon emission flaring while renewable energy consumption declines ecological footprint. The panel causality analysis reveals a feedback mechanism between ecological footprint, R&D expenditure, renewable, and nonrenewable energy consumption. We further observed a one-way causality between ecological footprint and economic growth. The current further validates that the Environmental Kuznet Curve Hypothesis (EKC) holds for this panel of EU countries examined. Effective policy implications could be drawn toward modern and environmentally friendly energy sources, especially in attaining the Sustainable Development Goals via spending on R&D.
Keywords: Economic growth; non-renewable energy consumption; panel econometrics;
renewable energy consumption; research and development; EU
1. Introduction
Consumption of energy has become increasingly beneficial in the advancement of many economies in the 21st century. Global dependence on the energy sector as a driver in the development processes has led to an increased level of the world's demand for energy (Ozcan and Ozturk, 2019). Among other factors, rise in energy consumption is connected to significant rise in population (Feng et al., 2018) as well as increasing drive for growth and urbanisation among nations particularly the emerging economies. This has further led to the depletion of the environment, thereby threatening the ecological balance of the biosphere (Chu et al., 2017; Alola, 2019a, b; Bekun, Emir & Sarkodie; Saint Akadiri et al., 2019).
Additionally, in a bid to achieve industrial expansion and growth, many economies are forced to meet up their increasing energy demands through non-renewable energy (NRE) sources to mitigate adverse environmental consequences. According to Nathaniel & Nathaniel (2019), industrial growth do not only increasesenergy use but equally increases the level of environmental degradation through emissions of toxic gases chiefly from nonrenewable
energy. The reason is partly due to the little share of eco-friendly renewable energy sources in the global energy market in relation to NRE sources (Ozcan and Ozturk, 2019). Consequently, negative externalities have been generated in the form of carbon emissions, resource depletion, pollution, wildlife endangerment, climate changes and global warming (Hanif et al., 2019).
The discourse on energy consumption as one of the main denominators in global economic advancement has, therefore, generated a tripartite relationship between natural resources, environment and economy. The implication of this interdependency is that, for sustainability, there is a need to live within nature’s carrying capacity (Zhao et al., 2005). This is because the world relies on the ecosystems to provide beneficial resources in terms of goods and services; ranging from nutrient cycling, clean air and erosion control to food production and spiritual/religious experiences (Feng et al., 2018). The UN’s sustainable development goals of poverty eradication, individual wellbeing, jobs and economic growth, food security and access to pipe-borne water supply, industrialization and consumption are also hinged upon the natural environment (Asumadu Sarkodie and Strezov, 2018). Therefore, it is imperative to defend the biocapacity of the environment against the negative externalities generated in production and consumption for sustainability.
Furthermore, since humanity depends on the natural ecosystem for all its economic and social endeavours, the environment has given liberty to harness natural capital. The productive action of man on the natural capital such as land water bodies as well as their sustainability is coined as economic footprint (EF). Wackernagel and Rees (1996) popularized and used the concept in 1996 to mean man’s required amount of the earth's ecosystems in relation to its regenerative capacity. In other words, EF juxtaposes human load with the earth’s carrying capacity (Wackernagel, 2002).
In this regard, EF not only measure human demand for natural resources and environmental sustainability (Siche et al., 2008), but is also used to denote the population’s impact expressed in terms of the appropriate land area necessarily needed to meet up human consumption as well as to sequester the wastefulness arising from such consumption (Wackernagel and Rees, 1996). This land area according to Bazan (1997) represents the total area required by humans for all life endeavours ranging from agriculture, manufacturing, transportation, leisure etc. Simply put, EF presents an analysis or measures of the total land area required for a given population to exist in a sustainable manner. In addition, EF estimates the total area of land including required sea area needed to regenerate whatever natural
resources consumed by man so as to reverse the corresponding waste and to render it harmless to the ecosystem (Sonu et al., 2011).
Similarly, the EF as an analytical tool aids in evaluating man’s actions and consequences on environmental sustainability. For example, it is necessarily required that as we consume or burn fuel in our various combustion engines, we allocate and grow certain land area of a woodlot that will reverse or cushion the effect of carbon emission generated. EF is measured in a similar way as consumption is measured in microeconomics i.e. by summing up the basket of commodities in the economy – consumer durables and non-durables and services as well as their associated waste, which is converted into a common factor after adjusting for their biological productivity (Sonu et al., 2011). As at 1996, Wackernagel and Rees (1996) pointed that the US has the highest EF per capita of 11 acres which suggests that the country was faced with 80% ecological deficit, in contrast with European countries which required around 5 acres. However, Europeans faced higher ecological deficits because they have smaller land areas (Bazan, 1997). Interestingly, much has changed afterwards particularly in the EU, as research has intensified owing to the fact that EF is not only a benchmark for today's ecological performance (Wackernagel, 2002), but has a direct bearing with the level of economic growth.
Apart from energy consumption, several factors can drive EF, among which is increased levels of government expenditure on Research and Development (R&D) which may have directly generated a significant increase in the economic performance of the EU over time. However, the accompanying increase in EF shows the unsustainability of the economic expansion of the EU, hence, the upward trend in the EF curve (see Figure 1). The global economic crisis coupled with the EU debt crises could not be unconnected with the downward trend seen in growth levels from 2008 to 2010 (Figure 1). During this period, the EU reduced or maintain current levels of R&D expenditures in order to maintain fiscal balance (Zafar et al., 2019b). The direct relationship between economic growth and EF throughout the period confirms the hypothesis that EF is a consequence of economic growth due to its interconnectedness with energy consumption and production. Galli (2015) opined that per capita footprint increased in high-income countries as an indication of improved living standards.
<Insert Figure 1>
Owing to the fact that EF signifies the carrying capacity of the biosphere (biocapacity), human energy demand that exceeds this ecological budget (Galli, 2015) is tantamount to
environmental degradation. Hence, if current consumption levels are maintained, the world will be required to expand 2.6 folds in order to accommodate our ecological needs by 2050. This is called ecological overshoot i.e. the depletion of natural capital. Consequently, the EF of production approaches the biocapacity, the ecological deficit widens, and the global biosphere or environment is stressed in the wake of heightened degradation (Siche et al., 2008). This is because higher EF connotes increased environmental damage resulting from human activities and represents the nexus between the EF and the environment.
In other to adequately account for the environmental impact of energy consumption and production, another popular measure is the Environmental Performance Index (EPI). EPI reveals a country’s commitment to environmental wellbeing as well as its natural resource sustainability. This measure ranks 180 countries on 24 performance indicators across ten categories covering two essential dimensions of sustainable development, namely environmental health and ecosystem vitality (Ozcan et al., 2019). Both the EPI and EF have currently become popular environmental performance indicators used as bases for identifying, setting and evaluating environmental policies and goals (Wackernagel 2002; Ulucak & Apergis 2018). In this study, our choice of EF is due to data availability and its growing relevance in recent studies.
Theoretically, the bell-shaped Environmental Kuznets Curve (EKC) has hypothesised, that the level of environmental pollution increases as the economy expands up to the optimum point of economic growth after which both pollution and growth levels decline (Hassan et al., 2019). The assumption here is that the derive for growth has led to the increased demand for non-renewable energy consumption (NREC) i.e. fossil fuels which has an attendant effect of increased pollution. However, after attaining the optimal growth level, the economy becomes technologically advanced and is able to transit to the utilisation of RE in order to reduce pollution.
Consequently, the EF of the economy is reduced as well as its pace of economic growth. The implication here is that, for an economy to reduce its EF, through a transition from NREC to renewable energy consumption (REC), the opportunity cost is reduction in output expansion. Wasif, Shahbaz, Hou, & Sinha (2019) pointed that, this ecologically desirable transition is made possible through increased funding in R&D particularly in renewable energy. Additionally, the transition is empirically tested by Asumadu & Adams (2018) with South Africa as a case study where the country attained the optimum turning point in 2011. Presently,
the global call for cleaner energy source is gaining prominence as it shapes the agenda of global integration. This has led to greater commitment among nations to transit from NREC to REC.
<Insert Figure. 2>
As major global players on the issue of global warming, Figure 2 shows that countries in the EU have demonstrated commitment towards this course by constantly decreasing its demand for NREC and increasing REC. With the exception of 2010, NREC has continually decreased right from 2005 to 2014 in the region. This is not unconnected with the increasing levels of REC. The inverse relationship between REC and NREC in the EU is a clear indication of readiness of the EU to substitute the latter with the former in the drive for promoting a cleaner and more sustainable ecosystem. Interestingly, the transition effort of the EU has yielded fruit as it has reduced the EF (see 2004 to 2014 in Figure 1).
Previous studies on the EU have shown the importance of the transition from NREC to REC in order to cushion the ever-increasing devastating effect of EF, nonetheless, the impact of R&D on this transition is enormous as evidently seen in Figure 1 and 2. However, the contribution of investment in R&D to improve EF has received little attention. Hence, this work is motivated by considering the impact of R&D expenditure in the energy consumption-EF-growth nexus. Furthermore, owing to the fact that there is divergence in energy consumption, EF and income among the EU, delineating this existing variance in EF, REC, NREC and R&D expenditure will aid our understanding of energy mix. In this current study, effort is geared in addressing this gap. Thus, the present study add to the body of knowledge in terms of scope by considering the EU in a broader perspective by disaggregating energy consumption into renewable and non-reneable energy consumption in an ecological footprint- income setting while accounting for other covariates to avoid omitted variables bias. We seek to investigate if any long-run relationship exist between the outlined varibles and what direction of causality flow exist among the variables under consideration for adequate policy construction. These will inform the EU’s policy, particularly as regards its finance on R&D needed for the transition to a more ecologically friendly and sustainable source of energy as well as guide the union on where to intervene and by how much in order to achieve a greener region.
The remainder of this study is organized as follows: The upcoming section presents the review of related literature in a stylized pattern offered in Section 2. Section 3 provides the data
and methodological path applied in the course of the study. Subsequently, Section 4 focuses on the interpretation of empirical results. Finally, Section 5 renders the concluding remarks.
2. Literature Review
2.1 Ecological Footprint, Renewable and Non-renewable Energy Consumption
The quest for a solution to the climate crisis has led to a global transition to a more efficient and sustainable renewable energy system (Info, 2019). This phenomenon has engaged researchers in the scientific community with the view of proffering lasting solutions that will shape the global policy directions in maintaining eco-balance.
Tables A.1 and A.2 (see appendix) give a synopsis of some selected related literature each of which has its own peculiarities in its scientific process. According to Lei & Zhou (2012), it is population and inefficient energy consumption that are responsible for the worsening of the global EF at least in the 17 countries they studied across the globe. Sarkodie & Strezov (2018) studied Australian economy from 1974 – 2013 with the help of FMOLS and came to the conclusion that while NREC, increases the countries EF through increased CO2 emission, REC proves to promote environmental sustainability by cutting emissions.
In the work of Jr & Lin (2016) conducted on the panel data of 34 African countries, the estimates from the dynamic panel data models show the primacy of REC and NREC on the EF through the countries’ level of economic performance. Simply put, the increased levels of economic performance arising from the increased utilisation of NRE worsens country’s EF. Notwithstanding, even countries that utilise RE experience a high level of economic performance as evidently shown in the wok of Shahbaz, Loganathan, & Zeshan, (2015) conducted in Pakistan.
Interestingly, countries whose economy has high utilisation of RE have cleaner environment and low EF. On the issue of EF and NREC nexus, the story of the 46 SSA studied by Acheampong, Adams, & Boateng, (2019) affirmed that the level of growth arising from NREC is capable of generating higher EF in the region as a result of increased levels of CO2 emissions. This supposition is contained in Liu, Zhang, & Bae (2017a) in their analysis of the economic performance of Association of Southeast Asian Nations (ASEAN-4: Indonesia, Malaysia, the Philippines, and Thailand) in relation to their energy consumption and EF. From 1970 – 2013, it was ascertained that REC and agriculture decrease CO2 as NREC worsens the
association’s EF. However, that is not the case with the BRICS agricultural industry as it induces CO2 emissions (Liu, Zhang, & Bae, (2017).
Similarly, in Latin America, Al-mulali, Fereidouni, & Lee (2014) reported that REC performs better in spurring the economies of the continent than NREC due to efficiency issues. To continue enjoying the prosperity of growth, the 18 Americas are advised to intensify investment in RE so as to reduce their dependence on fossil fuel as well as ensure energy security. In the same vein, Feng et al., (2018) in China buttress that, high GDP values are associated with ecosystem service deficit (ESD) and vice versa (Long, Yaw, Du, & Zhuang (2015); Feng et al., (2018)). Interestingly, the more recent work of Ozcan, Tzeremes, & Tzeremes, (2019) conducted on 35 OECD countries with the help of GMM-PVAR model from 2000–2014 supports the position of Feng et al., (2018).The authors reported that Increased GDP levels worsen countries’ ecological indices largely attributable to the use of fossil fuel or NRE in powering the economies.
Charfeddine & Kahia, (2019) studied 24 of the Middle East and North African (MENA) countries 1980 – 2015 using PVAR. While REC was seen to have a positive influence on economic growth, its contribution is regarded as weak on the EF of the countries as far as the issue of environmental quality is concerned. However, they considered REC as an effective and lasting solution to curbing CO2 emissions. It is therefore imperative, to invest in green energy projects.
Having conducted an extensive study of 74 countries using Westerlund (2007) bootstrap cointegration, Pedroni co-integration, FMOLS and heterogeneous Panel causality techniques, Sharif, Ali, Ozturk, & Afshan (2019) realized that, in the quest for growth, REC and NREC by countries have positive and negative effects on the environment respectively. Comparatively, Jorgenson & Clark (2011), differ on this. They opined that economic growth has no direct bearing with EF at least in the 65 Countries they have studied across the globe.
Boontome, Therdyothin, & Chontanawat (2017) observed that, during the period 1971-2013, the pursuit of economic growth has led the Thailand economy into increasing its NREC level thereby worsening its performance on EF. In South Africa, Nathaniel & Nathaniel (2019) found a unidirectional causality from the economy to EF. This increased level of environmental degradation is not unconnected with the increased level of NREC in the country during the period under review. The study of Hanif et al. (2019) among 25 Middle-income countries of
the world reveals the devastating effect of NREC on the countries’ EF by depleting natural resource.
The transition from NREC to REC appears to be a possible solution to the unsustainable level of environmental degradation regionally and globally (Acheampong, Adams, & Boateng, 2019). Recently, Ulucak & Apergis (2018) employed the Club clustering approach on EU economies to ascertain their level of convergence in their individual EF performance as a club and found that the EF of EU tends to converge. Furthermore, Pradhan et al(2018) empirical using panel vector error correction model explored the nexus between energy consumption pattern and economic growth in a panel setting of 35 financial action task force countries. The empirical findings validate the significant impact of both energy consumption and development financial sector for increase economic expansion in the blocs investigated. For the BRICS case, Ozturk and Al-Mulali (2019) explore the theme of the interaction between economic growth and air pollutant while accounting for the role of urbanization and trade openness. Empirical results affirms that urbanization, economic expansion re determinant of pollutant emission over the sampled period.
2.2 Impact of Research and Development Expenditure on Ecological Footprint
It is evidently shown that increasing funding in RE in the areas R&D for innovative particularly in countries that have a comparative advantage in green energy (such as biomass, biogas, hydro, solar and solid waste) will ensure a cleaner and more sustainable biosphere (Charfeddine & Kahia, 2019). The work of Wasif, Shahbaz, Hou, & Sinha (2019) in Asia-Pacific Economic Cooperation (APEC) countries corroborates this. Having employed Continuously Updated Fully Modified Ordinary Least Square (CUPFM) on the energy-related data of the APEC countries from 1990-2015, it was established that the region’s expenditure on R&D is a primal factor that gears transition from NREC to REC which will enhance their EF index.
The transition from NREC to REC ensures lower EF. This is the submission of Jr & Lin (2017), as they studied 12 East African countries with the help of Dynamic Panel Data Models. This is because the transition to REC reduces CO2 emissions as seen in china from 1991–2009 (Zhang et al., 2012). Although, R&D is essential in the promotion of economic activities in the G20 Countries from 1997 - 2013, (Sikder, Inekwe, & Bhattacharya (2019), if tried in South Korea, the investment has a tendency to fail in the next two decades unless if its channelled to the development of waste energy sub-industry. This is because it has the capacity
of cutting emissions more than any of the sources of green energy (Wind energy, Photovoltaic energy, Marine energy, Biomass energy) (Sim & Kim, 2019)
Summarily, the global attention that this subject matter has attracted particularly in recent years has been very engaging. As a result, there exists a plethora of literature covering wide range of strands in this field ranging from, the relationships between renewable and non-renewable energy consumption on growth, testing the EKC hypothesis, NREC and the rate of CO2 emissions, REC and environmental sustainability, EF and the biocapacity among others. Owing to the fact that EF and other energy and environmentally related issues vary across nations of different income bracket, the studies conducted have global outlook as they cover OECD, the G20, BRICS, East and sub-Saharan Africa, the EU and Asian-Pacific countries.
2.3 Study Hypotheses
There seems to be more convergence than divergence in results reported by researchers across nations of any similar strand. However, there are areas of conflicting results. These inconsistencies are a product of the research process; variables employed, countries involved, time dimension and methodological tools deployed. The current study brideg the identified gap by exploring the trade off between income level and pollutant emission measure by a broader indicator (ecological footprint) for the case of EU. Thus, the following hypothesis are set forth in the course of this study
Hypothesis (1)
Ha : There a long-run (equilibrium) relationship betwwen the outlined variables under review Hb: There is no equilibrium relationship between the outlined variables under review
Hypothesis (2)
Ha : There a exist Granger causality relationship betwwen the outlined variables under review Hb: There is no Granger causality relationship betwwen the outlined variables under review
3. Methodology
3.1 Data
Our study utilizes balanced and yearly data from 1997 to 2014 of the estimated series for 16 EU countries (Austria, Belgium, Bulgaria, Cyprus, Denmark, Finland, France, Germany, Greece, Ireland, Italy, Netherlands, Portugal, Spain, Sweden, and United Kingdom). The choice of countries and data is largely due to volume of research and development expenditure
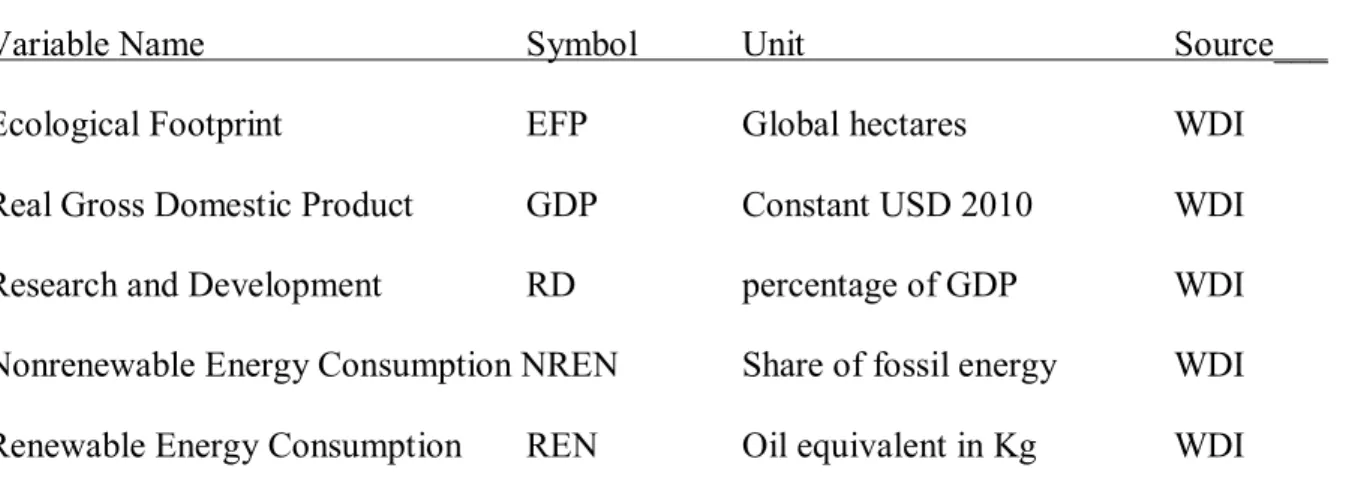
and limited data on renewable energy consumption respectively. The estimation model uses ecological footprint (EFP) (Global hectares) as the dependent variable. This is explained by the following explanatory variables: Real Gross Domestic Product(GDP) (measured in constant US$); Expenditure on Research and Development (RD) (as a percentage of GDP); Nonrenewable Energy Consumption (NREN) (which is given as a share of fossil energy); and Renewable Energy Consumption (REN) (measured as Oil equivalent in Kg). Table 1 gives a summary of the data series, all sourced from the World Bank (2018) Development Indicator. Also, unobserved components are controlled for in the empirical model using real GDP per capita.
<Insert table 1>
3.2 Model Estimation
Although a number of studies have jointly assessed the link among renewable energy consumption, non-renewable energy consumption, and some form of research and development expenditure such as R&D investment, labour and capital, and technological growth, (Sikder et al., 2019; Sim and Kim, 2019; Zafar et al., 2019a; Zhang et al., 2013), this study differs by applying the concept for selected EU countries. More importantly, our paper observe this nexus using ecological footprint instead of CO2 emissions and Real GDP as dependent variables so as to present some novelty different from earlier studies on R&D-RGDP-Emissions nexus such that:
= ( , , , ) (1)
= + + + + + (2)
In order to ensure a constant variance across all series, the study utilizes logarithimic transformation on all variables, where lnEFPit, lnGDPit, lnNRENit, lnRENit and lnRDit,
represent the logarithimic transformation of all variables, and , and ’s represent the stochastic, intercept, and partial slope coefficients respectively. Additionally, the study further investigate the validity of EKC hypothesis for the panel of EU countries such that the model
(equation) is presented as = ( , , , , ).
Given that usual ARDL models are unable to correct for potential bias that arise from mean-differenced explanatory factors as well as the white noise term, we utilize two methods, FMOLS and DOLS, proposed by Pedroni (2004, 2001) and Kao and Chiang (2000), respectively. The DOLS not only correct for any correlation between the dependent variable and the error ter, but also add lags of the independent variables. Prior to choosing these
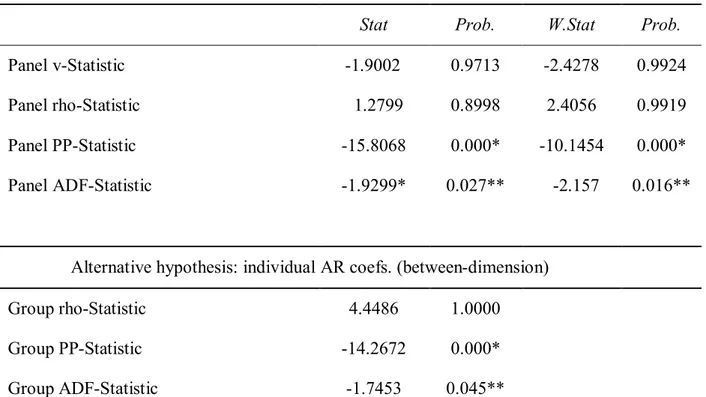
estimation methods, a pre-test to examine panel cointegration, using tests by Pedroni (1999), Kao (1999) and Søren (1991) was carried out. All three tests provide significant evidence of cointegration i.e. long-run relationship among the variables as shown in Table 5. Consequently, in the spirit of Yao et al. (2019), equation 3 gives the group-mean panel FMOLS estimator as:
∗ = ∑
,
∗ (3)
,
∗ is given as the standard estimator of the ith member of the panel for the FMOLS and the related group-mean t-statistic is estimated as:
∗ = ∑
,
∗ (4)
Also, the dynamic OLS equation which includes lead and lag differences of the independent variable and controls for endogeneous feedback effect is given as:
= + + + + + ∆ + ∝ ∆ + ∆ + ∅ ∆ + (5) ∗ = ∑ , ∗ (6) ∗ = √ ∑ ∗, (7)
Where Ki and -Ki are lead and lag orders respectively. Equation 6 and 7 are the group-mean
panel DOLS equations (with ∗, as the standard estimator of DOLS of the ith member of the panel) and associated t-statistic respectively.
4. Results and Discussion
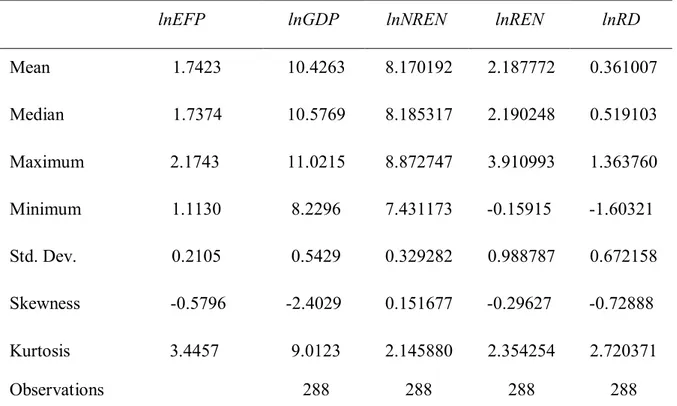
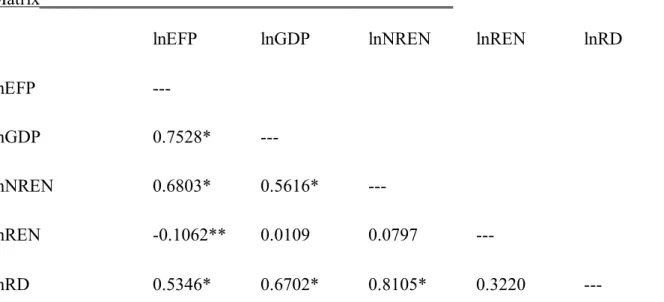
4.1 Descriptive statistics and correlation
The descriptive statistics of the variables is reported in table 2. lnGDP and lnNREN have the highest mean and median. Also, the correlation matrix presented in table 3 shows that lnRD has a high and positive correlation with lnEFP. Also, lnGDP, lnREN, and lnNREN all have the expected correlation sign with lnEFP.
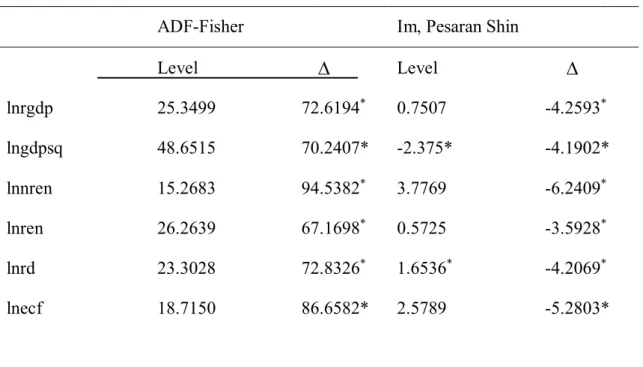
4.2 Unit root and co-integration tests
In table 4, both ADF-Fisher and Im, Perasan Shin unit root tests show that the variables are all stationary at firs-order differences, but not stationary at level for all variables tested using the ADF-Fisher unit root test. Two variables are stationary at level in the Um, Perasan Shin test. Therefore, we conclude that the time series of variables are integrated of order one, i.e. I(1).
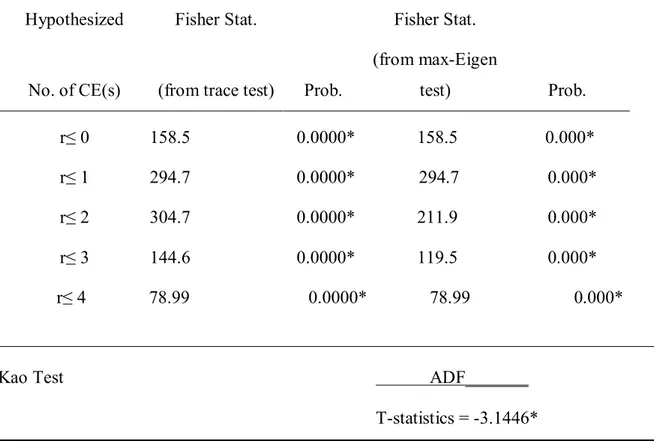
Aditionally, in table 5 and 6 and 7, we present results of the cointegration tests from Pedroni and Johansen Multivariate Cointegration tests respectively. The results confirm that
cointegration relationship exists among lnRGDP, lnNREN, lnREN and lnRD. <Insert table 4-6 near here>
4.3 Estimation results
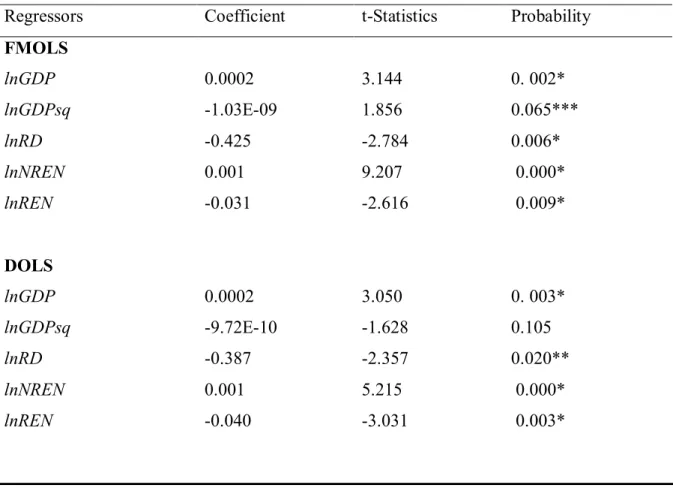
Result of FMOLS and DOLS estimations are reported in Table 7, both of which are consistent and statistically significant. As such, lnGDP and lnGDP2 both have positive and negative signs
respectively as expected. This also verifies that the Environmental Kuznet Curve Hypothesis holds for this panel of 16 EU countries. Also, the negative and statistically coefficient of lnREN indicate that higher consumption of renewable energy reduces ecological footprint. Specifically, a 10% increase in renewable energy consumption will reduce ecological footprint by 3%, holding all other factors constant. In contrast, a 10% increase in non-renewable energy consumption will further increase ecological footprint by 0.01%. This is in line with previous studies on ecological footprint in the EU (Alola et al., 2019) and for OECD countries (Akif and Sinha, 2020).
The estimated result for both lnREN and lnNREN suggest that EU nations are on the way of achieving their environmental goals, especially thorugh increased positive contribution of renewable energy than the adverse impact of consumption of energy from non-renewable sources. This is in line with previous studies (Bekun et al., 2019; Sarkodie and Adams, 2018; Sarkodie and Strezov, 2018b) that renewables are the pathway for a cleaner environment. Considering that the present examination utilizes ecological footprint as the explained variable, since it records for higher substance as against CO2 emissions which is commonly used in past studies, we can infer on overall behaviour of the panel of countries in terms of their ecological quality.
In terms of research and development, lnRD shows that a 10% increase in R&D expenditure reduces ecological ootprint by 4.2%. This is in line with previous studies (Charfeddine & Kahia, 2019) and (Zafar et al., 2019a) that suggest that an increase in funding for research on renewable energy (such as biomass, biogas, hydro, solar and solid waste) not only gives a comparative advantage to such countries, but also ensure consumption of cleaner energy source, improve a more sustainable biosphere, and more importantly enhance the transition from consumption of energy from non-renewable energy sources to those from renewable sources. Additionally, such transition helps lower ecological footprint, but must be applied more cautiously, as argued by Sim & Kim (2019) in the case of South Korea. Finally, given that the EKC hypothesis holds on our sample of 16 EU countries, with a 10% increase in lnRGDP generating a significant but arguably negligible increase in ecological footprint of 0.002%, our study supports more investment in research and development expenditure to further strengthen the transition to consumption of energy from renewable sources.
<Insert table 8>
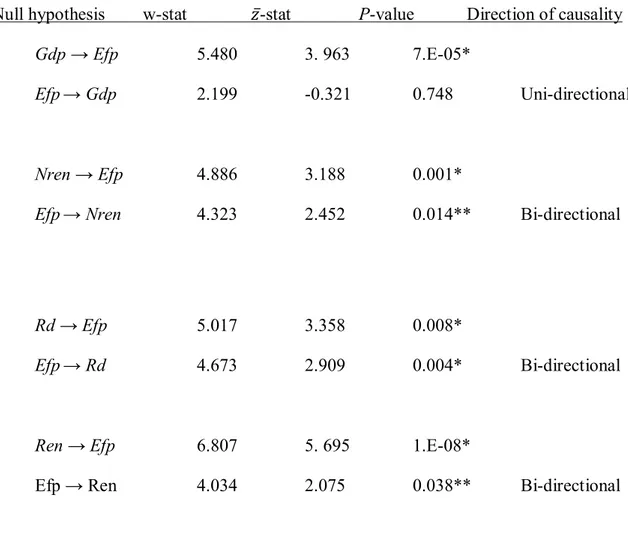
In order to strengthen our arguments, panel causality test given by Dumitrescu and Hurlin (2012) was estimated as shown in table 8. From our result, real GDP per capita has a one way directional causality with ecological footprint for the panel of countries examined, and is a valuable policy insight. This suggests that both environmental and macroeconomic policy makers need not sacrifice the environment for continuous growth of the economy, but must give close consideration to the antagonistic impact of uncontrolled developmental goals on the quality of the environment (Alola et al., 2019a, b). In the case of non-renewable energy consumption and ecological footprint, there is a bidirectional causality. This means that there is a feedback mechanisim between both variable. Hence, more non-renewable energy has the potential to affect ecological footprint and vice-versa. In a similar fashion, a bidirectional granger causality also exists between research and development and ecological footprint as well as between renewable energy consumption and ecological footprint. For R&D, the statistically significant granger causality suggest that an effort to boost spending on R&D in order to transit from non-renewable to renewable energy consumption will drive ecological footprint, as both variables (lnREN and lnNREN) both granger cause ecological footprint. Finally, the present study validated all the apriori hypotheses one and two of the study. The study establish that there is a long run convergence (equiilirum) relationship between the study variables. This is consistent with the study of Alola et al (2019) for the case of US and Bekun et al (2019a,b) for selected EU countries and South Africa respectively.
5. Conclusions and Poliy Direction
Studies on the energy-growth nexus has been well-documented in the literature, with interconnection among renewable, non-renewable consumption and real GDP per capita been on top of the research agenda. This study extends the body of knowledge by introducing research and expenditure development in the Environmental Kuznets Curve Hypothesis, specifically for 16 European countries (Austria; Belgium; Bulgaria; Cyprus; Denmark; Finland; France; Germany; Greece; Ireland; Italy; Netherlands; Portugal; Spain; Sweden; and United Kingdom) over the period 1997 to 2014. The FMOLS and DOLS approaches were employed to examine the long-run relationship between ecological footprint, economic growth, research and development expenditure, renewable and non-renweeable energy consumption. The current study validates the presence of Environmental Kuznet Curve Hypothesis (EKC) holds for this panel of EU countries examined. This outcome is insightful for policymakers in the blocs investigated. While a negative and significant long-run equilibrium relationship is observed between ecological footprint and renewable energy consumption, as well as ecological footprint and research and development expenditure, economic growth and nonrenewable energy consumption are found to wield more alteration on goals of environmental sustainability.
On policy direction, a conceivable clarification of this achievement is credited to the responsibility of every EU nation examined in the current study. Such responsibility should be further aimed toward achieving a sustainable ecological footprint and cleaner environment by expanding the portion of renewable energy consumption in the ocuntry’s energy mix. Conclusively, renewable energy demonstrates strength to mitigate EU countries environmental qualities. The desirable impact of renewable energy consumption on quality of the environment is also seen in the pivotal role of expenditure in R&D for sustainable economic expansion. This implies that EU government administrators need to reinforce policies to improve public- private partnership in R&D especially in energy efficiency. This implied the need for policy makers to share of renewable energy mix in order to attain sustainable economic growth without compromise on quality of the environment. All the more along these lines, the vast majority of the nations analyzed is a signatory to the Kyoto Protocol and Paris accord. Regardless, there is still a need to keep up the present energy in the light of arousing global awareness on potentials for advancing research and development as a feasible solution to transiting from non-renewable to renewable energy sources. Consequently, further research on
the mediating role of R&D ought to incorporate more countries so as to present a larger global perspective.
References
Acheampong, A.O., Adams, S., Boateng, E., 2019. Do globalization and renewable energy contribute to carbon emissions mitigation in Sub-Saharan Africa? Sci. Total Environ. 677, 436–446. https://doi.org/10.1016/j.scitotenv.2019.04.353
Akif, M., Sinha, A., 2020. Renewable , non-renewable energy consumption , economic growth , trade openness and ecological footprint : Evidence from organisation for economic Co-operation and development countries. J. Clean. Prod. 242, 118537. https://doi.org/10.1016/j.jclepro.2019.118537
Al-Mulali, U., Fereidouni, H.G., Lee, J.Y.M., 2014. Electricity consumption from renewable and non-renewable sources and economic growth: Evidence from Latin American
countries. Renew. Sustain. Energy Rev. 30, 290–298.
https://doi.org/10.1016/j.rser.2013.10.006.
Alola, A. A. (2019a). The trilemma of trade, monetary and immigration policies in the United States: Accounting for environmental sustainability. Science of The Total Environment, 658, 260-267.
Alola, A. A. (2019b). Carbon emissions and the trilemma of trade policy, migration policy and health care in the US. Carbon Management, 10(2), 209-218.
Alola, A.A., Bekun, F.V., Sarkodie, S.A., 2019. Dynamic impact of trade policy, economic growth, fertility rate, renewable and non-renewable energy consumption on ecological
footprint in Europe. Sci. Total Environ. 685, 702–709.
https://doi.org/10.1016/j.scitotenv.2019.05.139.
Alola, A. A., Yalçiner, K., Alola, U. V., & Saint Akadiri, S. (2019). The role of renewable energy, immigration and real income in environmental sustainability target. Evidence from Europe largest states. Science of The Total Environment, 674, 307-315.
Asongu, S. A. (2018). CO2 emission thresholds for inclusive human development in sub-Saharan Africa. Environmental Science and Pollution Research, 25(26), 26005-26019. Asongu, S. A., Le Roux, S., &Biekpe, N. (2017). Environmental degradation, ICT and
inclusive development in Sub-Saharan Africa. Energy Policy, 111, 353-361.
Bazan, G., 1997. UCLA Electronic Green Journal Title Our Ecological Footprint: reducing human impact on the earth Permalink Publication Date. Electron. Green J. 1.
between CO2 emissions, resource rent, renewable and nonrenewable energy in 16-EU
countries. Sci. Total Environ. 657, 1023–1029.
https://doi.org/10.1016/j.scitotenv.2018.12.104.
Bekun, F. V., Emir, F., & Sarkodie, S. A. (2019). Another look at the relationship between energy consumption, carbon dioxide emissions, and economic growth in South Africa. Science of the Total Environment, 655, 759-765.
Boontome, P., Therdyothin, A., Chontanawat, J., 2017. ScienceDirect ScienceDirect Investigating the causal relationship between non-renewable Assessing the feasibility of using the heat demand-outdoor and renewable energy consumption , CO 2 emissions temperature function for a long-term district heat demand . Energy Procedia 138, 925– 930. https://doi.org/10.1016/j.egypro.2017.10.141
Charfeddine, L., Kahia, M., 2019. Impact of renewable energy consumption and fi nancial development on CO 2 emissions and economic growth in the MENA region : A panel vector autoregressive ( PVAR ) analysis. Renew. Energy 139, 198–213. https://doi.org/10.1016/j.renene.2019.01.010
Chu, X., Deng, X., Jin, G., Wang, Z., Li, Z., 2017. Ecological security assessment based on ecological footprint approach in Beijing-Tianjin-Hebei region, China. Phys. Chem. Earth 101, 43–51. https://doi.org/10.1016/j.pce.2017.05.001
Dumitrescu, E.-I., Hurlin, C., 2012. Testing for Granger non-causality in heterogeneous panels. Econ. Model. 29, 1450–1460. https://doi.org/10.1016/j.econmod.2012.02.014
Feng, Z., Cui, Y., Zhang, H., Gao, Y., 2018. Assessment of human consumption of ecosystem services in China from 2000 to 2014 based on an ecosystem service footprint model. Ecol. Indic. 94, 468–481. https://doi.org/10.1016/j.ecolind.2018.07.015
Galli, A., 2015. Humanity’s growing Ecological Footprint: sustainable development implications. Glob. Footpr. Netw.
Hanif, I., Aziz, B., Chaudhry, I.S., 2019. Carbon emissions across the spectrum of renewable and nonrenewable energy use in developing economies of Asia. Renew. Energy 143, 586– 595. https://doi.org/10.1016/j.renene.2019.05.032
Hassan, S.T., Xia, E., Khan, N.H., Shah, S.M.A., 2019. Economic growth, natural resources, and ecological footprints: evidence from Pakistan. Environ. Sci. Pollut. Res. 26, 2929– 2938. https://doi.org/10.1007/s11356-018-3803-3
Info, A., 2019. Energy Conversion and Management 199.
https://doi.org/10.1016/j.enconman.2019.111938
footprints of nations, 1960-2003. Soc. Sci. Res. 40, 226–244. https://doi.org/10.1016/j.ssresearch.2010.09.004
Kao, C., 1999. Spurious regression and residual-based tests for cointegration in panel data. J. Econom. 90, 1–44. https://doi.org/10.1016/S0304-4076(98)00023-2
Kao, C., Chiang, M.H., 2000. On the estimation and inference of a cointegrated regression in panel data. Adv. Econom. 15, 179–222. https://doi.org/10.1016/S0731-9053(00)15007-8 Lei, K., Zhou, S., 2012. Per capita resource consumption and resource carrying capacity: A
comparison of the sustainability of 17 mainstream countries. Energy Policy 42, 603–612. https://doi.org/10.1016/j.enpol.2011.12.030
Liu, X., Zhang, S., Bae, J., 2017a. The impact of renewable energy and agriculture on carbon dioxide emissions: Investigating the environmental Kuznets curve in four selected
ASEAN countries. J. Clean. Prod. 164, 1239–1247.
https://doi.org/10.1016/j.jclepro.2017.07.086
Liu, X., Zhang, S., Bae, J., 2017b. The nexus of renewable energy-agriculture-environment in BRICS. Appl. Energy 204, 489–496. https://doi.org/10.1016/j.apenergy.2017.07.077 Long, X., Naminse, E.Y., Du, J., Zhuang, J., 2015. Nonrenewable energy, renewable energy,
carbon dioxide emissions and economic growth in China from 1952 to 2012. Renew. Sustain. Energy Rev. 52, 680–688. https://doi.org/10.1016/j.rser.2015.07.176
Nathaniel, S., Nathaniel, S., 2019. Ecological footprint , urbanization , and energy consumption in South Africa : including the excluded.
Ozcan, B., Ozturk, I., 2019. Renewable energy consumption-economic growth nexus in emerging countries: A bootstrap panel causality test. Renew. Sustain. Energy Rev. 104, 30–37. https://doi.org/10.1016/j.rser.2019.01.020
Ozcan, B., Tzeremes, P.G., Tzeremes, N.G., 2019. Energy consumption, economic growth and
environmental degradation in OECD countries. Econ. Model.
https://doi.org/10.1016/j.econmod.2019.04.010.
Ozturk, Ilhan, and Usama Al-Mulali. "Investigating the Trans-boundary of Air Pollution Between the BRICS and Its Neighboring Countries: An Empirical Analysis." Energy and Environmental Strategies in the Era of Globalization. Springer, Cham, 2019. 35-59. Ozturk, I., Al-Mulali, U., & Solarin, S. A. (2019). The control of corruption and energy
efficiency relationship: an empirical note. Environmental Science and Pollution Research, 1-7.
Pradhan, R. P., Arvin, M. B., Nair, M., Bennett, S. E., & Hall, J. H. (2018). The dynamics between energy consumption patterns, financial sector development and economic growth
in Financial Action Task Force (FATF) countries. Energy, 159, 42-53.
Pedroni, P., 2004. Panel Cointegration: Asymptotic and Finite Sample Properties of Pooled Time Series Tests with an Application to the PPP Hypothesis. Econom. Theory 20, 597– 625. https://doi.org/10.1017/S0266466604203073
Pedroni, P., 2001. Purchasing Power Parity Tests in Cointegrated Panels. Rev. Econ. Stat. 83, 727–731. https://doi.org/10.1162/003465301753237803
Pedroni, P., 1999. Critical Values for Cointegration Tests in Heterogeneous Panels with Multiple Regressors. Oxf. Bull. Econ. Stat. 61, 653–670.
Saint Akadiri, S., Bekun, F. V., & Sarkodie, S. A. (2019). Contemporaneous interaction between energy consumption, economic growth and environmental sustainability in South Africa: What drives what?. Science of the total environment, 686, 468-475.
Sarkodie, S.A., Adams, S., 2018. Renewable energy, nuclear energy, and environmental pollution: Accounting for political institutional quality in South Africa. Sci. Total Environ. 643, 1590–1601. https://doi.org/10.1016/j.scitotenv.2018.06.320.
Sarkodie, S. A., & Ozturk, I. (2020). Investigating the environmental Kuznets curve hypothesis in Kenya: a multivariate analysis. Renewable and Sustainable Energy Reviews, 117, 109481.
Sarkodie, S.A., Strezov, V., 2018a. Science of the Total Environment Assessment of contribution of Australia ’ s energy production to CO 2 emissions and environmental degradation using statistical dynamic approach. Sci. Total Environ. 639, 888–899. https://doi.org/10.1016/j.scitotenv.2018.05.204
Sarkodie, S.A., Strezov, V., 2018b. Assessment of contribution of Australia’s energy production to CO2 emissions and environmental degradation using statistical dynamic
approach. Sci. Total Environ. 639, 888–899.
https://doi.org/10.1016/j.scitotenv.2018.05.204
Shahbaz, M., Loganathan, N., Zeshan, M., Zaman, K., 2015. Does renewable energy consumption add in economic growth? An application of auto-regressive distributed lag model in Pakistan. Renew. Sustain. Energy Rev. 44, 576–585. https://doi.org/10.1016/j.rser.2015.01.017
Sharif, A., Raza, S.A., Ozturk, I., Afshan, S., 2019. The dynamic relationship of renewable and nonrenewable energy consumption with carbon emission: A global study with the application of heterogeneous panel estimations. Renew. Energy 133, 685–691. https://doi.org/10.1016/j.renene.2018.10.052
Comparative study between environmental sustainability index, ecological footprint and
the emergy performance indices. Ecol. Econ. 66, 628–637.
https://doi.org/10.1016/j.ecolecon.2007.10.023
Sikder, A., Inekwe, J., Bhattacharya, M., 2019. Economic output in the era of changing energy-mix for G20 countries : New evidence with trade openness and research and development investment. Appl. Energy 235, 930–938. https://doi.org/10.1016/j.apenergy.2018.10.092 Sim, J., Kim, C., 2019. The value of renewable energy research and development investments
with default consideration. Renew. Energy 143, 530–539.
https://doi.org/10.1016/j.renene.2019.04.140
Sonu, G., Binod, P., Sonika, G.R., Health, P., 2011. Ecological Footprint : A tool for measuring Sustainable development. Int. J. Environ. Sci. 2, 140–144.
Søren, J., 1991. Estimation and Hypothesis Testing of Cointegration Vectors in Gaussian Vector Autoregressive Models. Econometrica 59, 1551–1580.
Ulucak, R., Apergis, N., 2018. Does convergence really matter for the environment? An application based on club convergence and on the ecological footprint concept for the EU countries. Environ. Sci. Policy 80, 21–27. https://doi.org/10.1016/j.envsci.2017.11.002 Wackernagel, M., 2002. What We Use and What We Have: Ecological Footprint and
Ecological Capacity. Redefining Prog. 1–8.
Wesseh, P.K., Lin, B., 2017. Is renewable energy a model for powering Eastern African countries transition to industrialization and urbanization? Renew. Sustain. Energy Rev. 75, 909–917. https://doi.org/10.1016/j.rser.2016.11.071
Yao, S., Zhang, S., Zhang, X., 2019. Renewable energy, carbon emission and economic growth: A revised environmental Kuznets Curve perspective. J. Clean. Prod. 235, 1338– 1352. https://doi.org/10.1016/j.jclepro.2019.07.069
Zafar, M.W., Shahbaz, M., Hou, F., Sinha, A., 2019a. From nonrenewable to renewable energy and its impact on economic growth: The role of research & development expenditures in Asia-Pacific Economic Cooperation countries. J. Clean. Prod. 212, 1166–1178. https://doi.org/10.1016/j.jclepro.2018.12.081
Zafar, M.W., Zaidi, S.A.H., Khan, N.R., Mirza, F.M., Hou, F., Kirmani, S.A.A., 2019b. The impact of natural resources, human capital, and foreign direct investment on the ecological footprint: The case of the United States. Resour. Policy 63, 101428. https://doi.org/10.1016/j.resourpol.2019.101428
Zhang, X.H., Hu, H., Han, J., Deng, S.H., Xao, H., Peng, H., Li, Y.W., Shen, F., Yang, X.Y., Wu, J., Zhang, Y.Z., Qi, H., 2012. Several novel indicators being applied to analyze the
relationships between Chinese economic growth, energy consumption and its impact of emissions. Ecol. Indic. 15, 52–62. https://doi.org/10.1016/j.ecolind.2011.09.026
Zhang, X.H., Zhang, R., Wu, L.Q., Deng, S.H., Lin, L.L., Yu, X.Y., 2013. The interactions among China’s economic growth and its energy consumption and emissions during 1978-2007. Ecol. Indic. 24, 83–95. https://doi.org/10.1016/j.ecolind.2012.06.004
Zhao, S., Li, Z., Li, W., 2005. A modified method of ecological footprint calculation and its application. Ecol. Modell. 185, 65–75. https://doi.org/10.1016/j.ecolmodel.2004.11.016
Figure 1 – Trend of Research and Development Expenditure, Ecological Footprint and Economic Growth in Selected EU countries
Source: Author’s compilation (Data source: World Bank Development Indicator)
0 5000 10000 15000 20000 25000 30000 35000 40000 45000 0 1 2 3 4 5 6 7 1 9 9 7 1 9 9 8 1 9 9 9 2 0 0 0 2 0 0 1 2 0 0 2 2 0 0 3 2 0 0 4 2 0 0 5 2 0 0 6 2 0 0 7 2 0 0 8 2 0 0 9 2 0 1 0 2 0 1 1 2 0 1 2 2 0 1 3 2 0 1 4 U S$ %
Research and development expenditure (as percentage of GDP) - Left Axis Ecological Footprint - Left Axis
Figure 2 – REC and NREC of EU countries.
Source: Author’s compilation (Data source: World Bank Development Indicator)
0 5 10 15 20 25 2900 3000 3100 3200 3300 3400 3500 3600 3700 3800 3900 4000 19 9 7 19 9 8 19 9 9 20 0 0 20 0 1 20 0 2 20 0 3 20 0 4 20 0 5 20 0 6 20 0 7 20 0 8 20 0 9 20 1 0 20 1 1 20 1 2 20 1 3 20 1 4 % kg
Nonrenewable energy (Oil equivalent in Kg) - Left Axis
Table 1: Data Description
Variable Name Symbol Unit Source___
Ecological Footprint EFP Global hectares WDI
Real Gross Domestic Product GDP Constant USD 2010 WDI
Research and Development RD percentage of GDP WDI
Nonrenewable Energy Consumption NREN Share of fossil energy WDI Renewable Energy Consumption REN Oil equivalent in Kg WDI
Note: All data were sourced from the WDI (world development indicators). Economic growth is measured in (United States Dollars, US$ constant 2010), renewable energy consumption in (% of total final energy consumption). Also, nonrenewable energy in oil equivalent in Kilogram (Kg) while research and development as a percentage of GDP.
Table 2: Descriptive statistics for the EU for the underlined variables
lnEFP lnGDP lnNREN lnREN lnRD
Mean 1.7423 10.4263 8.170192 2.187772 0.361007 Median 1.7374 10.5769 8.185317 2.190248 0.519103 Maximum 2.1743 11.0215 8.872747 3.910993 1.363760 Minimum 1.1130 8.2296 7.431173 -0.15915 -1.60321 Std. Dev. 0.2105 0.5429 0.329282 0.988787 0.672158 Skewness -0.5796 -2.4029 0.151677 -0.29627 -0.72888 Kurtosis 3.4457 9.0123 2.145880 2.354254 2.720371 Observations 288 288 288 288
Note: The ln is the logarithmic values for EFP: Ecological footprint, GDP: Gross domestic product, REN: Renewable energy consumption, NREN: Nonrenewable energy consumption, and RD: Research and development. The Std. Dev is the standard deviation.
Table 3: Correlation Coefficient
Matrix______________________________________________
lnEFP lnGDP lnNREN lnREN lnRD
lnEFP ---
lnGDP 0.7528* ---
lnNREN 0.6803* 0.5616* ---
lnREN -0.1062** 0.0109 0.0797 ---
lnRD 0.5346* 0.6702* 0.8105* 0.3220 ---
Note: The ln is the logarithmic values for EFP: Ecological footprint, GDP: Gross domestic product, REN: Renewable energy consumption, NREN: Nonrenewable energy consumption, and RD: Research and development. Also, the Std. Dev is the standard deviation while * and ** indicate the statistically significant level 1% and 5% respectively.
Note: The ln is the logarithmic values for EFP: Ecological footprint, GDP: Gross domestic product, REN: Renewable energy consumption, NREN: Nonrenewable energy consumption, and RD: Research and development. Also, Std. Dev is the standard deviation while * and ** indicate the statistically significant level 1% and 5% respectively.
Table 4: Unit root results
ADF-Fisher Im, Pesaran Shin
Level Level lnrgdp 25.3499 72.6194* 0.7507 -4.2593* lngdpsq 48.6515 70.2407* -2.375* -4.1902* lnnren 15.2683 94.5382* 3.7769 -6.2409* lnren 26.2639 67.1698* 0.5725 -3.5928* lnrd 23.3028 72.8326* 1.6536* -4.2069* lnecf 18.7150 86.6582* 2.5789 -5.2803*
Table 5: Pedroni cointegration test results Alternative hypothesis: Common AR coefs. (within-dimension)
Stat Prob. W.Stat Prob.
Panel v-Statistic -1.9002 0.9713 -2.4278 0.9924
Panel rho-Statistic 1.2799 0.8998 2.4056 0.9919
Panel PP-Statistic -15.8068 0.000* -10.1454 0.000*
Panel ADF-Statistic -1.9299* 0.027** -2.157 0.016**
Alternative hypothesis: individual AR coefs. (between-dimension)
Group rho-Statistic 4.4486 1.0000
Group PP-Statistic -14.2672 0.000*
Group ADF-Statistic -1.7453 0.045**
Note: The ln is the logarithmic values for EFP: Ecological footprint, GDP: Gross domestic product, REN: Renewable energy consumption, NREN: Nonrenewable energy consumption, and RD: Research and development. Also, Std. Dev is the standard deviation while * and ** indicate the statistically significant level 1% and 5% respectively.
Table 6: Johansen Multivariate Cointegration Test Results
Hypothesized Fisher Stat. Fisher Stat.
No. of CE(s) (from trace test) Prob.
(from max-Eigen test) Prob. r≤ 0 158.5 0.0000* 158.5 0.000* r≤ 1 294.7 0.0000* 294.7 0.000* r≤ 2 304.7 0.0000* 211.9 0.000* r≤ 3 144.6 0.0000* 119.5 0.000* r≤ 4 78.99 0.0000* 78.99 0.000* _________________________________________________________________________
Kao Test ADF_______
T-statistics = -3.1446*
Note: The ln is the logarithmic values for EFP: Ecological footprint, GDP: Gross domestic product, REN: Renewable energy consumption, NREN: Nonrenewable energy consumption, and RD: Research and development. Also, the Std. Dev is the standard deviation, * and ** indicate the statistically significant level 1% and 5% respectively, C. E is the cointegration equation while Prob is the probability value.
Table 7. The Panel FMOLS-DOLS Estimate with Ecological Footprint (EFP) as the dependent variable
Regressors Coefficient t-Statistics Probability
FMOLS lnGDP 0.0002 3.144 0. 002* lnGDPsq -1.03E-09 1.856 0.065*** lnRD -0.425 -2.784 0.006* lnNREN lnREN 0.001 -0.031 9.207 -2.616 0.000* 0.009* DOLS lnGDP 0.0002 3.050 0. 003* lnGDPsq -9.72E-10 -1.628 0.105 lnRD -0.387 -2.357 0.020** lnNREN lnREN 0.001 -0.040 5.215 -3.031 0.000* 0.003*
Note: The ln is the logarithmic values for EFP: Ecological footprint, GDP: Gross domestic product, REN: Renewable energy consumption, NREN: Nonrenewable energy consumption, and RD: Research and development. Also, *, ** and *** indicate the 1%, 5%, and 10% statistically significant level respectively. Additionally, FMOLS and DOLS represents the Panel Fully Modified Ordinary Least Squares and the Panel Dynamic Ordinary Least Squares respective. The R-squared for the FMOLS is 0.914(0.907) while the R-squared for the DOLS is 0.959 (0.935).
Table 8: Panel Granger causality results by Dumitrescu and Hurlin (2012) __________ Null hypothesis w-stat ̅-stat P-value Direction of causality
Gdp → Efp 5.480 3. 963 7.E-05*
Efp→ Gdp 2.199 -0.321 0.748 Uni-directional
Nren → Efp 4.886 3.188 0.001*
Efp→ Nren 4.323 2.452 0.014** Bi-directional
Rd → Efp 5.017 3.358 0.008*
Efp→ Rd 4.673 2.909 0.004* Bi-directional
Ren → Efp 6.807 5. 695 1.E-08*
Efp → Ren 4.034 2.075 0.038** Bi-directional
__________________________________________________________________
Note: ** and * are statistical significance level at 5% and 1% respectively and it
indicates evidence of Granger causality. The variable estimated are the EFP: Ecological footprint, GDP: Gross domestic product, REN: Renewable energy consumption, NREN: Nonrenewable energy consumption, and RD: Research and development.
Appendix
Table A.1. Summary of selected literature on EF, REC and NREC
Author (s) Period Variables Country (s) Methodology Results
Sarkodie & Strezov (2018)
1974 - 2013
EF, NREC, Energy X & M, RGDP, CO2
Australia FMOLS, DOLS and CCR NREC→CO2 emissions
REC↓ CO2 emissions
Jr & Lin (2016) 1980–2011 RGDP, REC, NREC, L, K and
T
34 African countries
dynamic panel data (DPD) models
REC, NREC→ RGDP But, REC > NREC in effect Ulucak & Apergis
(2018)
1961 - 2013
EF per capita EU
Countries
Club clustering approach convergence among club members
Shahbaz, Loganathan, & Zeshan, (2015)
1972–2011 REC, GDP, L and K Pakistan ARDL, VECM and causality REC ↔ GDP
Acheampong, Adams, & Boateng, (2019)
1980– 2015.
NREC, REC, Openness, FDI, GDP and CO2
46 SSA
fixed and random effect estimators
GDP→CO2 emissions
REC↓ CO2 emissions
Al-mulali, Fereidouni, & Lee (2014) 1980–2010 GDP, REC, NREC, GFCF, L & Trade 18 Latin American countries.
VECM and Granger causality REC → GDP Ozcan, Tzeremes, & Tzeremes, (2019) 2000–2014 NREC, GDP, CO2 emissions and EF 35 OECD countries
GMM-PVAR model. Increased GDP levels worsen countries’
ecological indices
Feng et al., (2018) 2000-
2014.
ecosystem
service footprint (ESF), GDP, Income level, Population
china ecosystem
service footprint (ESF) model
High GDP values are associated with ecosystem service deficit (ESD) and vice versa
Author (s) Period Variables Country (s) Methodology Results Charfeddine & Kahia, (2019) 1980-2015. REC, GDP, CO2 emissions, L and GFCF 24 MENA countries PVAR REC → GDP
REC → environmental quality
Jorgenson & Clark (2011)
1960 - 2003
EF, GDP, Pop. Military exp., Arable land and
Manufacturing
65 Countries Panel data analysis GDP levels have no relationship with
environmental degradation
Sharif, Ali, Ozturk, & Afshan (2019)
1990- 2015
RGDP, CO2 emission, REC, NREC and trade.
74 nations Westerlund (2007) bootstrap
cointegration,
Pedroni co-integration, FMOLS and heterogeneous panel causality techniques
REC and NREC have negative and positive effects on environmental degradation respectively
Hanif et al. (2019) 1990 -
2015
CO2 emissions, REC, NREC,
GDP, rate of natural resource depletion and population
25 Asian countries
GMM While REC curb the rate of CO2 emissions,
NREC worsens the countries EF by depleting the natural resource
Boontome, Therdyothin, & Chontanawat (2017)
1971-2013 REC, NREC, GDP and CO2
emissions,
Thailand Co-integration and Causality
analysis
The drive for higher GDP causes increased NREC and CO2 emissions,
Nathaniel & Nathaniel (2019)
1965–2014 Energy use, EF, urban
population, financial development, and per capita GDP
South Africa ARDL, FMOLS and
DOLS
Urbanization and Energy ensures a cleaner environment, but higher GDP leads to higher EF.
Long, Yaw, Du, & Zhuang (2015)
1952-2012 REC, NREC, GDP, L, K, and
CO2
China Granger causality analysis GDP↔ CO2 emissions,
Author (s) Period Variables Country (s) Methodology Results Liu, Zhang, & Bae
(2017a)
1970 - 2013
CO2,
RGDP, NREC, REC and Agriculture
ASEAN-4 Causality Analysis REC and agriculture decrease CO2
NREC → CO2
Liu, Zhang, & Bae (2017)
1992–2013 CO2, RGDP, NREC, REC and
Agriculture
BRICS Panel co-integration analysis RGDP & REC ↓ CO2
NREC & Agric ↑ CO2
Lei & Zhou (2012) 2008 Emergy variables 17
Countries.
Energy analysis Population and inefficient energy consumption
worsen the global EF Asumadu & Adams
(2018)
1971 - 2017
Urban population
CO2 emissions, Energy use
Political institutional quality, REC, NREC, GDP
per capita and Nuclear Electricity Generation
South Africa ARDL The validity of the EKC hypothesis achieving an
optimum turning point at 2011
Note: RGDP, REC, NREC, L, K represent real GDP, renewable energy consumption, non-renewable energy consumption, labour, capital respectively. CO2 represents CO2 emissions; EF represents ecological footprint and GFCF represent gross fixed capital formation. →, ↔, ≠ indicate unidirectional causality, feedback hypothesis, and does not contribute respectively.
Table A.2. Summary of selected literature on the effect of R&D expenditure on EF.
Author (s) Period Variables Country (s) Methodology Results
Wasif, Shahbaz, Hou, & Sinha (2019)
1990-2015 REC, NREC, R&D expenditures K,
and trade openness
Asia-Pacific Economic Cooperation (APEC) countries Continuously Updated Fully Modified Ordinary Least Square (CUPFM)
R&D gears transition from NREC to REC.
Jr & Lin (2017) 1980–2011, RGDP, REC, NREC, L, K and
Technology 12 East African Countries Dynamic Panel Data models
Innovation in T through R & D improves a cleaner environment through improvement in the use of REC
Zhang et al. (2012)
1991–2009 GDP, energy
consumption, education and R & D investment, environmental
protection investment, and CO2
emissions.
china Energy analysis
method
R & D has not reduced emissions
Sikder, Inekwe, & Bhattacharya (2019)
1997 - 2013 GDG, GFCF, L, REC, NREC, R &
D and Openness. G20 Countries FMOLS estimation technique
research and development are found to be the contributing factors in enhancing economic output
Sim & Kim (2019)
2017 to 2030 R & D,
Wind energy, Photovoltaic energy, Marine energy,
Biomass energy and Waste energy
South Korea
Black-Sholes-Merton (BSM) prediction model
R&D investments in marine
energy has a high default risk, while the use of waste energy will result in the
the largest reduction in the number of carbon emissions. R&D represent research and development expenditure