4th International Conference on Renewable Energy Research and Applications Palenno, Italy, 22-25 Nov 2015
An Improved dynamic battery model suitable for
photovoltaic applications
S. Blaifi I, S. Moulahoum I, N. Kabache I, I. Colak 2
I Research Laboratory of Electrical Engineering and automatics, LREA, University of Medea, Algeria. [email protected]; [email protected], [email protected]
2 Engineering and Architecture Faculty, Istanbul Gelisim University, Istanbul, Turkey. [email protected]
Abstract. Modeling of batteries used in photovoltaic applications has been a real issue for many research groups due to its complex electrochemical and electrical behavior. In this paper, we propose an improvement of the Battery model by identification of all parameters in order to estimate the different areas of Battery's output voltage in real conditions for PV
systems. For this purpose, we also performed both static and dynamic simulation. Comparison with real measurement has shown good agreement with the simulation.
Keywords- PVs,' battery,' modeling,' state of charge; parameters identification.
I.
I
NTRODUCTIONBatteries for energy storage are considered as one of the major problem and a weak point in many systems including battery bank such as standalone photovoltaic systems [1]. A deep comprehension of their internal as well as their external interaction has been for a long time a real issue for many research groups. In photovoltaic applications, the battery is subjected to random dynamic working resulting from continuous change in irradiation and temperature. The operation of the battery in unwanted zones such as the overcharge zone, saturation zone, over discharge zone and an exhaustion zone can considerably accelerate the decrease of its life time or leading to their early destruction. The best working regime where the battery is assumed to be safe is the charge/discharge zones. However, keeping the battery in the aforementioned zones involves the knowledge of its actual state of charge (SOC). On the other hand, the electrochemical reactions' complexity and the dependency on working temperature and working zones, let's look to the battery as a very complex system. In this paper, we attempt to introduce a dynamic model for lead acid battery included in a photo voltaic system. The enhancement of a previous work done by Dany and Copetti [1] [2] is proposed. The enhancement focused on the automatic extraction of the whole parameters existing in the battery model.
II. BATTERY MODEL
Based on electric approach illustrated in Figure 1, the battery is represented by an open-circuit voltage
Voe
resulting of the stored energy from the electrochemical reactions, and an internal resistance Rb due to its voltage drop.The output terminals voltage of the battery
Vb•t
varies according to a specific working area, state of charge SOC and depend strongly on the temperature. Therefore, the relationship of the battery output voltage can be written as a complex function of temperature and state of charge:Vb.t=f(T,
SOC). According to figure \,Vb•t
is given by: (\) WhereIb•t
is the drawn current from or to the battery. 1>0 during charge and 1<0 during discharge.{ Vac
={(SOC)
Rb =
{(I, SOC, T)
(2)
The battery's resistance is mainly due to the electrical resistance, physical construction and electrochemical resistance. They are commonly grouped under the concept of internal resistance. The internal resistance also varies depending on the temperature and state of charge of the battery [3].
The practice tests allow obtaining a realistic relationship of the battery internal resistance applies to the charge and the discharge Mode. The expression (3) describes the evolution of internal resistance according to the current, temperature and state of charge [1] [3].
R
b
=
(
_Pl_+ P3 +P)
Cl -a (T-T ))(3)
l+I(t)P2 (l-SOC(t))P4 5 T ref
A.
State of charge
The state of charge is an indicator of the charge stored in the battery, as a percentage expressing the battery's state of charge. This indicator varies in the range O<SOC<I. Equations (4-6) describe the evolution of this indicator. It's obtained by calculating the sum of incoming and outgoing amperes from and to the battery relative to its instantaneous capacity
4th International Conference on Renewable Energy Research and Applications Palermo, Italy, 22-25 Nov 2015 + --;--� 1---+-- --1 0.5 f----1---f---l----+--exhllustlon °0��-�10---l-1S-�20-�2 S���30��35 Time[h]
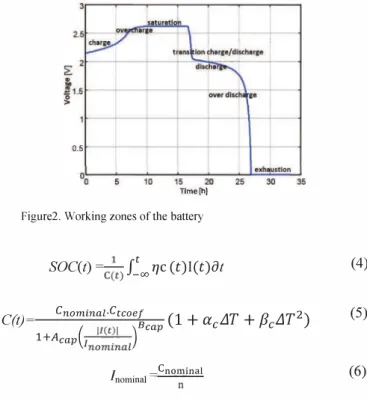
Figure2. Working zones of the battery
C
(t)
SOC(t) =C
�
t) J�oo
17c(t)l(t)8t
Cnominal·Ctcoe[
(1
+ aLlT
+fJ LlT2)
(
11(t)1
)
Bcap
C C 1+Acap
.,...c.'-""'''---[nominal
1 nominal _Cnominal ---n
-(4) (5) (6)Where
C(t)
the instantaneous capacity, lJc is the Coulomb efficiency andI (t)
is the current passing through the battery. Cnominal is the nominal capacity (at n hours), Ctcoe£' Acap and Bcapare model parameters, � T is the temperature variation from the reference value of 25°C, Inominal is the nominal current for n hours. This value is commonly taken for 10h. a and � are the
temperature coefficients [I].
B.
Level of energy
The level of energy (LOE) is an indicator used to show the energy stored in the battery in an instantaneous manner. Expression (7) describes the behavior of LOE. It's obtained by calculating the sum of incoming and outgoing amperes from the battery relative to its maximal instantaneous capacity Cn
Cn is the maximal instantaneous capacity obtained from equation (5), with battery current equal to zero and maximal temperature value ranging from -40°C, 40°C as given in equation (8) [2].
LOE(t)=
:
nJ�oo
17c(t)I(t)8t
(7)I
I
= 0Cn=max(C)
T
= [ -40,40]
C.
Working zones
(8)
Figure 2 shows the different working areas of evolution of the battery voltage. At first, from Oh to 16h, the battery is charged. In this processes the battery passes through three zones namely: charge, overcharge, and saturation. While from 16h to 27h the battery is discharged according to the following areas: discharge zone, overdischarge zone and exhaustion zone respectively. The transition voltage charge/discharge is a voltage drop due to internal resistance [4].
1) Charge zone: In this zone, the battery accepts energy from the charge source, which increases its state of charge. This area is the best in terms of extending the duration of battery life. The expression (9) describes the evolution of battery voltage in this area. Coulomb efficiencY1Jc during charging mode depends strongly on the charging rate, its value is close to 100% for low charge currents and a weak state of charge. However, it then deteriorates upon approaching a fully charged state. Expression (10) reveals this relationship [5]:
V -
.
)) I(t)(
Pic P")
( ()) (9)c-(Vboc+Kbo,SOC(t. -t-'--' C'0 1+1 t " 1-SaC(t))' -(-)
P
-+ ( P4 + Psc 1 -urcilT t1Jc=l-eXP
[
(
�
cmt)
(SOC(t)
-1)
]
110 +bcmt
(10)
2)
Overcharge zone: When the battery reaches the gassing voltage level V g, it can start to saturate and the charging current starts to decrease. Therefore the battery begins to reduce the charge acceptance due to the effect of gassing electrolyte. This effect appears when the charge is close to its maximum charge (95%) [2]. Some battery models consider this value of battery capacity as a constant included in the equations governing the overcharge zone [I]. V g is the voltage when the battery starts to liberates hydrogen gas. This area is dangerous for the battery in terms of battery life duration as a result of hydrogen liberation to the atmosphere.Expressions (11-15) give equation governing this area: V
g
(t)=[
A
g
a
s +
B
g
a
s
ln
(
1 +
���)]
(1- agasLJT(t))
(11)_
[
(
let)
)]
(12)Vec (t)-
A[onse
+
B[onseln
1 +
C10(1 - a[cLJT(t))
[
(
-(
LOE(t)Cn-SOCvg(t)C(t)))]
(13) Vsc(t)=VgCt)+( Vec(t) -Vg(t)) 1- exp I(t)T(t)ATSC T(t) �
-
----'(
""I( t'--) ')
C"""TS-C l+BTsc C10 (14) (15)Vsc is the overcharge voltage,
-ret)
is a time factor for the overcharge phenomenon,SOCv
9 is the state of charge of the battery corresponding to the beginning of electrolyte gassing and Vee is the voltage of saturation zone .3) Saturation zone: In this zone, the battery cannot accept more energy. At this point, the battery voltage reaches its maximum; its value depends on the charging current of the battery as given by equation (12). Also, this area markedly affects battery health then the charge source must be disconnected immediately.
4) Discharge zone: In this area, the battery provides the energy to the load. It's the best working zone in terms of extending the battery life time, when Vbat>0.9VN, with VN is
4th International Conference on Renewable Energy Research and Applications Palermo, Italy, 22-25 Nov 2015
the nominal voltage of the battery. The evolution of the voltage in this area is determined by Equation (16).
v -(V dc- bodc-Kood (1 SOC(t))) c - -� II(t)1
(
1+II(t)IP2dC P'dc + SOC(t)P4dC P3dc + P Sdc)
(1 - rdc ex �T(t)..{16) J.5) Overdischarge zone: In this zone, the battery is nearly empty, when 0.7VN:SVbat :S0.9VN the voltage decreases rapidly as indicated in equation (\6). This area is considered as dangerous area for the battery. The load must be disconnected in this area.
6) Exhaustion zone: It's the very dangerous area for the battery. It can damage the battery, when Vbat<0.7VN. A voltage remainder can appear, but no energy stored in the battery [2].
7) Transition voltage: A difference of voltage appear in transition from the charge to the discharge and vice versa. In the start with a constant current discharge, the initial drop was caused by the internal resistance of the battery [4].
(\7) In order to avoid the discontinuity appearing at this point, a linear expression voltage has been proposed in transition area, When Ibat<11o I, with 10 is a current sufficiently small. The equation (18) shows the linear evolution in this zone [2].
Vella - Vdella
Vella
+
Vdella
Vede
= 210I +
2(18)
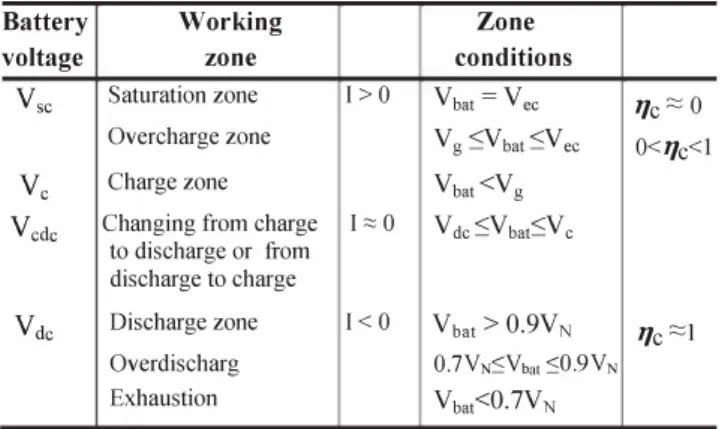
Table 1 shows the different limits of the battery voltages.
TABLE 1. BATTERY WORKING ZONE CONDITION
Battery Working Zone
voltage zone conditions
Vsc Saturation zone I> 0 Vbat = Vee
1Jc;::::; 0
Overcharge zone Vg �Vbat �Vec 0< 1Jc< 1
Ve Charge zone Vbat <Vg
Vcdc Changing from charge I c:; 0 V de �V bat�V e to discharge or from
discharge to charge
Vdc Discharge zone 1<0 Vbat > 0.9VN
1Jc ;::::;1
Overdischarg 0.7VN:SVbat :S0.9VN
Exhaustion Vbat<0.7VN
III.BATTERY STATE OF HEALTH
Regarding electrochemical effects such as liberation of H20, internal variation and several other factors, the capacity of the battery decreases and the self-discharge current appears along time, which limits its lifetime. Based on practice tests and measurements, a realistic approximation is obtained for modeling the state of battery health in long time term. This indicator is called state of health SOH. This indicator takes into account the phenomena that may affects the battery lifetime such as temperature and unwanted working areas, which reduce the capacity of the battery and increases the self discharge current over time. Therefore two additional factors
health for working temperature
TJT
and working zoneTJwz
has been introduced as expressed in equation (19). We note that when SOH is near to \, the battery is in a perfect state while for battery fully damaged the SOH is near to 0 [2].SOH(t)=l
- f�a,cTJT
+
TJwz) at
(\9) WhereTJT
andTJwz
are the temperature and working zones factor respectively. Experience shows that whenever a temperature' rise of 10°C, the battery health decreases by half. The equation (20) shows the evolution of temperature health factor, where Tref equals to 10°C andaT
andf3T
are temperature coefficient [2]. The working zones health factors is obtained a rule of thumb. In Table 2 is shown different values of factor health according to working zones.(20)
TABLE 2.EXPERIMENTAL VALUE OF WORKING ZONE FACTOR HEALTH
Working zone
Saturation and exhaustion zone
Overcharge and overdischarge zone S.Sx 10-7 Charge and discharge zone 2.7x 10⁻⁷
With the aging of the battery its capacity decreases according to its state of health. Equation (21) describes the coefficient of capacity reduction
TJC10.
TJC10=
0.75S0H+
0.25Then the equation of the capacity becomes:
(21)
C(t)
Cnominal·CteoefTJC1o
(
11(t)1
)
Beap
(1
+ a CLJT
+fJ LJT2)
C(22)
1 +Aeap .,...-''-'''''-'---
lnominal
The self-discharge current also depends on state of health. Therefore a coefficient of self-discharge has been defined as given in equation (23).
TJq
= 0.01 - 0.009.S0HQ(t)
lade(t)
=TJq
24h L1IV. STATIC SIMULATION
(23) (24)
The simulation of the lead-acid battery model is done under Matlab/Simulink environment. The simulation data are summarized in table 3. We provide for all battery's output the variation according to the temperature. where T= 10° 20° 30° 40° 50° . The results are given in the Figures 3 to 6.
After the simulation for constant current, we note that whenever the temperature increase the battery's output voltage decrease considerably as it is shown in figure 4, also for the state of charge and the level of energy in figures 5 and 6. The temperature is an effective factor in evolution of battery 'output.
4th International Conference on Renewable Energy Research and Applications Palenno, Italy, 22-25 Nov 2015 10 8 G .. :::: 2
�
0 ::0 -2 <...:> -4 -6 -8 -1°0 T 5Table 3 static simulation data
"' , "� 10 I I • l 15 20 ImE![I'I1 . 25 � 30
Figure 3 Current for charge and discharge
-T=10'C
1
T=20'C T=30·C1
-T=40·C -T=50'C + 0.5 %�--�5---�'O--�'5��20��2�5��3�0--�35 Timerh] 35Figure 4 variation of voltage as functions Temperature
0.8 0.6 U o CIJ 0.4 " -T=1 0C· -T=20C· -T=30C' -T=40C· -T=50C· 30 35
Figure 5 variation of SOC as functions Temperature
0.81:-T-i---'---;:==-T=50'C ::::C� 0.7 -T=40'C 0.6 W 0.5 o -' 0.4 5 �...--_-; .. -.-.--T=30'C ... 10 15 20 Time!h] -T=20'C . -T=10'C
Figure 6 variation of LOE as functions Temperature
35
V. BATTERY CONNECTED TO A PV MODULES AND LOAD
In the PV systems, the battery is an important part for energy storage. In case of lack of radiation the battery
provides the energy to the load, and behaves as a load when there is power generated by PV modules. Therefor we propose an integration of this dynamic model of the battery in the PV system in order to validate it in dynamic mode. We note here that the battery is working without regulation of its output voltage to allow the PV generator sweeping all the allowed working zones [6]. lmod !load
-1
Ibat + pv Vbat modules BatteryFigure 7 Standalone basic PV system
In order to validate the model in dynamic mode, real measurements have been used for a lead-acid battery with the following characteristics in standard test condition (Table 4). The current provided by PV module is shown in figure 8.
TABLE 4 PV MODULES AND BATTERY CHARACTERISTICS
PV module characteristics Battery's nominal arameter Voc=21.8 V Isc=8.17 A Vmpp=17.7 V Impp=7.67 A Pmpp=175 W Vbat =12V CIO = 110Ah 10�---�----�---�---��--�12----���--�3�6----�48----�60�--�72--�96· Time [hi
Figure 8 Battery current provided by PV modules
VI. IDENTIFICATION OF PARAMETERS
Tn order to validate the model, we used Levenberg Maquart [7] algorithm for parameters extraction. The parameters' values given in Table 5 have been taken as initial values for identification algorithm [7].
The new parameters obtained which gives the best matching between measured and simulated results are given in Table 6. In figure 9 it is shown the the measured versus simulated battery's output voltage. According the extracted parameters, the estimated SOC is shown in figure 10.
4th International Conference on Renewable Energy Research and Applications Palenno, Italy, 22-25 Nov 2015
TABLE 5 NOMINAL VALUES FOR MODEL PARAMETER
Cnominal=110 Ah n =10 h Cteoef = l. 6 7 ac = 0.005° el �e=00 C 0 Acap=0.67 Beap = 0.9 V bode = 2.085 V Kbode= 0.12 V P1de = 4 Yah PZde = 1.3 P3de = 0.27 V h P4de = l.5 PSde = 0.02 Vh aemd =20.73 bcmd =0.55 Vboe = 2V Kboe= 0.16 V P1e = 6 Yah PZe = 0.86 P3e = 0.48 V Ah P4e = l.2 PSe = 0.036Vh Agas=2.24 V Bgas=l.970 Vh agaS = 0.002° el afe = 0.002° el Afonse=2.45V Bfonse=2.0 11 Vh ATSC =17.3 h BTse = 852 h CTSC = 1.67 �dc = 0.007° e1 �e = 0.025° e1
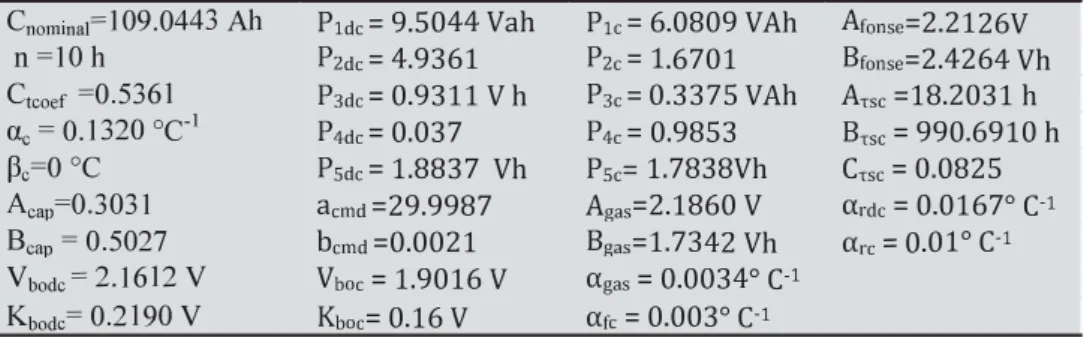
TABLE 6 EXTRACTED PARAMETER VALUES BY LEVENBERG-MARQUARDT ALGORITHM
Cnominal=109.0443 Ah P1de = 9.5044 Yah
n =10 h PZdc= 4.9361 Cteoef =0.5361 P3dc= 0.9311 V h ae = 0.1320 °el P4dc= 0.037 �e=O °C PSdc = 1.8837 Vh Aeap=0.3031 acmd =29.9987 Beap = 0.5027 bcmd =0.0021 Vbode = 2.1612 V Vboc = 1.9016 V Kbode= 0.2190 V Kboc= 0.16 V 15�----�----i!----�-'==�==�==�=====C====� 14.5 14 ... ... - ... j. ....
:
-t.
__ ... ... --+ ... , .-.... .i
::
-
=
l:
E
�
l
-
'
11. r
i 10.5 ... _ ... + ..j
! -j .... . ... ! 1��----�12----�24�----�----�----�----�� 12�--��· Time [hIFigure 9 measured vs simulated voltage with extracted parameters
0.9f- ... ··· .... · .. ·+ .. · ... + .. · .. · .... · ... ; ... ,.. ... .. , . ... ,... .., 0.8f-··· ... ·· ... ·+ .. · ... · .... · .. · .. + ... ·· ... ·, ... · ... · ... , ... , ... , ... .., 0.11-· .. · .... · ... ·+ � ... + ... � ... ,� ... ,� ... :�
/
�
M'
/
go.s
� ...� �
�(�
f ....
" 0 .• 1- ··············· ,. ... ,... i··· ··· �:--"
j................ ; ........ j . ... -I 0.3�· .. · ... · .... · ... · ... · ... i ... · .. ·· ... · .. · .. ·i .. · .... ·· ...j;
... ; ... ; ... -I Ol�··· .. ··+·· · · .. ···· .. ··· .. + .. ··· .. . j ... j. _ . ... j ... + ... � 0.11-.... · .... ·· ... .; .. · .... · .. · .. · .. ·+ ... .. J ... ; . ... ; . ... .. , ... -I O�O----�,,�----U�----���----� .. ----�.�O---+.12----��· llme [h[Figure 10 SOC estimated with extracted parameters
VII.
C
ONCLUSIONIn this paper we proposed a dynamic model of lead acid battery which can predict its behavior in real conditions of
P1e= 6.0809 YAh Afonse=2.2126V PZc = 1.6701 Bfonse=2.4264 Vh P3c= 0.3375 YAh Am =18.2031 h P4c = 0.9853 Bm = 990.6910 h PSc= 1.7838Vh em = 0.0825 Agas=2.1860 V ardc = 0.0167° (-1 Bgas=1.7342 Vh arc = 0.01 ° (-1 agas = 0.0034° (-1 afc = 0.003° (-1
work. The model's parameters extraction conducted with Levenberg-Maquart algorithm has given the best matching between the prediction model and real measurements.
The proposed model gives a useful tool to manage the state of charge and the prediction of the working voltage so that unwanted working zones can be avoided with an appropriate electronic charge regulator. Also, this model is appropriate for many applications involving energy storage using lead-acid batteries such as electric or hybrid cars.
REFERENCES
[I]. Copetti.IB, Chenlo F, Lorenzo E. A general battery model for PV system simulation. Progress in Photovoltaic: Research and Applications 1993; I: 283-292.
[2]. D. Guasch, S. Silvestre, "Dynamic Battery Model for Photovoltaic Applications", Progress in Photovoltaic, Research and Applications, Volume 11 Issue 3, pp. 193-206, Jan. 2003.
[3] Copetti .IB, Chenlo F. Internal resistance characterization of lead-acid batteries for PV rates. Proceedings of the 11th. European PV Solar Energy Conference, Montreux, 12-16 October 1992; 1116-1119.
[4] Salameh ZM, Cassacca MA, Lynch W A. A mathematical model for lead acid batteries. IEEE Transactions on Energy Conversion 1992; 7(1): 93-97.
[5] O. Gergaud, G. Robin, B. Multon, H. Ben Ahmed, Energy modeling of a
lead-acid Battery within hybrid wind/ Photovoltaic systems. ISBN: 90-75815-07-7
[6] Castaner L, Silvestre S.Modelling Photovoltaic Systems Using Pspice.
2002 John Wiley & Sons, Ltd. ISBN: 0-470-84527-9.
[7] Numerical Recipes in Fortran77, CAMBRIGE UNIVERSITY PRESS. [8] Silvestre S, Guasch D, Goethe U, Castaner L. Improved PV battery
modelling using Matlab. Proceedings of the 17thEuropean Photovoltaic Solar Energy Conference and Exhibition, Munich, October 200 I; pp. 507-509.
[9] Micka K., Rousar 1. The theory of the pourous electrodes-XIV, the lead acid cellElectrochemica Acta: Vol 21, 1976, p 599-603