KADIR HAS UNIVERSITY
GRADUATE SCHOOL OF SCIENCE AND ENGINEERING
MOLECULAR DYNAMICS STUDIES OF HUMAN DAT
AND ITS NATURAL LIGAND DOPAMINE
SEDA DEMĠRCĠ
20091109008
S eda DEMĠ R C Ġ M.S . The sis 20 12 S tudent‟ s F ull Na me P h.D. (or M.S . or M.A .) The sis 20 11
MOLECULAR DYNAMICS STUDIES OF HUMAN DAT
AND ITS NATURAL LIGAND DOPAMINE
SEDA DEMĠRCĠ
B.S, Biology, Çanakkale 18 Mart University, 2009
Submitted to the Graduate School of Kadir Has University in partial fulfillment of the requirements for the degree of
Master of Science in
Computational Biology and Bioinformatics
KADIR HAS UNIVERSITY May, 2012
KADIR HAS UNIVERSITY
GRADUATE SCHOOL OF SCIENCE AND ENGINEERING
MOLECULAR DYNAMICS STUDIES OF HUMAN DAT AND ITS NATURAL LIGAND DOPAMINE
SEDA DEMĠRCĠ
APPROVED BY:
Dr. Tuğba Arzu Özal (Kadir Has University) _____________________ (Thesis Supervisor)
Prof.Dr. Kemal Yelekçi (Kadir Has University) _____________________
Assist.Prof.Dr. Ġlke Anaç (GYTE) _____________________
APPROVAL DATE: 22/06/2012 AP PE ND IX C APPENDIX B APPENDIX B
i
MOLECULAR DYNAMICS STUDIES OF HUMAN DAT AND ITS NATURAL LIGAND DOPAMINE
Abstract
The dopamine transporter (DAT), which is a member of Neurotransmitter sodium symporters (NSSs) family, takes place in dopaminergic neurotransmission. Therefore, it is a major molecular target for numerous drugs, including the widely abused psychostimulants cocaine and amphetamine as well as antidepressants. In this study, to understand the dynamics behavior of structure-function relationship of the human dopamine transporter (DAT) we performed MD studies. The dopamine DAT interactions were investigated via Molecular Dynamics (MD) simulations combined with docking analysis. We have used in this study the 3D structure of human DAT which was determined in a previous homology modeling study based on its bacterial homolog LeuT structure. Throughout our study, we developed DAT model, dopamine model and DAT-dopamine complex model, and performed a series of energy minimization and MD simulations. Comparing the outcomes of the simulation for these three cases, we aim to expose the binding properties and dynamics of DAT and dopamine. Afterwards, to study variations in the binding site affinities during the Molecular Dynamics simulation, we have investigated MD trajectory. Different conformations of DAT model were obtained with clustering analysis. To explore different binding sites and the pathway we performed docking analysis. As a result we determined two binding sites and a translocation pathway for dopamine. The binding modes of dopamine for S1 (primary binding site), S2 (secondary binding site) and S1 to intracellular translocation pathway, were determined through the binding affinities. We observed that there is a remarkable agreement between the identities of the key residues in the translocation mechanism obtained via the simulations with experimental data in the literature.
ii
ĠNSAN DAT PROTEĠNĠN VE DOĞAL LĠGANDI DOPAMĠNĠN MOLEKÜLER DĠNAMĠK ÇALIġMASI
Özet
Nörotransmitter sodyum simporter (NSSs) ailesinin bir üyesi olan dopamin taĢıyısıcı (DAT), dopaminerjik nörotransmisyonu gerçekleĢtirir. Bu nedenle, antidepresanların yanı sıra yaygın olarak istismara neden olan psikostimulanlar kokain ve amfetamin dahil olmak üzere sayısız ilaç için ana moleküler hedeftir. Bu çalıĢmada, dopamin taĢıyıcısı (DAT) ve dopaminin yapı-iĢlev iliĢkisinin dinamik özelliklerini anlamak için Moleküler Dinamik çalıĢması gerçekleĢtirildi. Dopamin-DAT etkileĢimleri doklama analizleriyle birlikte Moleküler dinamik (MD) simülasyonları ile incelendi. Biz bu çalıĢmada, daha önceki çalıĢmada bakteriyel homoloğu LeuT örnek alınarak, homoloji modellemesi ile oluĢturulan, insan DAT 3 boyutlu yapısını kullandık. ÇalıĢmamız boyunca, DAT modeli, dopamin modeli ve DAT-dopamin tümleĢik modeli geliĢtirdik ve bir dizi enerji minimizasyonu ve MD simülasyonu uyguladık. Bu üç durumun simülasyon sonuçlarını karĢılaĢtırarak, DAT ve dopaminin bağlanma özelliklerini ve dinamiğini meydana çıkarmayı hedefledik. Daha sonra, Moleküler Dinamik esnasında ki bağlanma bölgelerindeki değiĢiklikleri ve etkileĢimleri incelemek için Moleküler Dinamikten elde edilen zamana bağlı pozisyon datası kullanılmıĢtır. Kümeleme analizleri ile DAT modelin farklı konformasyonları elde edilmiĢtir. Farklı bağlanma yerleri ve yollarını keĢfetmek için doklama iĢlemi kullandık. Bunun sonucunda dopamin için iki bağlanma bölgesi ve bir translokasyon yolu belirledik. Dopaminin S1, S2 ve S1 „den hücre içine translokasyon yolundaki bağlanma modları, bağlanma eğilimlerine göre tespit edildi. Literatürdeki simülasyon ve deneysel verilerle elde edilen translokasyon mekanizmasında ki, tanımlanan önemli residüler arasında dikkate değer bir anlaĢma olduğunu gözlemledik.
iii
Acknowledgements
I would never have been able to finish my graduate study without the guidance of my advisor and other committee members, support from my family, and help from friends.
First and foremost, I would thank to my dissertation supervisor, Dr. Tuğba Arzu Özal for her courage, patience and assistance during this project. I also thank Assist. Prof. Ġlke Anaç for her participation in my thesis committee and important comments of my thesis. And special thanks to Prof. Dr. Kemal Yelekçi for his valuable contributions in this thesis and being in my thesis committee. Thank to Gizem Tatar for her contribution of this research at the beginning.
I wish to express thanks to my friends Sibel Çakan, Oya Karatepe, Aslı Yıldırım, Burak Kaan Kızılkan, Ozan Uzun, Gökhan KuĢçu and Çağla Mıdık for their constant support, understanding and motivation. My heartful gratitude all of them.
Finally, I would like to thank my parents, Musa Demirci, Dilber Demirci and my brother Abdullah Demirci for their love, patience and encouragement.
iv
This thesis is dedicated to my mother Dilber and my father Musa for their endless love and support.
v
Table of Contents
Abstract ... i Özet ... ii Acknowledgements ... iii Table of Contents ... vList of Tables ... viii
List of Figures ... xi
List of Abbreviations ... xxi
Introduction ... 1
1.1 Literature Search ... 4
Theoretical Background for MD Simulations ... 11
2.1. Force Fields ... 11
2.2. Initialization of the System ... 13
2.3. Trajectory Analysis ... 15
2.3.1. Root Mean Square Deviation (RMSD) ... 15
2.3.2. Mean Square Fluctuation (MSF) ... 15
2.3.3. Clustering Analysis ... 16
Molecullar Dynamics Simulations ... 17
3.1. Introduction ... 17
3.2. Methodology: Steps of MD Simulation ... 18
3.2.1. Melting of Lipid Tails ... 18
3.2.2. Minimization and Equilibration with Protein Constrained ... 19
3.2.3. Equilibration with Protein Released ... 20
3.2.4. Production Runs ... 21 APPENDIX B
vi
3.3. Molecular Dynamics (MD) Simulations of Dopamine Transporter ... 21
3.3.1. System Preparation for MD ... 23
3.3.3. Analysis ... 27
3.4. Molecular Dynamics (MD) Simulations of Dopamine ... 42
3.4.1. Creating Topology File for Dopamine ... 42
3.4.2. System Preparation for MD ... 43
3.4.3 Simulation Details and Production MD run ... 46
3.4.4. Analysis ... 47
3.5. Molecular Dynamics (MD) Simulations of DAT-Dopamine Complex ... 53
3.5.1 Molecular Docking of Dopamine Transporter and Dopamine ... 55
3.5.2. System Preparation for MD ... 58
3.5.3 Simulation Details and Production MD run ... 61
3.5.4 Analysis ... 62
Clustering Analysis ... 71
4.1 Clustering Analysis Methodology ... 71
4.2 Clustering Results of MD Trajectory Snapshots ... 72
Docking Analysis ... 81
5.1 Methodology ... 82
5.2 Results and Discussion ... 84
5.2.1 Binding Energies For Different Conformations of DAT Clustered With Respect to Overall Structure ... 84
5.2.2 Binding Site Residues and Interactions in DAT model Subclusters (Radius of 3.0 Å) with Dopamine ... 86
5.2.3 Binding Energies For Different Conformations of DAT Clustered With Respect to Binding Site ... 100
5.2.4 Binding Site Residues and Interactions in DAT model Subclusters (Radius of 1.3 Å) with Dopamine ... 101
vii
5.2.5 The S1 and S2 binding sites and the substrate translocation pathway of DAT ... 112 Conclusion ... 121 REFERENCES ... 127
viii
List of Tables
Table 3.1. Total number of atoms and water molecules at three simulations. ... 21
Table 3.2. The DAT, cell membrane and system dimensions. ... 25
Table 3.3 DAT simulation system details. ... 26
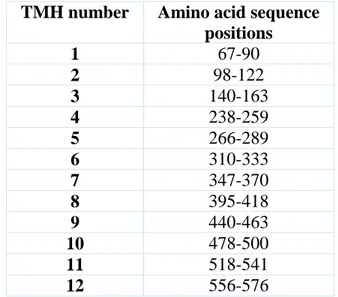
Table 3.4. Start and end points of TMHs detected in the experimental studies of human dopamine transporter (DAT). ... 33
Table 3.5. Start and end points of transmembrane helices (TMHs) of initial DAT model detected computationally by using VMD program. ... 33
Table 3.6. The positions of the aminoacid sequence of the transmembrane helix regions were detected in the initial DAT model corresponding to experimental studies. ... 34
Table 3.7.Start and end points of transmembrane helices (TMHs) of after MD DAT model detected computationally by using VMD program. ... 36
Table 3.8. The positions of amino acid sequence of transmembrane helices obtained in the after MD simulation DAT model corresponding to experimental studies. ... 36
Table 3.9. Comparison of the initial and after MD simulation DAT helices structures and RMSD values. ... 41
ix
Table 3.11 Dopamine simulation system details. ... 47
Table 3.12.The DAT complex structure, cell membrane and system dimensions. ... 60
Table 3.13 DAT complex simulation system details... 61
Table 3.14. The residues in the binding sites pertaining to the before and after MD-simulated DAT-dopamine complexes. Common residues found in these regions are shown in dark. ... 65
Table 4.1 Cluster members and best members (BM) resulting from cluster radius of 3.0 Å with overall structural considerations. ... 73
Table 4.2 Cluster members and best members (BM) resulting from cluster radius of 1.3 Å when binding-site is taken as reference... 74
Table 5.1 Docking results for DAT model subclusters (radius of 3.0 Å) - dopamine with AutoDock 4.0 ... 85
Table 5.2 Binding site residues of the DAT model subclusters (radius of 3.0 Å)... 87
Table 5.3 Docking results for DAT model subclusters (radius of 1.3 Å) - dopamine with AutoDock 4.0 ... 100
Table 5.4 Binding site residues of the DAT model subclusters (radius of 1.3 Å)... 102
Table 5.5 Comparison of S1 site residues. Same residues found in these regions are shown in dark. ... 115
Table 5.6 Comparison of S2 site residues. Same residues found in these regions are shown in dark. ... 116
Table 5.7 Docking results for initial DAT model-ligand dopamine with AutoDock 4.0 (result of top 10) ... 116
x
Table 5.8 Comparison of translocation pathway from the S1 site to the intracellular site residues. Same residues found in these regions are shown in dark. ... 119 APPENDIX B
xi
List of Figures
Figure 1.1. Designated three cases in our study, which is first case with the dopamine transporter as „DAT‟ model, second case with dopamine as „dopamine‟ model and third model with dopamine transporter-dopamine complex as „DAT-dopamine complex‟ model. ... 2
Figure 1.2. Active sites and translocation pathway of dopamine in DAT which are defined in our study. ... 3
Figure 1.3 2D representation of human dopamine transporter. hDAT contains 620 amino acid residues packed onto 12 TMs. N-and C- termini are both in intracellular region [11]. ... 5
Figure 1.4 Secondary structure of LeuT. The leucine transporter forms 12 TMH. The leucine molecule is displayed as a yellow triangle and the two sodium ions are blue circles [11]. ... 6
Figure 1.5 Suggested transport mechanism of dopamine in DAT and effect of Na+ ions [adapted from 32]. ... 7
Figure 2.1. Interactions included in representative potential energy function for MD simulations [69]. ... 12
Figure 3.1. Representation of the melting lipid tails, (a) before the melting of lipid tails, (b) after the melting of lipid tails. ... 19
Figure 3.2. Achieving a good packing of lipids around the protein, (a) before the third preparation stage, here can be seen the gaps in the membrane- protein interface, (b) an equilibrated system. ... 20
xii
Figure 3.3.1. Initial structural model of human DAT which is represented as cylindrical helices in gray, with two Na+ ions in cyan. ... 22
Figure 3.3.2. The human DAT model in the cell membrane represented as a cyan cartoon and two Na+ ions represented as a yellow spheres. ... 23
Figure 3.3.3 The position of the DAT model in a room which is made for DAT in the cell membrane. ... 24
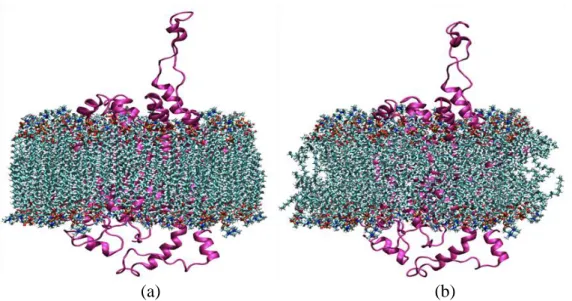
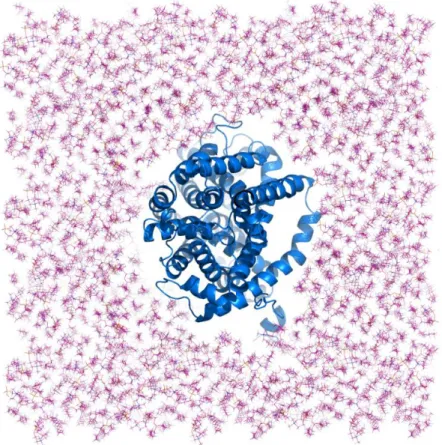
Figure 3.3.4 Initial structural model of human DAT in the physiological environment used for MD simulations. DAT protein is represented as cylindrical helices in cyan, water molecules are shown in blue and lipid molecules are indicated as sticks in pink. ... 25
Figure 3.3.5. Left one initial structural model of human DAT which is represented as cartoon in cyan.Right one after molecular dynamics simulation structural model of human DAT which is represented as cartoon in gray. ... 27
Figure 3.3.6. Structural model of human DAT after molecular dynamics which is represented as cartoon in gray and initial structural model of human DAT which is represented as cartoon in cyan, structural alignment. ... 28
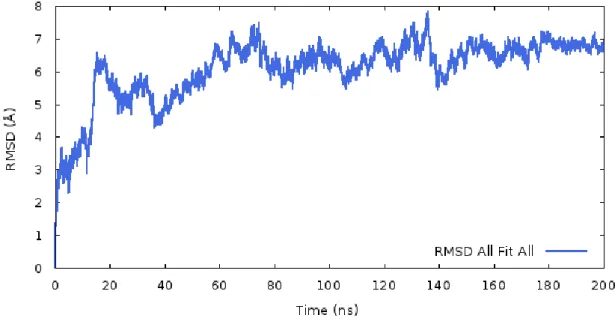
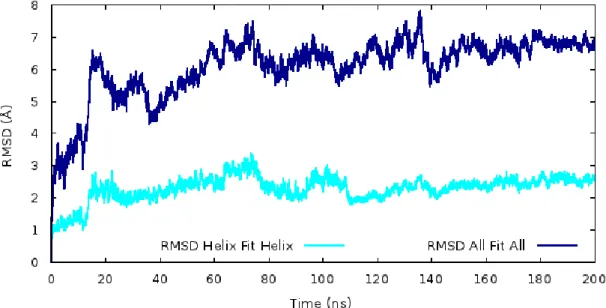
Figure 3.3.7. RMSD values which were obtained from 200 ns MD simulations for DAT model. ... 29
Figure 3.3.8. RMSF profile of DAT model. ... 30
Figure 3.3.9. The positions of the most mobile regions on the structure of DAT model.First loop is shown in magenta, second loop is shown in cyan and third loop is illustrated in blue. ... 30
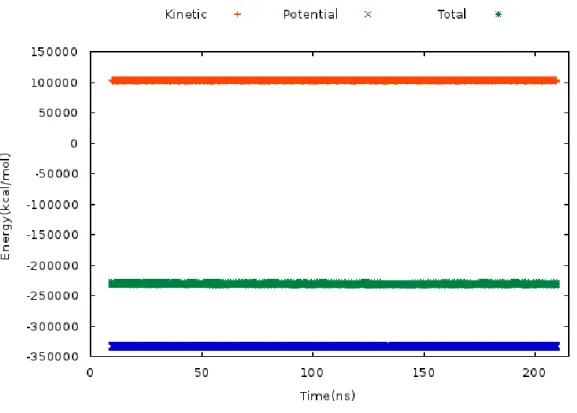
Figure 3.3.10. Kinetic, potential and total energy values of DAT model, which is obtained from MD simulations. ... 31
xiii
Figure 3.3.11. The human DAT cDNA clone amino acid sequences. Boxed regions indicate 12 TMH domains [91]. ... 32
Figure 3.3.12. Representation of the initial DAT model 12 alpha helices. Cyan represents TMH1a-TMH1b, deep blue TMH2, marine blue TMH3, pink TMH4, magenta TMH5, rassperry TMH6a-TMH6b, orange TMH7, green TMH8, teal TMH9, black TMH10, pale-yellow TMH11, deep-purple TMH12... 35
Figure 3.3.13. Representation of the after MD simulation DAT model 12 alpha helices. Cyan TMH1a-TMH1b, deep blue TMH2, marine blue TMH3, pink TMH4, magenta TMH5, rassperry TMH6a-TMH6b, orange TMH7, green TMH8, teal TMH9, black TMH10, pale-yellow TMH11, deep-purple TMH12... 37
Figure 3.3.14. Root Mean Square Deviation values which were obtained from 200 ns MD simulations for all structure and helix regions. ... 38
Figure 3.3.15. RMSF about the average position plotted for residues which were obtained from 200 ns MD simulations for all structure and helix regions. ... 39
Figure 3.3.16. RMSD values which were obtained from 200 ns MD simulations for all helix regions on DAT model. ... 40
Figure 3.4.1. Molecular model and 3D structure of neurotransmitter dopamine. ... 42
Figure 3.4.2. The neurotransmitter dopamine in the cell membrane represented as a cyan dots. ... 44
Figure 3.4.3 The position of the Dopamine in the cell membrane. ... 45
Figure 3.4.4 Neurotransmitter dopamine in the physiological environment used for MD simulations. Dopamine molecule is represented as dots in cyan, water molecules are shown in blue and lipid molecules are indicated as sticks in pink. ... 46
xiv
Figure 3.4.5 First (left one) and second (right one) snapshots of dopamine in the membrane. Dopamine molecule is represented as dots in purple. ... 48
Figure 3.4.6 Third (left one) and fourth (right one) snapshots of dopamine in the membrane. Dopamine molecule is represented as dots in purple. ... 49
Figure 3.4.7 Fifth (left one) and sixth (right one) snapshots of dopamine in the membrane. Dopamine molecule is represented as dots in purple. ... 49
Figure 3.4.8 Seventh snapshots of dopamine in the membrane. Dopamine molecule is represented as dots in purple. ... 50
Figure 3.4.9 The displacement of the dopamine in the 15 ns MD simulations for Dopamine model. ... 51
Figure 3.4.10 Movement of dopamine ligand, step by step in the membrane. ... 52
Figure 3.4.11. Kinetic, potential and total energy values of Dopamine model, which is obtained from MD simulations. ... 53
Figure 3.5.1. Structural model of human DAT and dopamine complex. DAT is represented as cylindrical helices in gray, dopamine shown in cyan dots with two Na+ ions in magenta. ... 54
Figure 3.5.2. Figure above is typical structure of the DAT-dopamine binding complex, snapshottaken from after Autodock. Viewing the dopamine molecule (shown as ball-and-stick) in the complex model. Only helix part of the DAT is shown as cylindiral helices, two Na ions shown as dots in magenta and Cl ions shown as dots in green. Helices 1, 6 and 10 are represented in cyan to indicate the relative position of dopamine in DAT. Figure below one shows that dopamine in the binding site interacts basicly with residues of TMH 1,6 and 10. Residues from DAT within 5 Å of dopamine are labeled and shown in stick style, while dopamin is shown in purple stick. ... 57
xv
Figure 3.5.3. The human DAT and dopamine complex model in the cell membrane DAT represented as a cyan cartoon, dopamine represented as a blue dots and two Na+ ions represented as a yellow spheres. ... 58
Figure 3.5.4 The position of the DAT-dopamine complex model in the cell membrane. ... 59
Figure 3.5.5 Structural model of human DAT and dopamine complex in the physiological environment used for MD simulations. DAT protein is represented as cylindrical helices in cyan, dopamine shown in orange, water molecules are shown in blue and lipid molecules are indicated as sticks in pink. ... 60
Figure 3.5.6. Right Figure is after molecular dynamics simulation structural model of human DAT and dopamine complex. DAT is represented as a cylindrical helices in gray, dopamine shown in cyan dots with two Na+ ions in magenta. Left Figure is structural alignment of complex structures, after and before molecular dynamics simulation and positions of dopamine. Before md simulation complex structure is represented as cylindrical helices in blue, dopamine shown in red dots, after md simulation complex model is represented as similar as in the right figure. ... 63
Figure 3.5.7. Figure above is typical structure of the DAT-dopamine binding complex, snapshottaken from after MD simulation. Viewing the dopamine molecule (shown as ball-and-stick) in the complex model. Only helix part of the DAT is shown as cylindiral helices, two Na ions shown as dots in magenta and Cl ion shown as dots too in green. Helices 1, 8 and 10 are represented in cyan to indicate the relative position of dopamine in DAT. Figure below one shown that dopamine in the binding site interacts basicly with residues of TMH 1, 8 and 10. Residues from DAT within 5 Å of dopamine are labeled and shown in stick style, while dopamin is shown in purple stick. ... 64
Figure 3.5.8. RMSD values which were obtained from 20 ns MD simulations for DAT-dopamine complex model. ... 66
xvi
Figure 3.5.10 RMSD about the average position plotted for 𝐶𝛼 atoms of residues for MD result. ... 67
Figure 3.5.11 RMSF about the average position plotted for residues which were obtained from 200 ns MD simulations of only DAT for all structure and 20 ns MD simulations of DAT with dopamine. ... 68
Figure 3.5.12 Root Mean Square Deviation values which were obtained from 20 ns MD simulations for all helix regions on DAT-dopamine complex model. ... 69
Figure 3.5.13. Kinetic, potential and total energy values of DAT-dopamine complex model, which is obtained from MD simulations. ... 70
Figure 4.1 Clustering of the simulation according to all structural information using a RMSD threshold of 3.00 Å... 75
Figure 4.2 Clustering of the simulation according to binding site region using a RMSD threshold of 1.3 Å. ... 75
Figure 4.3 cont. The best representative members of the first clustering proces, clusters are aligned on initial structure. Initial structure represented as a cartoon in blue and representative from (a) gray: Cluster1; (b) orange: Cluster2 ; (c) cyan: Cluster3; (d) magenta: Cluster4; (e) yellow: Cluster5; (f) purple: Cluster6; (g) green: Cluster7; (h) brown: Cluster8; (ı) red: Cluster9; (j) light pink: Cluster10; (k) dark blue: Cluster11. ... 77
Figure 4.4 cont. The best representative members of the second cluster proces, clusters are aligned on initial structure. Initial structure represented as a cartoon in blue and representative from (a) yellow: Cluster1; (b) pink: Cluster2 ; (c) red: Cluster3; (d) gray: Cluster4; (e) orange: Cluster5; (f) green: Cluster6; (g) purple: Cluster7; (h) cyan: Cluster8. ... 79
xvii
Figure 5.1. A snapshot taken from docking studies of DAT (subcluster at1)-dopamine binding complex (a) and 2D representation of the atomic interactions between the DAT and dopamine (b). ... 88
Figure 5.2 A snapshot taken from docking studies of the DAT (subcluster at2)-dopamine binding complex (a). 2D representation of the atomic interactions between the DAT and dopamine (b). ... 89
Figure 5.3 A snapshot taken from docking studies of the DAT (subcluster at3)-dopamine binding complex (a). 2D representation of the atomic interactions between the DAT and dopamine (b). ... 90
Figure 5.4. A snapshot taken from docking studies of the DAT (subcluster at4)-dopamine binding complex (a). 2D representation of the atomic interactions between the DAT and dopamine (b). ... 91
Figure 5.5. A snapshot taken from docking studies of the DAT (subcluster at5)-dopamine binding complex (a). 2D representation of the atomic interactions between the DAT and dopamine (b). ... 92
Figure 5.6. A snapshot taken from docking studies of the DAT (subcluster at6)-dopamine binding complex (a). 2D representation of the atomic interactions between the DAT and dopamine (b). ... 93
Figure 5.7. A snapshot taken from docking studies of the DAT (subcluster at7)-dopamine binding complex (a). 2D representation of the atomic interactions between the DAT and dopamine (b). ... 94
Figure 5.8. A snapshot taken from docking studies of the DAT (subcluster at8)-dopamine binding complex (a). 2D representation of the atomic interactions between the DAT and dopamine (b). ... 95
xviii
Figure 5.9. A snapshot taken from docking studies of the DAT (subcluster at9)-dopamine binding complex (a). 2D representation of the atomic interactions between the DAT and dopamine (b). ... 96
Figure 5.10. A snapshot taken from docking studies of the DAT (subcluster at10)-dopamine binding complex (a). 2D representation of the atomic interactions between the DAT and dopamine (b). ... 97
Figure 5.11. A snapshot taken from docking studies of the DAT (subcluster at11)-dopamine binding complex (a). 2D representation of the atomic interactions between the DAT and dopamine (b). ... 98
Figure 5.12. Autodock different binding site results of dopamine and DAT model subclusters clustering of all simulations according to the overall structure using a RMSD threshold of 3 Å. Viewing the dopamine in the binding pocket. The binding pocket is represented in molecular surface format, colored with cyan. The dopamine molecule shown as dots in green, in the complex model. ... 99
Figure 5.13. DAT (subcluster at1)-dopamine binding complex snapshot which is taken from docking studies (a). 2D representation of the atomic interactions between the DAT and dopamine (b). ... 103
Figure 5.14. DAT (subcluster at2)-dopamine binding complex snapshot which is taken from docking studies (a). 2D representation of the atomic interactions between the DAT and dopamine (b). ... 104
Figure 5.15. DAT (subcluster at3)-dopamine binding complex snapshot which is taken from docking studies (a). 2D representation of the atomic interactions between the DAT and dopamine (b). ... 105
Figure 5.16. DAT (subcluster at4)-dopamine binding complex snapshot which is taken from docking studies (a). 2D representation of the atomic interactions between the DAT and dopamine (b). ... 106
xix
Figure 5.17. DAT (subcluster at5)-dopamine binding complex snapshot which is taken from docking studies (a). 2D representation of the atomic interactions between the DAT and dopamine (b). ... 107
Figure 5.18. DAT (subcluster at6)-dopamine binding complex snapshot which is taken from docking studies (a). 2D representation of the atomic interactions between the DAT and dopamine (b). ... 108
Figure 5.19. DAT (subcluster at7)-dopamine binding complex snapshot which is taken from docking studies (a). 2D representation of the atomic interactions between the DAT and dopamine (b). ... 109
Figure 5.20. DAT (subcluster at8)-dopamine binding complex snapshot which is taken from docking studies (a). 2D representation of the atomic interactions between the DAT and dopamine (b). ... 110
Figure 5.21. Autodock different binding site results of dopamine and DAT model subclusters. Clustering was performed based on the binding site regions using a RMSD threshold of 1.3 Å for all simulations. Dopamine is shown in the binding pocket as dots in green, while the binding pocket is represented as molecular surface format, colored with blue. ... 111
Figure 5.22 Different binding site results of dopamine and DAT model subclusters clustering of all simulations according to the overall structure using a RMSD threshold of 3 Å. DAT is shown as helices in transparent gray. Positions of dopamine in different subclusters representat as dots which is; subcluster 1 in red, subcluster 2 in green,subcluster 3 in blue, subcluster 4 in yellow, subcluster 5 in magenta, subcluster 6 in cyan,subcluster 7 in orange, subcluster 8 in gray,subcluster 9 in brown, subcluster 10 in limon and subcluster 11 in dirty violet. ... 113
Figure 5.23 Different binding site results of dopamine and DAT model subclusters clustering of all simulations according to the binding site regions using a RMSD threshold of 1.3 Å. DAT is shown as helices in transparent pink. Positions of dopamine in different subclusters representat as dots which is; subcluster 1 in red,
xx
subcluster 2 in green,subcluster 3 in blue, subcluster 4 in yellow, subcluster 5 in magenta, subcluster 6 in cyan, subcluster 7 in orange and subcluster 8 in gray ... 114
Figure 5.24 Autodock binding site result of dopamine and initial DAT model.The binding pocket is represented in molecular surface format, colored with cyan. The dopamine molecule shown as dots in blue, in the complex model. ... 117
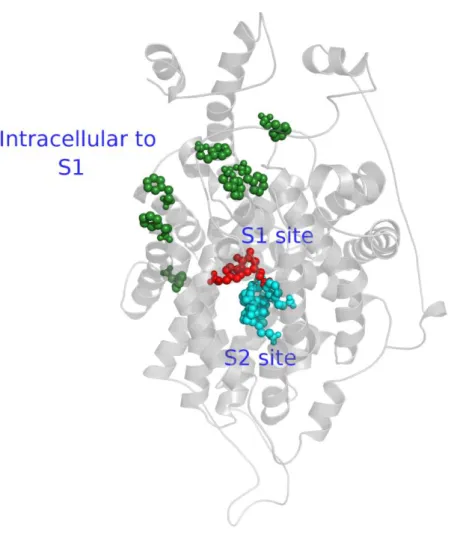
Figure 5.25 The subsrate binding sites of DAT. S1 site is represented as spheres, colored with red and S2 site is represented as spheres too and colored with cyan. The TMHs 1, 3, 6, 8 and 10 which are interacting with S1 and S2, are shown as a cylindrical helices in gray. ... 118
Figure 5.26 Different binding site results of dopamine and DAT model subclusters which are obtained from; clustering of all simulations according to the binding site regions using a RMSD threshold of 3 Å (left one) and clustering of all simulations according to the binding site regions using a RMSD threshold of 1.3 Å (right one). DAT is shown as helices in transparent gray (cluster 3) and pink (cluster 1.3). Positions of dopamine in different subclusters are labeled and represented as dots which is; S1 in red, S2 in cyan, the substrate translocation pathway from the S1 site to the intracellular site in green and finally purple is untitled... 119
Figure 5.27 Active sites and translocation pathway of dopamine in DAT which are defined in our study.Positions of dopamine through the simulation are labeled and represented as spheres which is; S1 in red, S2 in cyan, the substrate translocation pathway from the S1 site to the intracellular site in green. ... 120
xxi
List of Abbreviations
DAT Dopamine Transporter
SERT Serotonin
NET Norepinephrine
GAT Gama-aminobutyric acid
HEK Human embryonic kidney cells
LeuT Leucine Transporter
NSS Neurotransmitter sodium symporters
BM Best Members
S1 Primary binding site
S2 Secondary binding site
TMH Transmembrane helices
POPC Palmitoyloleoyl phosphatidylcholine
VMD Visual Molecular Dynamics
NAMD Nanoscale Molecular Dynamics
PDB Protein Data Bank
RMSD Root Mean Square Deviation
RMSF Root Mean Square Fluctuation
1
Chapter 1
Introduction
In this thesis, firstly the structure-function relationship of the human dopamine transporter (DAT) and the dopamine is addressed via Molecular Dynamics (MD) simulations. Throughout the study, we developed three cases. The first case is the dopamine transporter as a „DAT‟ model, the second is the „dopamine‟ model and the third is the „DAT-dopamine complex‟ model. Comparing the outcomes of the simulation for these three cases, we wanted to reveal the binding properties and dynamics of DAT and dopamine. Afterwards, for study the dopamine translocation mechanism, we used different conformations of DAT model which are obtained from clustering analysis as explained in the next chapter. To explore the pathway and different binding sites, we have performed binding analysis. DAT and dopamine for the binding analysis we used a docking software, AutoDock 4.0. The dopamine-binding modes were determined through the calculation of dopamine-binding free energies. We observed that there is a striking accordance between the identities of the key residues in the transport mechanism. Our results were in a good agreement with the experimental datas in the literature.
In Chapter 2, we give the basic theory of Molecular Dynamics and mention the how it is applied. There we give a brief explanation of Force Field interactions and how it initializes the system in MD. Furthermore, we introduce the algorithms used for these process. And than trajectory analysis is explained, briefly, which are RMSD, RMSF and Clustering.
2
Figure 1.1. Designated three cases in our study, which is first case with the dopamine transporter as „DAT‟ model, second case with dopamine as „dopamine‟ model and third model with dopamine transporter-dopamine complex as „DAT-dopamine complex‟ model.
In Chapter 3, we introduce the methods that we used to perform MD simulations in the membrane for our three cases which are “DAT” model, “dopamine” model and “DAT-dopamine complex” model, shown in Figure 1.1.
In the Chapter 4, we intruduce the process of clustering which is performed on “DAT” model long MD simulation result.As a result of this process, we obtained 19 different conformations of DAT.
Chapter 5 and Chapter 6 encompass the basic theory of molecular docking and interaction of protein- ligand which have two main categories scoring function and docking algorithm, and methods of AutoDock 4.0.
3
Figure 1.2. Active sites and translocation pathway of dopamine in DAT which are defined in our study.
Finally, in Chapter 7 by using Autodock 4.0 program, DAT‟s natural ligand dopamine docked with DAT model at different conformations which are obtained from clustering process. Then we analyzed the different binding sites and translocation pathway of dopamine on DAT shown in Figure 1.2.
4 1.1 Literature Search
Cell membranes do not allow across extracellular water-soluable ligands to inside of the cell [1,2]. Critical ligands and ions across the membrane within the specialized molecules which are developed by cells catalyze the transportation. A class of these molecules is known as transmembrane spanning proteins which helps external solutes to across the membrane .
Membrane proteins are responsible for vital physiological activities, and they comprise one third of all proteins encoded by eukaryotic genome and occupy approximately 50 % of the volume of all biological membranes [3,4]. The human dopamine transporter (hDAT) exhibits the general properties of membrane proteins [5].Transmembrane proteins are amphiphilic proteins and their structure is defined by the interaction of the hydrophobic lipid bilayer with the polar peptide bonds.These proteins form secondary structures, in order to adapt to the hydrophobic environment.The majority of membrane proteins, including the dopamine transporter, form α-helical structures with hydrogen bonds between carbonyl and amide groups [6,7].
Despite the importance and abundance of transmembrane proteins, few have been structurally determined because they are very difficult to study due their low expression levels and solubilization challenges [8,9].
As mentioned before, the dopamine transporter (DAT) shares properties of membrane proteins and it is situated on the presynaptic membrane of dopaminergic neurons [10]. Its 620 amino acids are organized into 12 transmembrane domains with N- and C-terminals situated intracellularly represented in Figure 1.3. In most integral proteins, the disulfide bond between C180 and C189 in extracellular loop 2 facilitates the secondary structure of the transporter [10].
5
Figure 1.3 2D representation of human dopamine transporter. hDAT contains 620 amino acid residues packed onto 12 TMs. N-and C- termini are both in intracellular region [11].
Neurotransmitter sodium symporters (NSS) terminate synaptic transmission and recycle neurotransmitters for reuse in the nervous system and the human dopamine transporter belongs to this family [12-14]. NSSs family is also called the sodium- and chloride-dependent neurotransmitter transporter family (SLC6) according to the Human Genome Organization nomenclature [15]. The mentioned proteins serve as secondary active transporters by using the Na+ gradient through plasma membrane of presynaptic neuron. This action accelerates the re-ingestion and ingestion of several neurotransmitters from extracellular cytoplasm as opposed to their concentration gradient regarding a symport mechanism. [8,16]. Neurotransmitter sodium symporters are placed in the plasma membranes of neuronal/astrogial cells and the uptake of neurotransmitters is one of the mechanisms that ends neurotransmission [17].
Biogenic amines and its transporters, such as, dopamine (DAT), γ-aminobutyric acid (GAT), norepinephrine (NET), glycine and serotonin (SERT) transporters belong to NSS family [18-19]. First studies to understand the NSS structure Aquifex aeolicus’ leucine transporter (LeuTAa), a member of NSS family, crystal structure was used
6
[20]. The sequence identities between prokaryotic LeuT and eukaryotic is low level identity; DAT (20%), SERT (21%), and NET (24%), respectively [21]. Despite this overall low sequence homology, a few regions are greatly preserved throughout the family. Therefore, the crystal structure of LeuT has the relevant information available regarding the NSS family structure [21-23]. The conservation of TMH 3, 8, 6, and 1, which form the ligand binding site in leucine transporter, suggests that they are involved in substrate transport and are essential for function [20].
The LeuT consists of 12 transmembrane domains that are organized in such way that the leucine (the substrate) binding pocket of the transporter is formed by pseudo-twofold packing of TM1-TM5 and TM6-TM10 superimposed domains shown in Figure 1.4 and these TMs are in direct contact with the sodium ions.When correlated the molecular structure of LeuT and other Na+/Cl– dependent transporters, is determined TM1 and TM6 are placed near the leucine binding site play a vital role in the substrate binding of DAT, NET, and SERT as well, and additionally, TM3 and TM8 are participating in the substrate and 𝑁𝑎+ ion binding [20]. Like all NSS family members, the molecular structure of human DAT shares similarities with the structure of leucine transporter and contains 12 TMH attached by extracellular and intracellular loops.
Figure 1.4 Secondary structure of LeuT. The leucine transporter forms 12 TMH. The leucine molecule is displayed as a yellow triangle and the two sodium ions are blue circles [11].
7
The focus of my thesis is on human dopamine transporter (hDAT) and its function. Its function is simply re-uptake of dopamine which helps regulate the concentration and duration of dopaminergic transmission [24,25]. All of in NSS family members, DAT is of particular interest because it is targets for the action of legion drugs, incorporating the extensively abused psychostimulants amphetamine and cocaine, as well as for antidepressant drugs [1,26]. A particularly well-studied biogenic amine is dopamine (a catecholamine intermediate in the biosynthesis of epinephrine and norepinephrine), whose receptors are important targets for especially curing schizophrenia and Parkinson‟s diseases [27,28]. Hence, dopaminergic neurotransmission is very important for mediating lots physiologic treats incorporating reward-seeking behavior, addiction, lactation and movement [29,30].
Figure 1.5 shows the neurotransmission in the dopamine synapse, simply. The dopamine molecules bind to the dopamine receptors of the postsynaptic membrane, leading to the further propagation of the signal and cellular response.
Figure 1.5 Suggested transport mechanism of dopamine in DAT and effect of 𝑁𝑎+ ions [adapted from 32].
The reuptake mechanism of dopamine is dependent co-transport of 𝑁𝑎+and 𝐶𝑙−, and follows a sequence of events where one dopamine molecule or two sodium ions
8
initially bind to the DAT, followed by binding of one chloride ion to the transporter [32]. The inwardly directed 𝑁𝑎+slope supplies energy for an inward repositioning of dopamine molecule against a density slope [33]. For the replacement of dopamine 𝑁𝑎+ is needed by the transporter and it has been considered that, when the dopamine recognizes the dopamine transporter and interacts with it, it means that uptake cycle is starting [34]. However, the role of 𝑁𝑎+ in this initial identification stage is under debate [35].
According to recent studies, co-transportation of two 𝑁𝑎+ ions and one 𝐶𝑙− ion with a dopamine molecule is simpler than the interaction of these ions with the transporter of dopamine [33,35-39]. 𝑁𝑎+-dependent dopamine molecule uptake kinetic analysis by human embryonic kidney cells (HEK) indicating the human DAT propose a sequential binding order of dopamine molecule and 𝑁𝑎+with 𝑁𝑎+ binding a head of dopamine [36,37]. Electrophysiological reckonings on oocytes expressing the human dopamine transporter indicate obstructe of transporter-mediated leak streams by dopamine molecule in the conclude non-attendance of 𝑁𝑎+. Although the later examination negates an accurate requisite for 𝑁𝑎+ in dopamine binding, a stimulatory character for 𝑁𝑎+is still a chance [35].
Investigation of the structural needs for the interaction of substances with DAT have been carried out in different study and it has been performed with the help of observing the phenylethylamine derivatives which passes through the preparations. According to studies mentioned, a phenyl ring bearing a ethylamine side chain is required for optimum activity of dopamine transporter and it has been seen that transportation of 𝛽 rotamer of the full scale configuration of catecholamines favorably occurs. It has been suggested that the recognition of substrate has been carried out via reconcilation of catechol when the structural alteration of the transporter has been enabled by the amine side chain, thus the transportation of dopamine through the membrane takes place [40].
As mentioned above DAT‟s structure-function affiliations have been experimentally studied commonly, using both deletion mutagenesis and cross-linking, in addition site-directed, engineering of metal binding sites, and replaced cysteine accessibility
9
ways [41-48]. However, dopamine transporter dynamics transport mechanism details, is still not very clear.
Dopamine transporter in Human has a bacterial homolog which is LeuT. Recently crystallized structure of LeuT , provides insight into the three dimensional structure of dopamine transporter [49-54]. Although previous studies about Leut support the significant structural data of DAT, they do not give any important information about the transportation mechanism.
The substrate is at the center of the protein in the initial Leut structure. To better understanding the mechanism of LeuT and other NSS transporters, several ways have been suggested in spite of the abundance of the current studies of Leut and other transporters which provides necessary structural information [55]. For instance, Gouaux et al. have suggested that there are two other conformations which are outward-facing and inward-facing [54] and this procedure is consistent with the previous studies of transporters [56]. Structural modeling studies carried out by experimentalists reveals the symmetry properties of NSS family [57,58]. The functional mechanisms of the proteins which resemble to Leut according to their structures have been investigated by computational simulations with utilizing high resolution structural data (eg., see [59-67]). Although cooperation of experimental and computational studies is not complete yet, it proposes that functional mechanisms of the human neurotransmitter transporters in NSS family is not as simple as expected in the transition between inward-facing and outward-facing form [68].
On the other hand, Jufang et al. have performed the flux and binding experiments and have suggested that the substrate which fills the S1 and S2 site and in the extracellular S2 site also serves as a “symport effector” by initiating the release of 𝑁𝑎+ into the cell [55].
With combining all computational and experimental studies explained in this part, it has been concluled that former MD simulations helps revealing the information about the structural elements which are essential for binding state of substrate and DAT occluded state formation but there are still doubts about the role of LeuT-like
10
S2 binding site and whether S2-bound substrate plays also role in adjusting DAT function like in Leut case or not.
11
Chapter 2
Theoretical Background for MD Simulations
MD simulation is one of the main tools in the theoretical study of dynamics behavior of biological macromolecules. By this computational technique, the time dependent behavior of a biomolecular system is calculated. Atoms may interact with each other by using empirical potential energy functions or force fields and forces acting on atoms are calculated for a given configuration based on these functions or fields. With the help of the integration of Newton‟s equation of motion (shown below), a successive configuration of the system along the time trajectory is obtained.
𝑑2𝑅𝑖 𝑑𝑡2 =
𝐹𝑖
𝑚𝑖 (2.1)
Here, 𝑅𝑖 represents the position of particle i, and 𝐹𝑖 is the total force acting on particle i exerted by all other molecules, and mi its the molecular mass.
2.1. Force Fields
To describe the association of chemical structure to energy, mathematical equations are applied in theoretical chemistry. The potential energy of a system is described by force fields as a function of the atomic positions/coordinates. As shown in Figure 2.1, Molecular Dynamic simulations are modelled on empirical model of interactions within a system that involves stretching of bonds, bending and also nonbonded interactions,
12 𝑉 𝑅1, … . , 𝑅𝑁 = 𝑘𝑙𝑖 2 𝑏𝑜𝑛𝑑𝑠 𝑙𝑙𝑖−𝑙𝑖,0 2+ "Bond Stretching" 𝑘𝜃𝑖 2 𝑎𝑛𝑔𝑙𝑒𝑠 (𝜃𝑖 − 𝜃𝑖,0)2+ " Angle Bending " (2.2) 𝑉𝑛 2 𝑡𝑜𝑟𝑠𝑖𝑜𝑛𝑠
1 + cos 𝑛𝜙𝑖 − 𝛿𝑖 + "Bond Rotation (torsion)"
4𝜀𝑖𝑗 𝜎𝑖𝑗 𝑟𝑖𝑗 12 − 𝜎𝑖𝑗 𝑟𝑖𝑗 6 + 𝑞𝑖𝑞𝑗 4𝜋𝜀0𝑟𝑖𝑗 𝑁 𝑗 =𝑖+1 𝑁 𝑖=1 "Nonbonded interactions"
Figure 2.1. Interactions included in representative potential energy function for MD simulations [69].
13
In the equation above, 𝑉 𝑅1, … . , 𝑅𝑁 represent the potential energy and this is a function of the coordinates (Ri) of N atoms or particles. In the equation the first term represents the interaction of pairs of bonded atoms and li is the bond length. The second term is based on Hooke‟s Law and it is the sum of the angles in the molecule which is modeled as a harmonic potential, where 𝜃𝑖and 𝜃𝑖,0are the instantaneous and the equilibrium angle of the bond, respectively. In the equation, the third term describes the torsional potential and the fourth equation represents the non-bonded interactions which are represented by two different potentials. The first one is the LennardJones 126 potential function that accounts van der Waals interactions, while the second one is the Coulomb potential for electrostatic interactions [70,71].
2.2. Initialization of the System
To perform an MD simulation, it is necessary to designate a preliminary configuration of the system by specifying 3N atomic coordinates (Ri) at time = 0. The preliminary configuration can be produced by using emprical data such as X-ray crystal structure. The preliminary velocities can be determined in accordance with the MaxwellBoltzmann distribution at the initial temperature after the preliminary configuration of the system is minimized in a solvent box or cell membrane [70]. After the setting up of the system, the potential energy is calculated by the following equation;
𝐹𝑖 = −∇𝑈𝑖 𝑅𝑖, … . , 𝑅𝑁 =𝜕𝑈 𝑅𝑖, … . , 𝑅𝑁
𝜕𝑅𝑖 (2.3)
After the calculation of the force by potential energy function on each atom at time t, the next step is to generate the new conformation at time t + Δt according to the Equation (2.1). There are various numerical algorithms to perform the integration of Equation 2.1. One of the most commonly used algorithms in MD simulations is Verlet algorithm [4]. Verlet algorithm works by the addition and subtraction of the Taylor series expansions for the time dependence of the coordinates Ri at times t – Δt and t + Δt.
14 𝑅𝑖 𝑡 + ∆𝑡 = 𝑅𝑖 𝑡 + 𝑉𝑖 𝑡 ∆𝑡 + 1 2𝑎𝑖 𝑡 ∆𝑡2 + ⋯ (2.4) 𝑅𝑖 𝑡 − ∆𝑡 = 𝑅𝑖 𝑡 − 𝑉𝑖 𝑡 ∆𝑡 + 1 2𝑎𝑖 𝑡 ∆𝑡2 + ⋯ (2.5) Adding these equations together and combining with Equation (2.1) produces:
𝑅𝑖 𝑡 + ∆𝑡 ≈ −𝑅𝑖 𝑡 − ∆𝑡 + 2𝑅𝑖 𝑡 + ∆𝑡2𝑎𝑖 𝑡 (2.6)
The velocities can be accounted by the difference of the locations at t - Δt and t + Δt :
𝑉𝑖 𝑡 ≈ 1
2∆𝑡 𝑅𝑖 𝑡 + ∆𝑡 − 𝑅𝑖 𝑡 − ∆𝑡 (2.7)
A bit different versions of the Verlet algorithm have been offered to raise the accuracy in calculation of positions and velocities like Leapfrog algorithm [73] and the velocity Verlet method [74]. The velocity Verlet method, accelerations velocities, and positions, at time t + Δt are taken from the same quantities at time t. Furthermore, this method does not involve precision [70,71].
𝑅𝑖 𝑡 + ∆𝑡 = 𝑅𝑖 𝑡 + 𝑉𝑖 𝑡 ∆𝑡 +1
2𝑎𝑖 𝑡 ∆𝑡2 (2.8) 𝑉𝑖 𝑡 + ∆𝑡 = 𝑉𝑖 𝑡 +1
2∆𝑡 𝑎𝑖 𝑡 + 𝑎𝑖 𝑡 + ∆𝑡 (2.9)
The algorithm is carried out as a threestage procedure because as can be seen from Equation (2.8), the accelerations at t and t + Δt should calculate new velocities. First, positions at t + Δt are calculated in accordance with Equation (2.7) and the velocities at time t + Δt/2 are assessed by the following equation:
𝑉𝑖 𝑡 + ∆𝑡
2 = 𝑉𝑖 𝑡 + 1
2∆𝑡𝑎𝑖 𝑡 (2.10)
Then, forces are calculated from the current positions to obtain the acceleration, a(t + Δt). In the final step, the velocities at time t + Δt are computed by:
15 𝑉𝑖 𝑡 + ∆𝑡 = 𝑉𝑖 𝑡 + 1 2∆𝑡 + 1 2∆𝑡𝑎𝑖 𝑡 + ∆𝑡 (2.11) 2.3. Trajectory Analysis
2.3.1. Root Mean Square Deviation (RMSD)
RMSD is the square root of the summation of the squares of the distances between corresponding atoms of x and y (Equation 2.12). RMSD is a measure of average atomic displacement between two conformations. In terms of formule, given N atom positions from structure x and the corresponding N atoms from structure y; the RMSD is defined as:
𝑟𝑚𝑠𝑑 =
𝑁 (𝑑𝑖2) 𝑖=1
𝑁 (2.12)
2.3.2. Mean Square Fluctuation (MSF)
The mean square fluctuation (MSF) is a measure of the variation of the position of the atoms from the average structure. MSF is based on the mobility of structure [71]. It is determined by the following equation:
𝑀𝑆𝐹 = 𝑅𝑖 𝑡 − 𝑅𝑖 𝑇 𝑅𝑖(𝑡) − 𝑅𝑖 (2.13)
Where <Ri> is the vector of time average of the cartesian coordinates of the Cα atom of the 𝑖𝑡ℎresidue, and is the vector of the cartesian coordinates of the Cα atom of the same residue at time t. The square root of MSF is Root Mean Square Fluctuation (RMSF) [71].
16 2.3.3. Clustering Analysis
With the help of MD simulations, large number of conformations is produced. k-means clustering method that is part of the kclust module of Multiscale Modeling Tools for Structural Biology (MMTSB) Tool Set [75] is used to reduce the conformational space and identify a few distinct clusters or conformational states that are generated during the simulation. For every cluster, there is a centroid or an average structure of all the constituents in the cluster. Frames are designated to clusters based on their RMSD value with regard to the centroids of the clusters. k-means clustering seeks to minimize the within cluster summation of squares of distances of each element from the centroid. This process is repeated until all the frames are designated to a cluster. After each iteration step, the centroids and the clusters are updated. Lastly, the conformation -which is closest to the centroid- is opted as the representative snapshot of that cluster [71].
17
Chapter 3
Molecullar Dynamics Simulations
3.1. Introduction
Membrane proteins are important in many biological aspects. Membrane proteins which are thought to constitute approximately 30% of genomes are the targets of more than half of all drugs [76,77]. High resolution crystal structures of membrane proteins is less than 1% of the total number of structures, because the crystallization and expression problems. Eliciting of protein structures and variations of this structures are very important for the drug design.
Most of membrane proteins change their conformations a lot during completing their function. Experimentally, crystallography is not able to catch all these conformational changes. On the other hand, by computational means it is possible to observe the dynamics time variable behavior. Therefore, in silico methods are used in this thesis work. MD is one of the powerful computational tools that, additionally provides information with respect to the stability of a membrane protein, can also yield insight into the dynamic behavior in which these distinct states [78]. To investigating trial hypotheses in idealised systems in which one can discover fundamental biophysical principals governing a process can be obtained by MD simulations and also it represents in vivo systems as closely as possible [78,79].
In this thesis, the structure-function relationship of the human DAT and the dopamine is addressed via MD simulations. Throughout the studies, we designated three cases, first case with the dopamine transporter as DAT model, second case with dopamine as dopamine model and third model with dopamine transporter-dopamine complex as DAT-dopamine complex model. Comparing the outcomes of the
18
simulation for these three cases, we wanted to reveal the binding properties and dynamics of DAT and dopamine.
3.2. Methodology: Steps of MD Simulation
The system preparation of an MD simulation consists of five stages: obtaining a pre-equilibrated lipid bilayer, alignment of protein in the lipid bilayer, removal of overlapping lipid molecules, equilibration of new system and production. Furthermore, during the run of MD simulation there are two main stages, equilibrium and production.
As stated in the common methodology, determination of simulation time depends on the enough equilibration of the system. In this work, before the equilibration, a pre-equilibration is applied. The alignment of the pre-equilibrated lipid bilayer with the protein is performed artificially. Protein is embedded in pre-equilibrated lipid bilayer and overlapping lipids eliminated. The resulting system that have a vacuum in between the lipid molecule and the protein provide an elimination of whole overlapping lipid molecules.Lipid molecules relax around the protein during the first stage of the equilibration. Following these, water molecules which are required as the system features, are added to the system and the system is ionized for neutralization. After this stage, the system is ready for MD and it is exposed to energy minimization and production runs upto number of steps depending on the system properties. The simulation protocols were performed as explained below in four different MD simulation steps.
3.2.1. Melting of Lipid Tails
Lipid molecules are the basic components of the biomembranes. They have large number of structural forms. The most abundant lipids are the glycerophospholipids (or phosphoglycerides) [80]. Melting of the lipid hydrocarbon ends is the initial protocol of MD simulations. The lipid bilayer was generated using the membrane builder plugin available in the Visual Molecular Dynamics (VMD) software and comprise of a bilayer of palmitoyloleoyl phosphatidylcholine (POPC) residues. This
19
first stage melting refers to a process that gives the cell membrane a fluid-like bilayer. VMD is made of lipid molecules unrealistically smooth shown in Figure 3.1 (a). For this reason, in this stage of simulation everything (lipid headgroups,ions, water, protein) is fixed except the lipid tails, lipids allowed to move freely. The system was run 1000 steps of minimization under these conditions, then velocities were reset according to the desired temperature, and then it was run for 0.5 ns (using a 2 fs timestep). After these procedures, the structure of lipid molecules have gained a more realistic liquid form shown in Figure 3.1 (b).
(a) (b)
Figure 3.1. Representation of the melting lipid tails, (a) before the melting of lipid tails, (b) after the melting of lipid tails.
3.2.2. Minimization and Equilibration with Protein Constrained
The system is still not ready for running dynamics. Because of many unnatural atomistic positions MD be can safely run. Minimization will be then followed by an equilibration with the protein constrained, so as to permit the cell membrane and water molecules to relax first. The system under these conditions Nanoscale Molecular Dynamics (NAMD) was run 10000 steps of minimization and then it was run dynamics for 0.5 ns (using a 2 fs timestep). During the equilibration, some forces are applied on water molecules, which are the close enough to get into the cell
20
membrane, in order to prevent hydration of the membrane-protein interface. At this stage, the system reaches the local minimum faster with the protein constrained.
3.2.3. Equilibration with Protein Released
Following the earlier stage, where lipids are well packed around the protein, while water has not entered forbidden regions, the harmonic constraints are released and further the whole system is equilibrated. In third preparation step, a little shrink has occurred at the surface area of xy plane of the cell membrane shown in Figure 3.2. The lipid molecules, which tend to get closer to the protein is caused the reduction in volume. The decrease in volume in xydirections is compensated by an increase in volume in the z direction, so that the system could keep its initial volume and pressure of 1 atm.The system under these conditions is exposed to MD simulation of 0.5 ns (using a 2 fs timestep).
(a) (b)
Figure 3.2. Achieving a good packing of lipids around the protein, (a) before the third preparation stage, here can be seen the gaps in the membrane- protein interface, (b) an equilibrated system.
21 3.2.4. Production Runs
After a detailed preparation stage consisting of melting of lipid tails and relaxation of water and lipids, we have a more equilibrated solvated system containing the protein of interest, and we started a production simulation. A series of energy minimization and MD simulations of 200 ns for the DAT model, 15 ns for the dopamine model and 20 ns for the DAT-dopamine complex model have been performed by using NAMD 2.7 software package. NAMD is a parallelized MD program which is designed to run on multiple cores [81], and therefore we have performed our runs in paralel. For the interaction potentials, CHARMM22 force field for protein and CHARMM27 force field for lipids was used. TIP3W model was used for all water molecules. All of the simulations have been performed at 310K within phosphatidylglycerol membrane (POPC). The total number of atoms in each system is given in following Table 3.1.
Table 3.1. Total number of atoms and water molecules at three simulations.
Model DAT dopamine DAT-dopamine complex
Lipid 43.952 52.126 43.684
Water 33.882 35.164 34.310
Ion ( 𝑵𝒂+/𝑪𝒍−) 2/- 1/8 2/5
Totally 155.293 158.100 156.188
3.3. Molecular Dynamics (MD) Simulations of Dopamine Transporter
In examining the dynamic structure of proteins, especially membrane proteins, physiological environment have a major effect. Therefore, the protein has been studied along with, water molecules and lipid cell membrane which is its natural environment. To be able to perform MD studies, an initial 3D structure of the protein is required. Homology modeling studies were performed for that purpose before hand in a previous thesis work of a collegue [133].
22
Homology modeling also known as comparative modeling, is a tool for the estimation of threedimensional (3D) structure of a protein by performing amino acid sequence alignment to template proteins whose 3-D structures are already resolved experimentally. The first experimentally study of DAT in literature is the determination of the 3D structure of LeuTAa which is a bacterial homolog which is extracted from Aquifex aeolicus „s complex of substrate LeuT and two Na+ ions (PDB code: 2A65, Resolution: 1.65 Å) [23].
Figure 3.3.1. Initial structural model of human DAT which is represented as cylindrical helices in gray, with two 𝑁𝑎+ ions in cyan.
The new three-dimensional (3D) structural model of human DAT is obtained with homology modeling, via two different template structures, which are bacterial homolog of DAT leucine transporter (LeuTAa) and the protein DAT of rat in the thesis of Gizem Tatar [133]. We have used that 3D structure of DAT as our initial structure for MD simulations shown in Figure 3.3.1. In this chapter we examined the „DAT‟ model system preparation stages for Molecular Dynamics (MD) simulations, simulation details and how it behave in the membrane without dopamine.
23 3.3.1. System Preparation for MD
The initial DAT model was put into a preequilibrated double-layered palmitoyloleoyl- phosphatidylcholine (POPC) cell membrane to simulate the actual physiological environment .The POPC bilayer was generated by using the Membrane Plug-in v1.1 of VMD software and cell membrane has been generated at the direction of zaxis with a constant thickness. DAT protein is embedded in the membrane according to its hydrophobic part. It‟s relative orientation in the lipid bilayer was determined by referring the similar orientation of the LeuTAa structure [20,82-84,23] shown in Figure 3.3.2.
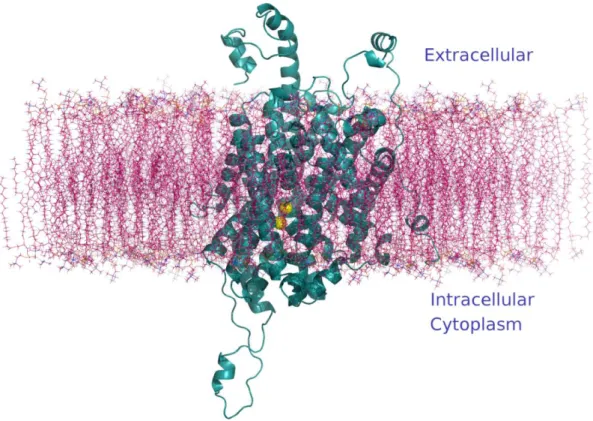
Figure 3.3.2. The human DAT model in the cell membrane represented as a cyan cartoon and two 𝑁𝑎+ ions represented as a yellow spheres.
Direction of the x and y dimensions of the cell membrane have been determined according to the same direction of protein‟s x and y dimensions. The distance between min and max coordinates in the x direction is found to be 73Å, distance between two farthest atoms in the protein. The same way, the distance between min and max coordinates in the y direction is found to be 99Å. Accordingly, the protein‟s dimensions in the x direction and y direction are determined to be 73Å and 99Å. The
24
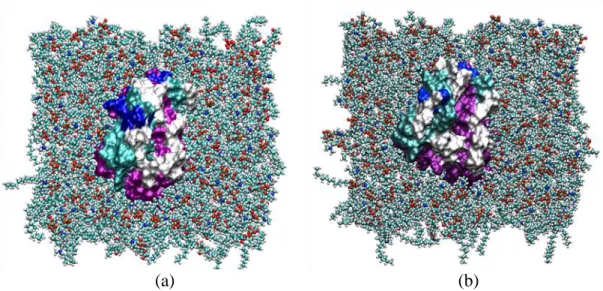
membrane‟s dimensions in this directions are set to 120Å × 120 Å, in order to avoid the any interaction between the protein and its own image in the periodic box at this direction. For alignment of the membrane and the protein, the membrane's center of mass was chosen as the origin and it is combined with the protein-water system. In the next step, a room is made for the DAT in the membrane layer as shown in Figure 3.3.3. Cut-off distance between protein and lipid is usually set 0.8 Å-1.6 Å. By that way, overlap between the protein and any lipid molecules is avoided.
Figure 3.3.3 The position of the DAT model in a room which is made for DAT in the cell membrane.
After the protein is embedded in the cell membrane whole system was solvated. The distance between min and max coordinates in the z direction is found to be 75Å distance between two farthest atoms in the protein. TIP3W water molecules with a thickness of around 12 Å at both directions of z-axis are added to the cell membrane and protein. The dimension of the system at this direction is set to 100 Å. You can see in Figure 3.3.4. the final situation of the system along with cell membrane and
25
water molecules at the x direction. The protein‟s dimensions at x,y and z directions, approximate cell dimensions and dimensions of the system is given in following Table 3.2.
Table 3.2. The DAT, cell membrane and system dimensions.
Protein Dimension xyz (Å) Cell Membrane xy (Å) Box Dimensions xyz (Å) 73×99×75 120×120 120×120×100
Figure 3.3.4 Initial structural model of human DAT in the physiological environment used for MD simulations. DAT protein is represented as cylindrical helices in cyan, water molecules are shown in blue and lipid molecules are indicated as sticks in pink.
2 𝑁𝑎+ ions were added with a concentration of 0,154 mol/L by Autoionize Plugin v1.2 of VMD to make the total net charge of the system equal to zero.
26
3.3.2 Simulation Details and Production MD run
A series of energy minimizations and MD simulations were performed by using Nanoscale Molecular Dynamics (NAMD) software package. At the first preparation stage, only lipid molecules are allowed to be mobile, protein is fixed. The system was run 10000 steps of energy minimization under these conditions and later MD simulation of 0.5 ns was performed. Next, water molecules and the cell membrane are allowed to move freely and the harmonic constraints have been imposed on the protein. Similar to the first stage, the system under these conditions is exposed to a 1000 step minimization followed by an MD simulation of 0.5 ns. The protein released along with surrounding molecules is exposed to an MD simulation of 0.5 ns, at the third preparation stage. After a detailed preparation stage an MD simulation of 200 ns for the whole system have been performed. The simulation details are tabulated in Table 3.3.
Table 3.3 DAT simulation system details.
Simulation Length (ns) Final System Size xyz (Å) Number of Water Molecules Number of Lipids Number of Ions Total Number of Atoms 200 125×125×120 33.882 43.952 2 155.293
CHARMM22 force field for protein and CHARMM27 force field for lipids were used for the interaction potentials. Temperature of the simulation was set to 310K and the pressure was kept at 1 bar by Berendsen weakcoupling approach (Berendsen et al., 1984). The simulation space partitioning parameter cutoff was set to 12 Å. The other simulation space partioning parameter „pairlistdist‟ which is distance between pairs for inclusion in pair lists was set to 13.5 Å. PME (ParticleMesh Ewald) method was used for long-range electrostatic interactions. The „timestep‟ parameter was set to 2.0 fs. The„nonbondedFreq‟ which is timesteps between two nonbonded evaluation was set to 1 and the „fullElectFrequency‟ parameter which is distance between pairs for inclusion in pair lists was set to 2. „useGroupPressure‟, „useFlexibleCell‟ and „useConstantArea‟, which are the pressure control parameters, were set to yes.