Copyright © 2016 Techno-Press, Ltd.
http://www.techno-press.org/?journal=sem&subpage=8 ISSN: 1225-4568 (Print), 1598-6217 (Online)
Investigation of shear effects on the capacity
and demand estimation of RC buildings
Mehmet Palanci
1a, Ali Kalkan
2band Sevket Murat Senel
21
Department of Civil Engineering, Istanbul Arel University, Istanbul, 34537, Turkey
2
Department of Civil Engineering, Pamukkale University, Denizli, 20000, Turkey (Received October 17, 2015, Revised September 7, 2016, Accepted October 6, 2016)
Abstract.
Considerable part of reinforced concrete building has suffered from destructive earthquakes in Turkey. This situation makes necessary to determine nonlinear behavior and seismic performance of existing RC buildings. Inelastic response of buildings to static and dynamic actions should be determined by considering both flexural plastic hinges and brittle shear hinges. However, shear capacities of members are generally neglected due to time saving issues and convergence problems and only flexural response of buildings are considered in performance assessment studies. On the other hand, recent earthquakes showed that the performance of older buildings is mostly controlled by shear capacities of members rather than flexure. Demand estimation is as important as capacity estimation for the reliable performance prediction in existing RC buildings. Demand estimation methods based on strength reduction factor (R), ductility (μ), and period (T) parameters (R-μ-T) and damping dependent demand formulations are widely discussed and studied by various researchers. Adopted form of R-μ-T based demand estimation method presented in Eurocode 8 and Turkish Earthquake Code-2007 and damping based Capacity Spectrum Method presented in ATC-40 document are the typical examples of these two different approaches. In this study, eight different existing RC buildings, constructed before and after Turkish Earthquake Code-1998, are selected. Capacity curves of selected buildings are obtained with and without considering the brittle shear capacities of members. Seismic drift demands occurred in buildings are determined by using both R-μ-T and damping based estimation methods. Results have shown that not only capacity estimation methods but also demand estimation approaches affect the performance of buildings notably. It is concluded that including or excluding the shear capacity of members in nonlinear modeling of existing buildings significantly affects the strength and deformation capacities and hence the performance of buildings.
Keywords: pushover analysis; reinforced concrete buildings; seismic demand; capacity spectrum method
1. Introduction
Seismic performance of existing buildings became a critically important topic in Turkey after destructive earthquakes occurred in last decade. Population rise after the mid-19th century has
Corresponding author, Associate Professor, E-mail: [email protected]
a
Ph.D., E-mail: [email protected]
increased the demand to new buildings. In this period, numerous buildings are constructed with poor material, workmanship and construction quality (Arslan 2010, Inel, Ozmen et al. 2008, Ilki and Celep 2012). This situation constitutes the major problem of existing RC building stock of Turkey. In order to overcome these problems, seismic codes are revised periodically with stiff design rules. In Turkey, capacity design principle was first introduced to the seismic design code in 1998 (TEC-1998). For this reason, TEC-1998 is mostly used to separate new and existing buildings. In 2007 current seismic design code (TEC-2007) which is the first technical code that includes the seismic performance assessment of existing buildings was introduced. In the chapter 7 of this code, two distinct calculation methods to determine seismic performance of RC buildings are suggested. In the first, linear elastic method based on force-based calculations is used. In the second method, nonlinear capacity of structural members is determined and nonlinear response of buildings is represented by flexural hinges at critical sections. Seismic demands are calculated by displacement based approach. However, it is clearly known that performance of RC buildings in recent earthquakes has suffered from shear failure rather than flexure (Adalier and Aydingun 2001, Ates, Kahya et al. 2013, Bal, Crowley et al. 2008, Dogangun 2004, Sezen, Whittaker et al. 2003). This situation implies that considering the shear capacity of members is necessary to obtain reliable results. However, it is known that shear capacities of members are not generally considered by the engineers because of convergence problems of nonlinear analyses programs used in practice. In recent years, some studies (Senel, Palanci et al. 2013, Palanci, Kalkan et al. 2014) have shown that strength capacity and damage limits of especially older buildings can significantly be affected from the modeling technique used. In this study, nonlinear analysis models of eight existing RC buildings are constructed by using three different modeling techniques. In the first method brittle shear hinges and flexural plastic hinges were assigned to all beams and columns (M1). In the second method flexural hinges were assigned to all beams and columns, but brittle shear hinges were only assigned to columns (M2). In last method shear capacities of members were not considered and non-linear response of buildings represented by only flexural hinges (M3).
In order to investigate and compare the response of new and old buildings, TEC-1998 was selected as a threshold code and older buildings constructed before 1998 were defined as old buildings. In order to reflect the properties of existing mid-rise buildings, four new and old occupied buildings having different story numbers were selected and modeled by using structural analyses program SAP2000 (CSI 2010). Story numbers of old buildings are range between 4 and 9 while the new buildings are between 4 and 6. Structural geometry, member dimensions, material classes and loading conditions of buildings are determined from their architectural and structural design projects. Flexural strength and deformation capacity of members was determined by using moment curvature analyses at critical sections based on design projects. During the capacity calculation of members, damage limits of members were determined by using the strain based deformation limits given in TEC-2007. Shear capacity of beams and columns was calculated according to Turkish Standard 500 (TS500 2000). Inelastic force-deformation behavior of the buildings is determined by pushover analyses. It is worth to state that pushover analysis was applied in each direction (X and Y) to all distinct models and for each modeling technique used (M1, M2, M3). By this way, totally 48 pushover analyses were performed.
Demand estimation is as important as capacity estimation for the performance evaluation in existing RC buildings. Different ways or approximations can be found in the literature for the calculation of seismic demand in terms of displacement. R-μ-T based demand estimation approximations were studied and a lot of models were proposed by various researchers. A brief
summary of these studies and models were presented by Miranda and Bertero (1994). The model presented by Vidic, Fajfar and Fischinger (Vidic, Fajfar et al. 1994) is one of the important one among these models and also provided for practicing engineers in some codes such as Eurocode 8 (EC-8) and Turkish Earthquake Code-2007 (TEC-2007). Another type of seismic demand calculation approaches uses damping based formulations. Capacity Spectrum Method (CSM) proposed by Freeman (Freeman, Nicoletti et al. 1975) is one of the well-known damping based demand estimation methods and modified and revised by Applied Technology Council in 1996 (ATC-40). In this study both R-µ-T and damping based demand estimation methods (EC-8 method and CSM) were applied to all analysis models. By this way, effect of different demand estimation methods on the new and old buildings were calculated and compared.
2. Non-linear modeling of case study buildings
In this section, general features of case study buildings and details of modeling techniques are summarized.
2.1 General aspects of case study buildings
The case study buildings are classified as new and old buildings according to TEC-1998 respectively and capacity design principles were not considered in old buildings. This is an important deficiency for old buildings which constitutes the important part of existing RC building stock of Turkey. Lower concrete and steel strength allowed by the former codes and poor workmanship quality increase the severity of problems in old buildings. In the latter code (TEC-2007), however, confinement requirements at the critical sections, seismic design forces, allowable drift limits and material classes were revised and heightened. Capacity design requirement also became mandatory.
Structural geometry of all buildings such as member properties (cross-sectional dimensions, reinforcement details), material classes (reinforcement and concrete) and loading conditions (filled walls, dead and live loads at slabs) of buildings are determined from their architectural and structural design projects. Investigated buildings are constructed in the first earthquake zone and used for residential purposes.
In all old building projects, concrete class is C16 (fck=16 MPa) and longitudinal and transverse
reinforcement class is S220 (fyk=220 MPa). In the study, four old buildings having 4, 5, 6 and 9
stories are selected. Project investigations have shown that 8mm diameter was used for transverse reinforcement. Spaces between transverse bars were 200mm and also hook and crossties were not used in the members of old buildings. It was also observed that cross-sectional dimensions of some columns were reduced in the upper floors. New buildings selected in this study consist of 4, 5, and two 6 story buildings. Projects investigation studies have shown that concrete classes in new buildings varies between C25~C30 (fck=25~30 MPa) and S420 steel grade was used for
longitudinal and transverse reinforcement. Design projects have shown that 8 and 10 mm rebar were used as transverse reinforcements. Space of bars at critical sections of beams and columns are 100 mm. Hooks and crossties were also used in structural members of new buildings.
2.2 Modeling of RC buildings
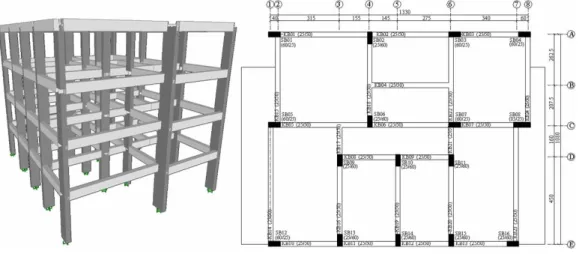
After extensive studies, properties of columns and beams were determined from design projects, and structural geometry and load conditions of buildings such as story heights, dead and live loads were obtained from architectural projects. In Fig. 1, plan and 3D view of 4 story previous code (old) building is shown.
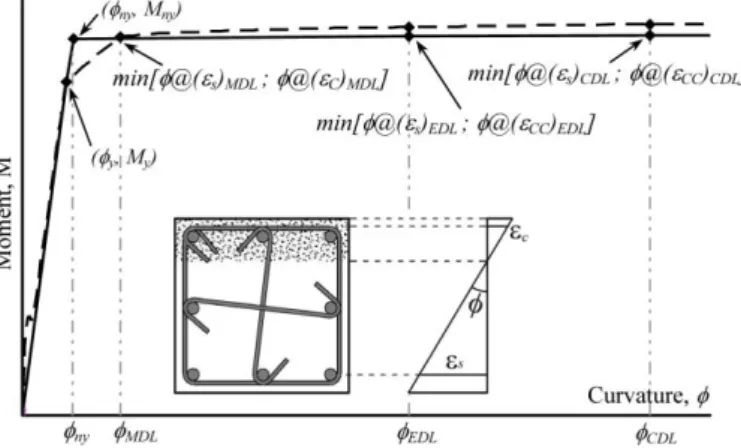
After the definition of geometric features of buildings, flexural strength and deformation capacities of sections at critical sections were obtained by moment-curvature analyses. Stress-strain relationship of confined concrete was represented by Modified Kent-Park model (Park, Priestley et al. 1982). Damage limits separating the slight, moderate, extensive and collapse regions of sections were determined by using strain based damage definitions presented in TEC-2007. These limits are calculated depending on the compression strains of concrete and tensile strains of steel. Compression strains corresponding to sectional damage limits are formulated by considering the confinement amount of members. In Fig. 2, typical representation of damage limits and damage states for RC sections are presented. Expressions corresponding to strain limits of concrete and steel are also given on this figure. As seen in the Fig. 2, four different “Slight Damage (SD)”, “Moderate Damage (MD)”, “Extensive Damage (ED)” and “Collapse” member damage regions are expressed in TEC-2007. Concrete strain limits are expressed depending on the ratio of existing (ρs) to required (ρsm) volumetric transverse reinforcement ratio of members. While
performing moment-curvature analyses, both elongation in steel and compression in concrete were
Fig. 1 3D and plan view of 4-story building (Dimensions are given in cm)
Fig. 3 Representation of typical moment-curvature response of sections and idealized bilinear curve
checked and sectional damage limit was determined according to whichever comes first.
Described methodology is applied for all structural members and flexural strength and deformation capacities of members were determined. Then, obtained moment-curvature curves were idealized as bilinear curves and effective stiffness of members (columns, beams) were determined by using the definitions given in TEC-2007. In Fig. 3, typical and idealized bilinear moment-curvature curves are shown. My and ϕy describes the first yield of the section and
determined by concrete strain of 0.002 and yield strain of steel. Mny represents flexural strength of
member and determined from concrete strain of 0.004. By obtaining My, ϕy and Mny, nominal
curvature was obtained. Details of the followed procedure can be found in the study of Priestley, Calvi et al. (2007). Idealized plastic curvature values were then converted to rotations using moment-area theorem. During the calculation of rotations, plastic hinge length was taken as half of cross-section height in considered direction.
Determination of flexural capacity of members is an important step of non-linear modeling RC buildings, but shear strength capacities of beams and columns are also calculated and considered in this study. Formulation, presented in TS-500 (2000) and shown in Eq. (1), was used to calculate shear capacity (Vr) of members. First and second parts of this equation represent the contribution
of concrete and transverse reinforcement, respectively. In the Eq. (1) bw and d defines section
dimensions, fct is tension strength of concrete, Asw and s is transverse reinforcement area and space
parallel to earthquake direction, fyw is the yield strength of transverse reinforcement, Nd/Ac is axial
load ratio of member and γ is the coefficient that depends on the compression (γ= 0.07) or tension (γ=-0.3). It is worth to remind that of effect of slabs are not taken into consideration during the calculation of shear capacities of beams.
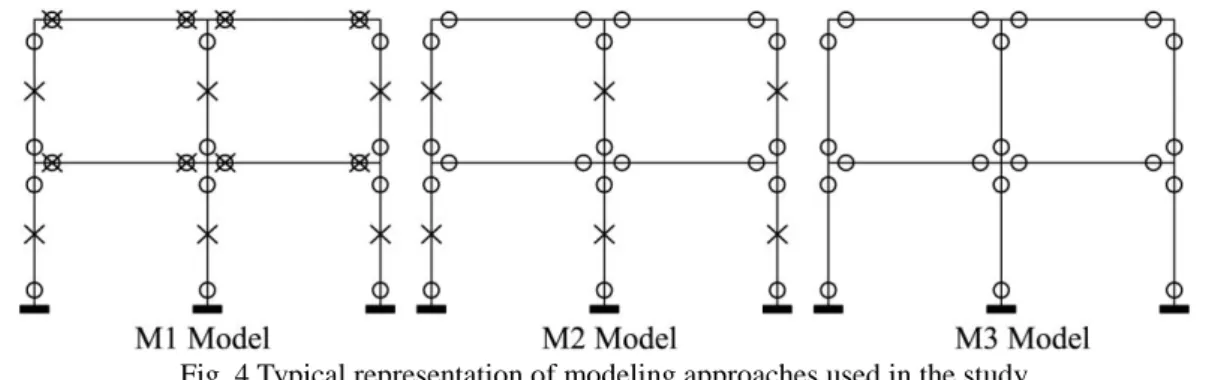
sw d r ct w yw c A N V 0.52f b d 1 f d A s (1) Flexural and shear failures of members and their effects to overall building damage were investigated by using three different modeling approaches which have been studied by Senel, Palanci et al. (2013). According to this approach, flexural capacity of members is used in all building models and shear effects are evaluated by assigning force controlled shear hinges on beams and/or columns. In the first modeling approach, both flexural and shear capacities are considered for all structural elements and these models are denoted by (M1). In the second
Fig. 4 Typical representation of modeling approaches used in the study Table 1 General characteristic of RC buildings
Dir
ec
tio
n New Buildings Old Buildings
Build. No Num. of Story Seismic Weight (kN) Build. Height (m) Lateral Strength Ratio (Vt/W) Period (s) Build. No Num. of Story Seismic Weight (kN) Build. Height (m) Lateral Strength Ratio (Vt/W) Period (s) X BN1 4 8659.72 11.40 0.209 0.618 BO1 4 6410.93 11.20 0.161 0.616 Y 0.283 0.506 0.170 0.592 X BN2 5 7625.62 14.50 0.212 0.750 BO2 5 17234.04 14.90 0.131 0.748 Y 0.274 0.685 0.173 0.600 X BN3 6 25329.10 18.55 0.147 1.060 BO3 6 17117.87 16.80 0.146 0.773 Y 0.218 0.808 0.145 0.785 X BN4 6 17786.75 16.80 0.214 0.851 BO4 9 24845.90 26.10 0.085 1.140 Y 0.282 0.693 0.111 0.886
approach (M2) in addition to flexural capacities of beams and columns, only the shear capacities of columns were considered. In the last modeling approach (M3) only flexural capacities of members are considered. All the modelling methods used in this study is illustrated in Fig. 4 on a typical RC frames. In the Fig. 4, “x” is used to express brittle shear hinges and “o” is used to represents flexural hinges.
Three modeling methods (M1, M2, M3) were applied to all buildings in X and Y directions. By this way, 48 different cases were obtained and non-linear static pushover analyses were performed for each of these buildings. General properties of buildings are presented in Table 1. Lateral strength ratios (Vt/W) of buildings obtained from M1 models are also given in the table to compare
strength capacity of buildings.
3. Strength and deformation capacities of RC buildings
Upon a completing modelling procedures, capacity curve of all models are determined by performing static pushover analysis. In the analysis, lateral loads were applied to mass center of each story level considering seismic weight and first mode shape. Seismic weight of each building was calculated by combination of dead (structural element dimensions and infill walls) and live loads. In this study, performance limits of buildings are determined by considering TEC-2007. In
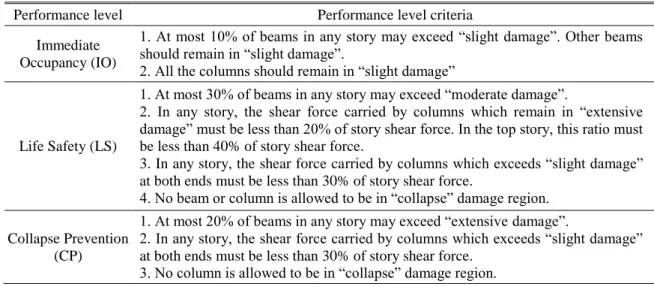
Table 2 Performance levels criteria defined in TEC-2007
Performance level Performance level criteria
Immediate Occupancy (IO)
1. At most 10% of beams in any story may exceed “slight damage”. Other beams should remain in “slight damage”.
2. All the columns should remain in “slight damage”
Life Safety (LS)
1. At most 30% of beams in any story may exceed “moderate damage”.
2. In any story, the shear force carried by columns which remain in “extensive damage” must be less than 20% of story shear force. In the top story, this ratio must be less than 40% of story shear force.
3. In any story, the shear force carried by columns which exceeds “slight damage” at both ends must be less than 30% of story shear force.
4. No beam or column is allowed to be in “collapse” damage region. Collapse Prevention
(CP)
1. At most 20% of beams in any story may exceed “extensive damage”.
2. In any story, the shear force carried by columns which exceeds “slight damage” at both ends must be less than 30% of story shear force.
3. No column is allowed to be in “collapse” damage region.
the code these limits are described by considering the accumulation of column and beam damages in the system. In TEC-2007, four distinct performance states “Immediate Occupancy (IO)”, “Life Safety (LS)” and “Collapse Prevention (CP)” and “Collapse (C)” are described (see Table 2 for requirements). Structure is assumed in collapse state if the requirements of CP are not satisfied.
As seen in the Table 2, each performance limit is defined according to amount of beam and column damages. While determining performance limits of buildings, static pushover results and criteria defined in the Table 2 are used. It should be reminded that brittle members designed without capacity design principles have suffered from shear effects. For this reason, they were assumed in “collapse” damage region during performance assessment study.
3.1 Evaluation of capacity and performance limits of case study buildings
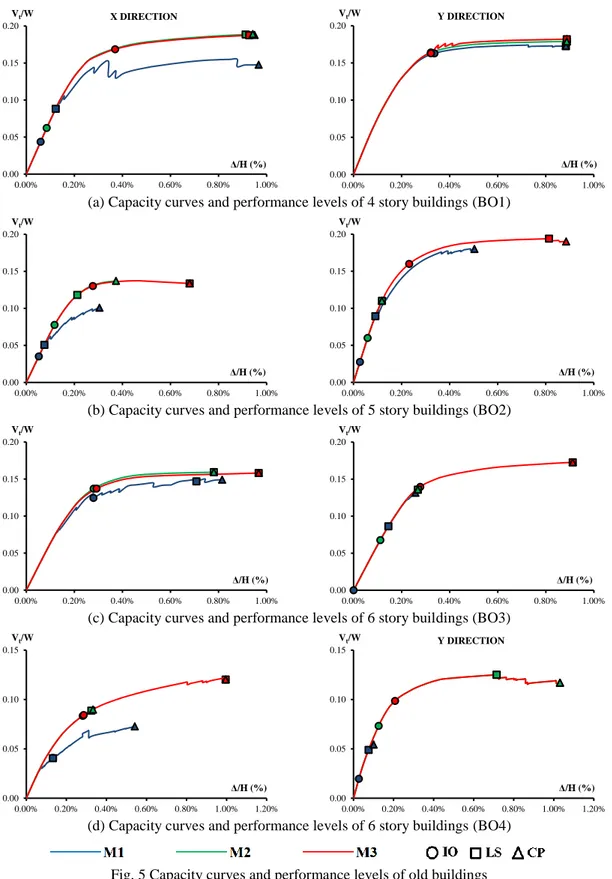
Performance limits and lateral strength ratios for each direction and modeling approach are shown on Fig. 5. CP limit is used to represent ultimate deformation capacity of buildings. Capacity curves of buildings are represented in terms of lateral strength (Vt/W) and drift ratios (Δ/H) in order
to eliminate the effects of units.
As seen in the Fig. 5, lateral strength and ductility capacity of (M3) models are significantly higher than other ones. In old buildings, first modeling approach (M1) gives the lowest strength and ductility capacities. Drift ratios corresponding to IO and LS performance limits also supports the same findings.
In some cases, especially in high-rise buildings, nonlinear behavior is not clearly observed for (M1) models since the brittle shear failure occurred at the initial stages of analyses. Results also show that drift capacity of old buildings, modeled by only flexural hinges (M3), are around 1%. However, considering the shear capacities of members decreases the deformation capacity of buildings significantly. Lower drift capacities (smaller than 0.5%) clearly indicates the effect of shear strength and the importance of capacity design approach. Overall results obtained for old buildings clearly show that lateral strength and displacement capacities are adversely affected from brittle shear effects.
0.00 0.05 0.10 0.15 0.20 0.00% 0.20% 0.40% 0.60% 0.80% 1.00% X DIRECTION Vt/W Δ/H (%) 0.00 0.05 0.10 0.15 0.20 0.00% 0.20% 0.40% 0.60% 0.80% 1.00% Y DIRECTION Vt/W Δ/H (%)
(a) Capacity curves and performance levels of 4 story buildings (BO1)
0.00 0.05 0.10 0.15 0.20 0.00% 0.20% 0.40% 0.60% 0.80% 1.00% Vt/W Δ/H (%) 0.00 0.05 0.10 0.15 0.20 0.00% 0.20% 0.40% 0.60% 0.80% 1.00% Vt/W Δ/H (%)
(b) Capacity curves and performance levels of 5 story buildings (BO2)
0.00 0.05 0.10 0.15 0.20 0.00% 0.20% 0.40% 0.60% 0.80% 1.00% Vt/W Δ/H (%) 0.00 0.05 0.10 0.15 0.20 0.00% 0.20% 0.40% 0.60% 0.80% 1.00% Vt/W Δ/H (%)
(c) Capacity curves and performance levels of 6 story buildings (BO3)
0.00 0.05 0.10 0.15 0.00% 0.20% 0.40% 0.60% 0.80% 1.00% 1.20% Vt/W Δ/H (%) 0.00 0.05 0.10 0.15 0.00% 0.20% 0.40% 0.60% 0.80% 1.00% 1.20% Y DIRECTION Vt/W Δ/H (%)
(d) Capacity curves and performance levels of 6 story buildings (BO4)
0.00 0.05 0.10 0.15 0.20 0.25 0.30 0.35 0.00% 0.50% 1.00% 1.50% 2.00% X DIRECTION Vt/W Δ/H (%) 0.00 0.05 0.10 0.15 0.20 0.25 0.30 0.35 0.00% 0.50% 1.00% 1.50% 2.00% Y DIRECTION Vt/W Δ/H (%)
(a) Capacity curves and performance levels of 4 story buildings (BN1)
0.00 0.05 0.10 0.15 0.20 0.25 0.30 0.35 0.40 0.00% 0.50% 1.00% 1.50% 2.00% 2.50% 3.00% Vt/W Δ/H (%) 0.00 0.05 0.10 0.15 0.20 0.25 0.30 0.35 0.40 0.00% 0.50% 1.00% 1.50% 2.00% 2.50% 3.00% Vt/W Δ/H (%)
(b) Capacity curves and performance levels of 4 story buildings (BN2)
0.00 0.05 0.10 0.15 0.20 0.25 0.30 0.00% 0.50% 1.00% 1.50% 2.00% 2.50% Vt/W Δ/H (%) 0.00 0.05 0.10 0.15 0.20 0.25 0.30 0.00% 0.50% 1.00% 1.50% 2.00% 2.50% Vt/W Δ/H (%)
(c) Capacity curves and performance levels of 4 story buildings (BN3)
0.00 0.05 0.10 0.15 0.20 0.25 0.30 0.35 0.40 0.00% 0.50% 1.00% 1.50% 2.00% 2.50% Vt/W Δ/H (%) 0.00 0.05 0.10 0.15 0.20 0.25 0.30 0.35 0.40 0.00% 0.50% 1.00% 1.50% 2.00% 2.50% Vt/W Δ/H (%)
(d) Capacity curves and performance levels of 4 story buildings (BN4)
0.00 0.05 0.10 0.15 0.20 0.0 5.0 10.0 15.0 Dy Du K1 K2 Vt/W D/H (%)
Fig. 7 Idealization of capacity curves
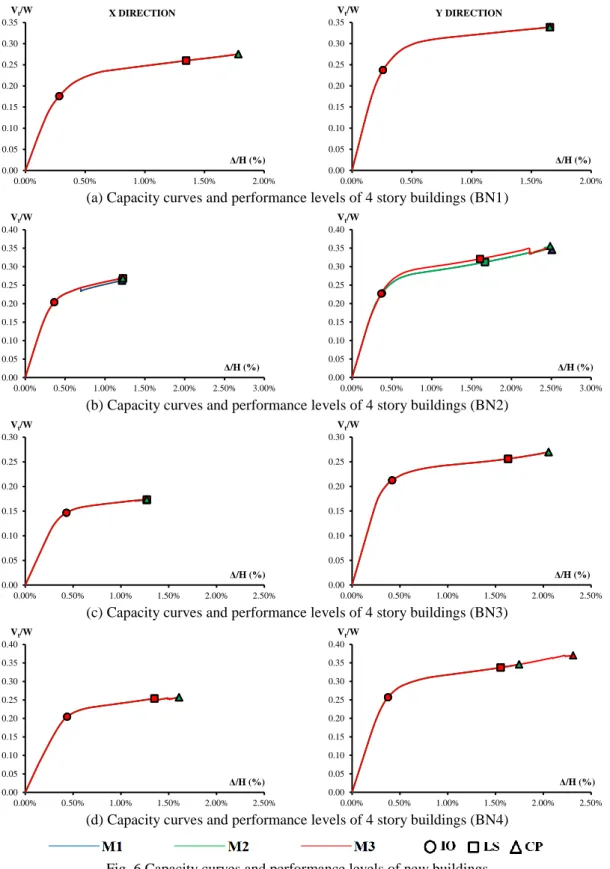
In Fig. 6, performance limits, lateral strength and drift ratios of new buildings are shown for each direction and each modeling approach. It can be seen from this figure that structural behavior of new buildings is almost identical even in different modeling approaches. For this reason, it can be said that structural damages are controlled by flexural deformations rather than shear. Obtained results also show that drift capacities of new buildings are higher than 2% and this is the another positive effect of higher shear strength capacities of structural members.
In the study, effects of modeling approach on the strength and deformation capacities of new and old buildings are also discussed and compared. Therefore, capacity curves are represented by bilinear curves as expressed in ATC-40 (1996). In Fig. 7, representations of real and bilinear curves are illustrated. In this figure, K1 and K2 correspond to the yield and post yield stiffness. Yield displacements (Δy) of buildings are obtained by equating the areas inside and outside of the
bilinear and real curves shown in Fig. 7. Δu represents the maximum displacement capacity
corresponding to CP performance limit of building.
In order to make reliable comparison of capacity curves, buildings are classified according to their ages (new and old) and modeling approaches used. Bilinear capacity curves are obtained by considering the average values corresponding to lateral strength capacities and deformation limits
0.00 0.05 0.10 0.15 0.20 0.25 0.30 0.35 0.0% 0.5% 1.0% 1.5% 2.0% D/H (%) Vt/W
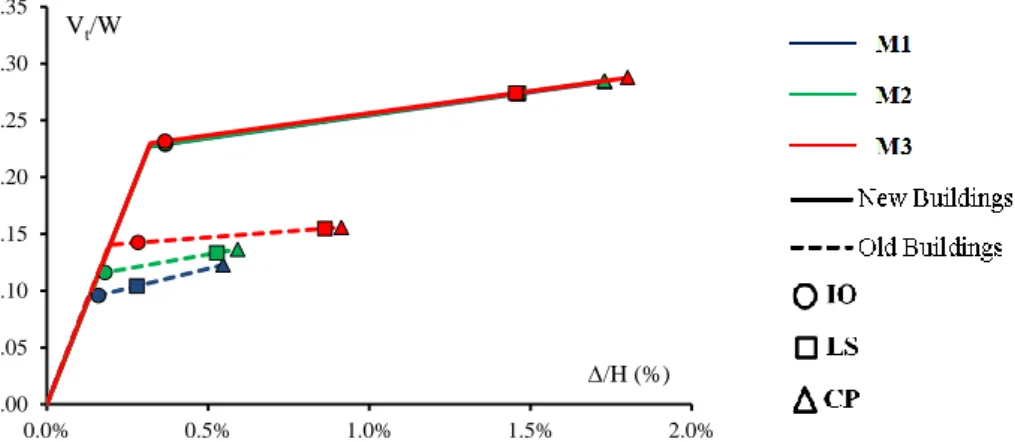
Fig. 8 Comparison of average capacity curves of old and new code buildings modeled by different techniques
of buildings in each class. Fig. 8 clearly indicates that strength and deformation capacity of new buildings are significantly higher than older ones. Higher shear strength capacity of members and capacity design rules enforced by the new code prevent the brittle shear failure and hence flexural deformations control the damage in buildings.
Fig. 8 also shows that relatively lower direct shear capacities of beams and columns decrease the strength and deformation capacities of old buildings. Figure clearly implies that the highest and the lowest strength and deformation capacities of old buildings are obtained from M3 and M1 models respectively. Fig. 8 also indicates that drift limits corresponding to LS limits are affected from the modeling approach considered. It should be noted that this situation may affect the performance decision in old buildings.
4. Determination of seismic demand in RC buildings
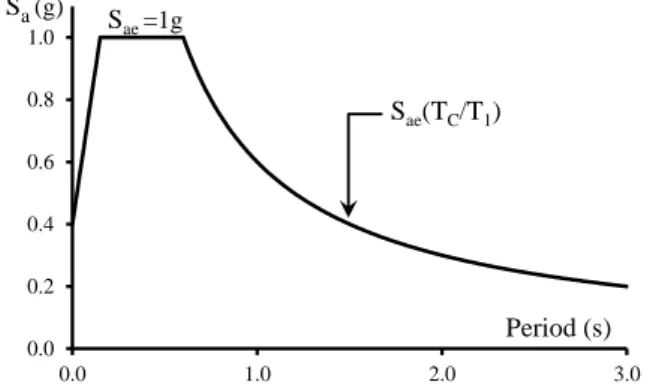
In order to make reliable performance assessment, seismic demands of all buildings were determined under similar earthquake scenario. Seismic demand spectrum used in this study is shown in Fig. 9. In this scenario, maximum elastic spectral acceleration value (Sae) is taken as 1g
and corner period (TC) was taken as 0.6s. Spectral acceleration values in constant velocity region
were calculated as shown on the Fig. 9 (Sae (TC/T)).
Inelastic displacement demands of buildings were calculated by using different methods based on different approaches. R-μ-T based demand estimation approach was studied by various researchers (Chopra and Goel 2000, Fajfar 2000, Garcia and Miranda 2003, Krawinkler and Nassar 1992, Miranda 2001, Miranda and Akkar 2005, Miranda and Bertero 1994, Newmark and Hall 1982, Vidic, Fajfar et al. 1994, Zamfirescu and Fajfar 2001). Investigations of these studies are recently simplified and incorporated into building design guidelines such as Eurocode 8 (EN 1998-1, 2004). This method is also enforced by TEC-2007 for the performance assessment studies. Damping based demand estimation studies are also investigated and a lot of models are proposed by various researchers (Priestley 2003, Freeman, Nicoletti et al. 1975, Freeman, Nicoletti et al. 1984, Shibata and Sozen 1976). Capacity Spectrum Method (CSM) is one of the well-known methods among them. In ATC-40 (1996) CSM modified and adopted for practicing engineers. In this study EC-8 and ATC-40 methods, which represents the R-µ-T and damping based demand estimation approaches, are selected and used. By this way it is aimed to compare the effects of
0.0 0.2 0.4 0.6 0.8 1.0 0.0 1.0 2.0 3.0 Period (s) Sa(g) Sae(TC/T1) Sae =1g
Table 3 Common modal parameters of case study buildings
Direction New Buildings Old Buildings
Building No. PF1 α Period (s) Building No. PF1 α Period (s)
X BN1 1.305 0.842 0.618 BO1 1.305 0.836 0.616 Y 1.304 0.827 0.506 1.300 0.836 0.592 X BN2 1.297 0.876 0.750 BO2 1.289 0.824 0.748 Y 1.354 0.811 0.685 1.288 0.815 0.600 X BN3 1.311 0.846 1.060 BO3 1.327 0.785 0.773 Y 1.350 0.803 0.808 1.334 0.773 0.785 X BN4 1.320 0.807 0.851 BO4 1.361 0.790 1.140 Y 1.346 0.782 0.693 1.374 0.777 0.886
different demand estimation and building modelling approaches on the performance of new and old RC buildings.
In both methods seismic demands are calculated via single degree of freedom systems (SDOF). For this reason, multi degree of freedom buildings (MDOF) were converted to SDOF systems. During the conversion study ATC-40 (1996) method was used. Modal properties of buildings are independent from the modeling approach are presented in Table 3. In this table vibration periods and common modal parameters of buildings such as first mode participation factor (PF1) and effective mass coefficient (1) are given.
4.1 R-μ-T based demand estimation by using Eurocode 8
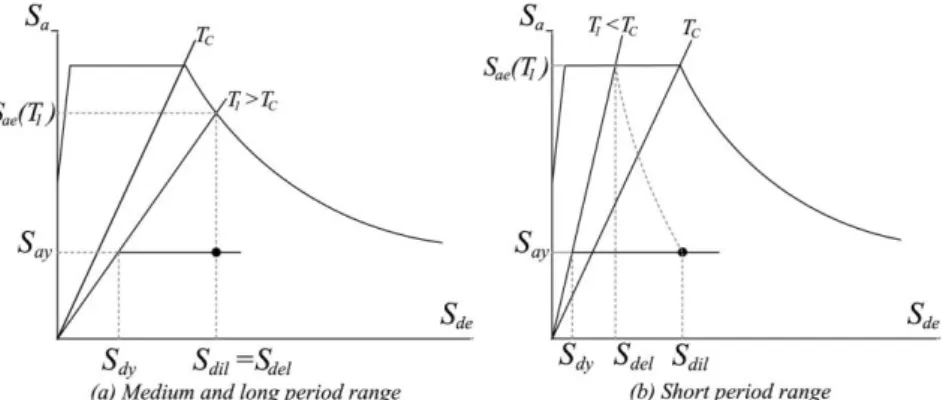
Estimation of maximum inelastic deformation demand considering the relationships between lateral strength ratio (R), ductility (μ) and period (T) is quite worked approach and also enforced by some codes such as EC-8 and TEC-2007. In this method, first the structure is transformed from the MDOF to equivalent SDOF system. In the second step, elastic displacement demand is obtained (Eq. (2)). Then, determination of seismic demand (target displacement) is related with structural period (see Fig. 10). Different expressions are used for short, medium and long-period ranges. In the constant acceleration region of spectrum which represents the short period buildings behavior is nonlinear and inelastic displacement demand is higher than elastic demand (Eq. (3)).
For constant velocity and displacement regions elastic and inelastic displacements are taken as equal (see Fig. 6(a)). In the Eq. (3), qu represents the ratio between elastic acceleration (Sae(T1)) and yield acceleration of structure (Say).
2 . 1 . 1 ae del 2 T ) T ( S S (2) del c u u del dil S T T q q S S . 1 ) 1 ( 1 (3)
4.2 Damping based demand estimation by using ATC-40
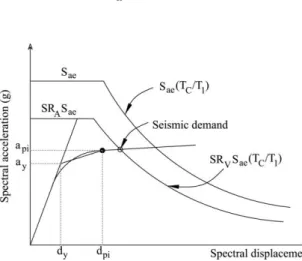
In the 1970s, Capacity Spectrum Method (CSM) was first introduced by Freeman (Freeman, Nicoletti at al. 1975) and it is developed and modified by the years. In this study, CSM recommended by ATC-40 (1996) in 1990s is used. Seismic demands are calculated by considering nonlinear response of buildings which is represented by capacity curves. As in EC-8, demand spectrum and capacity curve should be converted to Acceleration-Displacement Response Spectrum (ADRS) format and bilinear representation of capacity curve (capacity spectrum) is needed. In this technique, first trial points api, dpi is designated and demand spectrum is reduced by
considering the resultant damping. Step-by-step procedure is followed until the capacity and response spectrums in ADRS format intersects. The point which corresponds to intersection of reduced response spectrum and the capacity spectrum at the estimated api, dpi is called as
performance point.
In the method, viscous damping is introduced by effective viscous damping which is derived from damping modification factor (κ) and equivalent viscous damping (β0) defined in Eq. (4). In the equation, damping modification factor depends on structural behavior of the building and three structural behavior types (“A”, “B” and “C”) are introduced. By this way, upper and lower limits of κ, spectral reduction factors (SRA, SRV) and βeff can be obtained. In ATC-40, maximum effective
viscous damping is set to 20% for structural behavior type “C”. Seismic demand determination of ATC-40 technique is represented in Fig. 11 typically.
5 0
eff (4)
0 5 10 15 20 25 30 35 0.5 0.6 0.7 0.8 0.9 1 1.1 1.2 Old Buildings Period (s) Sdil(cm) 0 5 10 15 20 25 30 35 0.5 0.6 0.7 0.8 0.9 1 1.1 New Buildings Period (s) Sdil(cm)
Fig. 12 Distribution of seismic demands in old and new code buildings according to EC-8 and CSM
0.5 1.0 1.5 2.0 2.5 0.5 0.6 0.7 0.8 0.9 1 1.1 1.2 Old Buildings Rat io (CSM/ E C -8) Period (s) 0.5 1.0 1.5 2.0 2.5 0.5 0.6 0.7 0.8 0.9 1 1.1 New Buildings M1 Model M2 Model M3 Model Rat io (CSM/ E C -8)
Fig. 13 Displacement demand ratios (CSM/EC8) of old and new code buildings
5. Performance evaluations of RC buildings
Seismic demand of all buildings in two directions for each modeling options were calculated by using EC-8 and CSM methods. During the assessment study, effects of demand estimation methods on new and old buildings were compared and discussed. Calculated demands show that the EC-8 and CSM methods can give different seismic demand estimations. In Fig. 12, variation of spectral displacements (Sd) for each modeling options depending on the vibration period of
buildings are presented. Fig. 12 and Fig. 13 shows that CSM estimates higher demands with respect to EC-8 method in the majority of old buildings. In the new buildings, on the other hand, seismic demands calculated from CSM are higher than EC-8 method (Fig. 13). Distribution of results also shows that scatters of seismic demands are significantly higher in old buildings with respect to new ones. Ductility capacities of old buildings modeled by different techniques are significantly different and this situation increases the variations of seismic demands calculated by CSM. Therefore, it can be said that the modeling approach effects not only capacity calculations but also demand estimations in CSM especially.
Distribution of seismic demands indicates that period of old buildings are in constant velocity region, so elastic and inelastic demands are equal according to equal displacement approach (EC-8). This situation implies that demand calculations according to EC-8, which are mainly controlled
(a) (b) Fig. 14 Seismic performance of RC buildings according to EC-8
(a) (b)
Fig. 15 Seismic performance of RC buildings according to CSM
by the vibration period of building, are not sensitive the modeling approach used. However, displacement demands calculated by CSM are much more sensitive to modeling method. M1 models have higher demands since the lateral strength and ductility capacities are significantly lower than M2 and M3 models.
Effects of different modeling approaches and demand estimation methods on the seismic performance of new and old buildings are also investigated in this study. Aforementioned performance limits (IO, LS and CP) and seismic demands were compared and seismic performances of new and old buildings were shown in Figs. 14 and 15. It can be seen from the figures that new buildings have better performance in both calculation techniques. According to EC-8 results, all new buildings are in “Life Safety (LS)” performance level and this situation implies that all models satisfy the performance target of code requirement. Performance assessment of old buildings according to EC-8 (Fig. 14(b)) shows that similar displacement demands do not correspond to similar performance levels since the performance limits of old buildings are significantly dependent to shear capacities of members. However, new buildings which have considerably higher shear strength capacities suffer from flexural damages and hence the shear effects do not change the performance of new buildings.
Fig. 15(a) indicates that unlike EC-8 method, LS performance target may not be satisfied for all buildings according to CSM. This situation shows that CSM gives critical performance predictions
with respect to EC-8 method for new buildings. Both Figs. 14(b) and 15(b) shows that EC-8 and CSM methods give identical performance predictions in old buildings. Therefore, it can be said that shear effects should be considered in the performance assessment of especially old buildings which constitutes the majority of existing building stock.
5. Conclusions
In this study, eight different multistory reinforced concrete buildings which represent the new and old building stock of Turkey were investigated. Three dimensional structural models were created and general properties of members were determined according to design projects of buildings.
Three different modeling approaches were used to investigate the effect of flexural and/or shear capacities of hinges on the nonlinear response of buildings. In the first modeling approach flexural and shear capacities were considered together (M1) and hinges are assigned to beams and columns accordingly. In the second case in addition to flexural hinges in beams and columns, shear capacities only in columns were considered (M2). In the third model shear capacities of columns and beams were not considered and non-linear response of buildings were represented by using only flexural hinges at beams and columns (M3). Capacity curves, seismic demands and the performance of each structural model were determined separately and following conclusions are summarized briefly:
• Modeling technique has no significant effect on the capacity curves of new code buildings since the direct shear strength of structural members (columns and beams), connections and frame system is higher than the strength capacity corresponding to flexure. Better confinement quality and higher concrete and steel strength are the main reasons behind this situation. Therefore, deformations in the new buildings generally occur by means of flexural hinges. • Modeling technique has significant effect on the capacity curves of old buildings. Poor confinement quality of beams and/or columns and lower material strengths decrease the direct shear capacity of members. Ignoring the shear capacities of columns and/or beams suppresses the shear critical members and hence higher performance predictions can be possible.
• In the majority of old buildings drift ratios corresponding to LS and CP limits coincide. This situation directly related with the strain based damage assessment approach of TEC-2007. However, in the new-code buildings LS and CP performance limits occur at different drift ratios depending on the higher hinge capacities.
• Capacity curve of old buildings show that ultimate drift capacities of buildings do not exceed the 1%. Furthermore, this capacity may significantly decrease depending on the modeling technique, which includes shear capacities of beams and columns. In the new buildings significantly higher drift capacities are obtained.
• Modeling technique significantly affects not only drift but also strength capacities of old buildings. Considering and including the strength capacity of beams and/or columns damaged by shear may considerably increase the overall base shear capacity of system. However, this situation is not valid in the new code buildings depending on the higher direct shear capacities of columns and beams. All of these observations indicate that older buildings modeled by considering only flexural hinges do not provide reliable estimations for strength and deformation capacities. Therefore, not only flexural but also shear capacities of beams and columns must be considered.
• Effect of modeling approach on seismic demand was evaluated by using Capacity Spectrum Method (CSM) and the procedure provided in Eurocode 8 (EC8). Comparison of results indicates that especially in new buildings CSM estimates higher drift demands than EC-8 procedure. However, in old buildings depending on the low strength and ductility capacities, CSM may underestimate seismic demands.
• Seismic performance assessment of buildings according to CSM and EC-8 methods has shown that new buildings have better performance than old buildings. Considering the shear capacities of members not only decrease the strength and ductility capacities but also increase the seismic demands especially in CSM. In CSM this situation is directly related with the damping calculations which based on strength and ductility capacity of building.
• Overall results clearly imply that considering both flexural and shear capacities of members is necessary and may significantly affect performance predictions in older buildings. For this reason, shear effects should also be included in the seismic performance assessment studies in existing buildings.
References
Adalier, K. and Aydingun, O. (2001), “Structural engineering aspects of the June 27, 1998 Adana-Ceyhan (Turkey) earthquake”, Eng. Struct., 23(4), 343-355.
Arslan, M.H. (2010), “An evaluation of effective design parameters on earthquake performance of RC buildings using neural networks”, Eng. Struct., 32(7), 1888-1898.
ATC-40 (1996), Seismic evaluation and retrofit of concrete buildings, Applied Technology Council, Redwood City, CA.
Ates, S., Kahya, V., Yurdakul, M. and Adanur, S. (2013), “Damages on reinforced concrete buildings due to consecutive earthquakes in Van”, Soil Dyn. Earthq. Eng., 53, 109-118.
Bal, I.E., Crowley, H., Pinho, R. and Gulay F.G. (2008), “Detailed assessment of structural characteristics of Turkish RC building stock for loss assessment models”, Soil Dyn. Earthq. Eng., 28(10-11), 914-932. Chopra, A.K. and Goel, R.K. (2000), “Evaluation of NSP to estimate seismic deformation: SDF systems”, J.
Struct. Eng., 126(4), 482-490.
Dogangun, A. (2004), “Performance of reinforced concrete buildings during the May 1, 2003 Bingöl Earthquake in Turkey”, Eng. Struct., 26(6), 841-856.
EN1998-1 (2004), Eurocode 8: Design of structures for earthquake resistance, Part 1: General rules, seismic actions and rules for buildings, European Committee for Standardization (CEN), Brussels.
Fajfar, P. (2000), “A nonlinear analysis method for performance-based seismic design”, Earthq. Spectra, 16(3), 573-592.
Freeman, S.A., Nicoletti, J.P. and Matsumura, G. (1984), “Seismic design guidelines for essential buildings”, Proceedings of 8th World Conference on Earthquake Engineering, San Francisco, California, USA.
Freeman, S.A., Nicoletti, J.P. and Tyrell, J.V. (1975), “Evaluations of existing buildings for seismic risk - A case study of Puget Sound Naval Shipyard, Bremerton, Washington”, Proceedings of U.S. National Conference on Earthquake Engineering, Ann Arbor, Michigan, June.
Ilki, A. and Celep, Z. (2012), “Earthquakes, existing buildings and seismic design codes in Turkey”, Arabian J. Sci. Eng., 37(2), 365-380.
Inel, M., Ozmen, H.B. and Bilgin, H. (2008), “Re-evaluation of building damage during recent earthquakes in Turkey”, Eng. Struct., 30(2), 412-427.
Integrated Software for Structural Analysis and Design (2010), SAP2000, “Integrated finite element and design of structures analysis reference manual”, Berkeley: Computers and Structures Inc., California, USA
Krawinkler, H. and Nassar, A.A. (1992), “Seismic based design on ductility and cumulative damage demands and capacities”, Nonlinear Seismic Analysis and Design of Reinforced Concrete Buildings, Eds. H. Krawinkler, H. and Fajfar, P., Elsevier Applied Science, New York, USA.
Miranda, E. (2001), “Estimation of inelastic deformation demands of SDOF systems”, J. Struct. Eng., 127(9), 1005-1012.
Miranda, E. and Akkar, S. (2005), “Statistical evaluation of approximate methods for estimating maximum deformation demands on existing structures”, J. Struct. Eng., 131(1), 160-172.
Miranda, E. and Bertero, V.V. (1994), “Evaluation of strength reduction factors”, Earthq. Spectra, 10(2), 357-379.
Newmark, N.M. and Hall, W.J. (1982), Earthquake spectra and design, Earthquake Engineering Research Institute, Berkeley, California.
Palanci, M., Kalkan, A., Senel, S.M. and Yilmaz, Y. (2014), “Investigation of effect of different modeling techniques on existing buildings performance”, Proceedings of 11th International Congress on Advances in Civil Engineering, Istanbul, Turkey, October.
Park, R., Priestley, M.J.N. and Gill, W.D. (1982), “Ductility of square-confined concrete columns”, J. Struct. Div., 108(ST4), 929-950.
Priestley, M.J.N. (2003), Myths and Fallacies in Earthquake Engineering, (Revisited), The Mallet Milne Lecture, IUSS Press, Pavia, Italy.
Priestley, M.J.N., Calvi, G.M. and Kowalsky, M.J. (2007), Displacement Based Seismic Design of Structures, IUSS Press, Pavia, Italy.
Ruiz-García, J. and Miranda, E. (2003), “Inelastic displacement ratios for evaluation of existing structures”, Earthq. Eng. Struct. Dyn., 32, 1237-1258.
Senel, S.M., Palanci, M., Kalkan, A. and Yilmaz, Y. (2013), “Investigation of effects of modeling techniques on existing buildings seismic performance”, Proceedings of 2nd Turkish Conference on Earthquake Engineering and Seismology, Hatay, Turkey, September. (in Turkish)
Sezen, H., Whittaker, A.S., Elwood, K.J. and Mosalam, K.M. (2003), “Performance of reinforced concrete buildings during the August 17, Kocaeli, Turkey earthquake, and seismic design construction practice in Turkey”, Eng. Struct., 25(1), 103-114.
Shibata, A. and Sozen, M. (1976), “Substitute structure method for seismic design in reinforced concrete”, J. Struct. Eng., 102(1), 1-18.
Turkish Earthquake Code (1998), TEC-1998, Specifications for buildings to be built in seismic areas, Ministry of Public Works and Settlement, Ankara, Turkey.
Turkish Earthquake Code (2007), TEC-2007, Specifications for buildings to be built in seismic areas, Ministry of Public Works and Settlement, Ankara, Turkey.
Turkish Standard 500, TS500, Requirements for design and construction of reinforced concrete structures, Turkish Standards Institute, Ankara, Turkey.
Vidic, T., Fajfar, P. and Fischinger, M. (1994), “Consistent inelastic design spectra: strength and displacement”, Earthq. Eng. Struct. Dyn., 23(5), 507-521.
Zamfirescu, D. and Fajfar, P. (2001), “Comparison of simplified procedures for nonlinear seismic analysis of structures”, Proceedings of the 3rd U.S. Japan Workshop on Performance-Based Earthquake Engineering Methodology for Reinforced Concrete Buildings, Seattle, Washington, August.
CC
View publication stats View publication stats