Journal of Radioanalytical and Nuclear Chemistry, Articles, V ol. 181, No. 2 (1994) 447-459 R A D I O C H R O N O L O G Y OF SEDIMENTS
F R O M T H E M E D I T E R R A N E A N SEA USING N A T U R A L 21~ A N D F A L L O U T 137Cs
S. TADJIKI, H. N. ERTEN
Bilkent University, Chemistry Department, 06533 Ankara (Turkey)
(Received January 24, 1994)
The 210pb and 137Cs profiles of sediment cores from two locations in southem Spain, three locations in southern Turkey and two locations in n0rthem Cyprus were determined by direct ~/-ray spectroscopy. Sedimentation rates were derived for all locations using the 210pb data. The rates range from 1.39 + 0.12 cm. y-1 (0.50 + 0.04 g . cm -2- y - l ) t o 0.08 + 0.01 c m - y - 1 (0.039 + 0.003 g. cm -2. y-l), Except for one core, the 137Cs profiles were also used to compute sedimentation rates. The results are in good agreement with those of 210pb values. The results of the Constant Initial Concenration and Constant Rate of Supply dating models are in good agreement with each other. The flux of unsupported 210pb varies between 0.11 + 0.03 to 0.74 + 0.Ol pCi- cm -2. The average depositional flux was found to be considerably lower for cores from the Eastem Mediterranean.
Accurate dating techniques are important in the use of sediment records for reconstruction of recent environmental changes, The precision to which this can be accomplished has been greatly enhanced ever the past 20 years by the development of a range of radiometric techniques that use radioisotopes both from natural and artificial sources. The principal isotope for dating in the time scale of the past 100-150 years is 21~ 21~ with a half-life of 22.6 years is a member of the natural 23su series. Using this itosope, lake and sea sediment can be dated with a precision of five to ten years. In this method the activity of the unsupported 21~ (i.e.. total activity of 21~ in the sediment minus that supported by 226Ra) is measured throughout the sediments. Artificial radioisotopes such as 137Cs have been present in the environment only for the past 35 years, and can be used for dating only the most recent sediments. 137Cs is produced during nuclear fission. Thus, its presence in the environment is due to nuclear testing or to releases from nuclear reactors. In these tests, 137Cs w a s injected into the stratosphere where it circulates globally. 137Cs m o v e s from the stratosphere back to the troposphere and it is precipitated from the troposphere to the earth's surface. The use of this isotope does however provide a valuable check on the accuracy of the 21~ data. Most of the researchers measure the unsupported 21~ by measuring the a-emission of 21~ or by measuring the [3-emission of 21~ Although these melhods are highly sensitive, they are very complex and require radiochemical separation techniques. With the development of hyperpure germanium detectors, it is possible to measure 21~ in
s. TADJIKI, H, N. ERTEN: RADIOCHRONOLOGY OF SEDIMENTS
environmental samples directly with a high precision The advantage of 21~ assey by ?-counting lies in the non-destructive nature of the method and in the determination of a range of y-emitting radioisotopes, such as 226Ra and 137Cs, besides 2~~
Models of sediment accumulation
Assuming that the flux P (dpm 9 cm -2. y-l) of 2~~ t o the sediment-water interface has remained constant and no post-depositional migration of 21~ has occurred over the dating interval, the activity of 21~ in the sediment at any depth, z is given by the following expression:
A ( z ) = A 0 . e -'z" z/s (1)
where A ( z ) - activity of
210pb
in dpm/g at at depth z, A 0 - activity of 21~ in dpm/g at z = 0,z - depth of sediment in cm, s - sedimentation rate in c m . y-1, ,~ - decay constant.
If the initial activity A 0 is assumed to be constant, which implies that apart from the flux of the radionuclide, the sedimentation rate s is also constant, then a semilogarithmic plot of A ( z ) versus z should give a slraight line with an intercept of log A 0 and a slope of - 2 / s . From t h e slope, the sedimentation rate s can determined. Since the initial activity A 0 is assumed to be constant, this model is referred to as the Constant Initial Concentration (C.I.C) model. 1 With increasing depth, sediments are subject to significant compaction even over the depth interval for which the 21~ method is useful. In order to correct for this compaction effect, mass depth m ( z ) (g- cm -2) instead of linear depths z (cm) is used. Mass depth re(z) can be computed from the porosity profiles. Since porosity changes with depth, each sediment section Az should be corrected for compaction according to the equation: 2
A m = Az (1 - ~z) ~ (2)
where Am - weight o f the sediment section in g 9 cm -~, Az - thickness of each section in cm,
~z - porosity of sediment at depth z (the percentage of water content), - mean density of sediment solid in g 9 cm -3.
S. TADJIKI, H. N. ERTEN: RADIOCHRONOLOGY OF SEDIMENTS
An alternative way of taking compaction into account is to correct for linear depth z by using the porosity result of each sediment section Az 3
~ , = ~ .
r
4'~ +~z
(3)
1
where Az;i - corrected thickness of each section in cm, ~o i- porosity of sediment at depth z = 0.
If only a constant flux is assumed, the corresponding model is called Constant Rate of Supply (C.KS.)model. The age of a sediment core at a mass depth m(z) is given according to the Constant Rate of Supply model as:
allm(z) 1
t = -~-~ In I ~ A~L0pb~
9
~2,~,~.~(m) I
(4)allm(z)
Where: ~ A 2 , o ~ is the total unsupported 21~ in the entire sediment column in units of dpm 9 cm -2 and Y.A~,op~.~(m) is the unsupported 21~ below a mass-depth re(z). 4
Experimental
Sediment cores were recovered using a gravity corer with transparent PVC tubes (inner diameter 6 cm), a technique which has been previously used in studying Lake Zurich and Lake Constance sediments by us. 5,6 In those studies the recovery of the topmost sediment seCtion was checked by measuring cosmic ray-produced 7Be (53 d) in first sediment sample. Observation of 7Be as in our case indicated no sediment loss. In our present study the time elapsed between core recovery and core analysis did not allow the observation of 7Be.
The samples were stored vertically at 4 ~ and later extruded and sampled at 0.5 or 1 cm intervals. Fixed volume sediment samples were dried at 110 ~ for up to 48 hours prior to analysis and their dry weights were measured. These values, together with wet weights, were used to calculate the porosities. From the experimental porosities, correction for compaction of each sediment section was done according to Relation (3). Table 1 shows core codes, sampling depth, location and sampling dates of the cores analyzed.
Gamma-ray spectra were observed with a Coaxial Hyperpure Ge Detector with an active area, diameter, and height of 9200 mm 2. 52 mm. and 42 mm, respectively, connected to a multichannet analyzer. The resolution was 790 eV for the 122 keV "/-ray.
S. TADJIKI, H. N. ERTEN: RADIOCHRONOLOGY OF SEDIMENTS
Table 1
Core codes, sampling depth, location and sampling dates of the core analyzed
Core codes Sampling depth, Location Sampling date
C113
Core 2 (Turkey) 53 36 33 33 34 16 48 Sept/1984
Core 3 (Turkey) 83 36 32 18 34 18 30 Sept/1984
Core 35 (Turkey) 180 36 28 06 34 22 30 Oet/1984
Core BC-1 (Spain) 33 1986
Core BC-6A (Spain) 33 1986
Core KS-1A (Cyprus) 14 1991
Core KS-ZA (Cyprus) 12 1991
The dried samples were stored in closed beakers for about one month to ensure equilibrium between 226Ra and its daughters, which grow in with the 3.85 day half life of 222Rn. Dried samples (1-10 g) were counted for a period of 2.5.105 seconds by placing the counting samples directly on the detector, In order to minunize background activity, the detector was shielded by a lead cylinder with a height of 420 mm. thickness of 90 mm and diameter of 210 mm. In all of the measurements, the effect of self-absorption was assumed to be negligible. The background activity was sublracted from each specmnn. The 7-rays of 46.5. 351.9 and 661.6 keV belonging to the decay of
21~ 226Ra and 137Cs, respectively, were used for dating.
Results and discussion
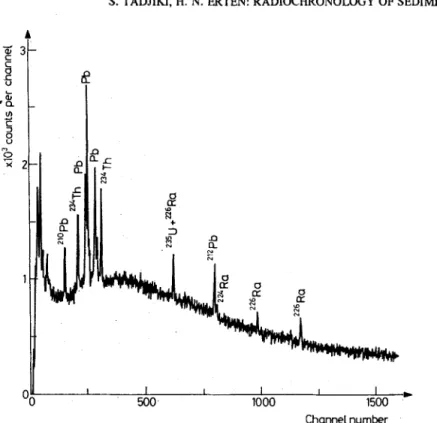
A typical 7-ray spectrum o f the sediment samples is shown in Fig. 1. The photopeaks
belonging to 21~ and 226Ra are well resolved. Unlike most other studies where the
levels of supported 2~~ is inferred from a few 2~~ measurements on much deeper
sections in the sediment core, we were able to determine the-226Ra levels and thus supported 2~~ in each section simultaneously. The efficiency calibration was carried out by using a standard solution. Five grams of an inactive matrix was mixed with a known activity of standard solution. The efficiencies at the counting geometry were
found to be 15,6% and 4.45% for 21~ and 226Ra, respectively.
Cores from the Western Mediterranean
The sediment cores were collected at two locations (BC-1 and BC-6A) on the eastern coast of Spain. The results of activity measurements for cores B C - I and B C - 6 A are given in Table 2. The unsupported 21~ activity profiles of cores B C - I and B C - 6 A
5
1
S. TADJIKI, H. N. ERTEN: RADIOCHRONOLOGY OF SEDIMENTS
I 11
t I I f I w,.
500' 1000 1500
Channel number
Fig. 1. Gamma-ray spectrum of the sediment samples prepared from the top section of core BC-I from the eastern coast of Spain
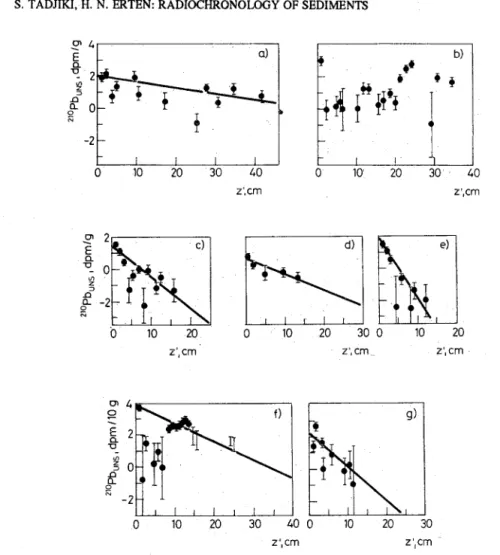
are shown in Figs 2a i o b . A weighted least.squares fit for core BC-1 leads to a sedimentation rate of 0.84 + 0.07 Cm 9 y-i or 0.21 + 0.02 g. cm -2 . y-1. The 21~ profile for core BC-6A showed a nearly constant 21~ activity. No sedimentation rate could be evaluated using the C.I.C. model. 21~ chronology was done only by the C.R.S. model.
The 21~ inventories of cores BC-1 and BC-6A were computed by assuming the annual atmospheric flux of unsupported 21~ as 0.9 dpm 9 cm -2. y-I 7 They were found as 107% and 160%, respectively. Within the uncertainty of the assumed flux, all the 21~ in both cores seems to be recovered.
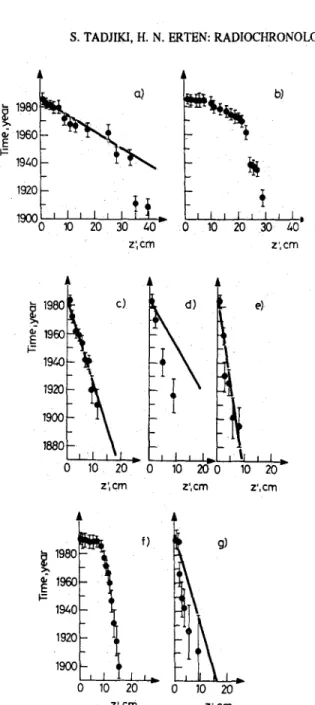
Figures 3a to b show the age-depth relation in cores BC-1 and BC:-6A. The points represent ages using Constant Rate of Supply model and the line represents those using Consant Initial Concentration model. For the core BC-1 the results of the two dating models are in good agreement with each other, tn core BC-6A, there seem to be two different regions, one between 0-20 cm having a high
S. TADJIKI, H. N. ERTEN: RADIOCHRONOLOGY OF SEDIMENTS 2
2
n 0
o -2a)
{
I o lO 2o 30 4:o Z ', c mb)
I
i
a)~
0 10 20 30 40 Z i c m 2tM
c,
~-2
2
o
lO
2o
z',cm
0 iO 20 30 0 10 20 Z', cm Z', c mo ~ 4 ~mll~
~
f)
g)
0 10 20 30 40 0 10 20 30 Z ,cm z cmFig. 2. Unsupported 210pb activity profile. The solid line is the weighted least-squares fit to the data. al core BC-1. b) core BC--6A, c) core-2, d) core-3, e) core-35, f) core KS-I, g) core KS-2
sedimentation rate of 1.39 + 0.12 cm 9 y-1 (0.50 + 0.04 g. cm -2. y-~) and the other below 20 cm, having a sedimentation rate of 0.23 +0.12 cm-y-~ (0.12+0.01 g.
9 cm-2. y,1),
Cores from the Eastern Mediterranean
Three sediment cores were rc~overed (Core-2, Core-3 and Core-35) from the southern coast of Turkey9 The 21~ activity measurements are given in Table 3. Figures 2c to 2e show the distribution of ~nsupported 21~ in cores 2, 3 and 35. The
S. TADJIKI, H. N. ERTEN: RADIOCHRONOLOGY OF SEDIMENTS 198C ~- 1960 E I= 1940 192o 1900 0 i 10 L A I ~ l ~ i I D. I i 20 30 0 10 z',cm b) I I I I I D 20 30 4O z', cm A . t I 0 1 0 20 z',cm L I i I . - o ~o 2 0 - 0 z ' , c m e) i, tl I 10 20 z',cm A W- p 1920 1900r E I 0 10 20 z',cm A ) g) 0 10 2O Z'j c m
Fig. 3. Comparison of Constant Rate of Supply and Constant Initial Concentration dating models. The points cnrrespond the Constant Rate of Supply model and the line represents the ~'onstant Initial Concentration model, a) core BC-I, b) core BC--6A, c) core-2, d) core-3, e) core-35, f) core KS, I, g) core KS-2
S. T A D J I K I , H. N. E R T E N : R A D I O C H R O N O L O G Y O F S E D I M E N T S
Table 2
Results o f activity m e a s u r e m e n t s for cores BC-1 a n d B C - 6 A
BC-1 B C - 6 A
Depth,
c m A210pbTot., A210pbsupp. , A210pbu~supp. , A210pbTot., A210pbsupp. , A210pblJnsupp., d p m / g d p m / g d p m / g d p m / g d p m / g d p m / g 1 11.33 + 0.94 3.20 • 0.32 8.13 • 0.99 25.89 • 2.43 3.25 • 0.09 21,65 • 2 9,72 • 0.94 0.52 • 0.09 9.20 • 0.95 5.00 • 0.58 4.02 • 0.38 0.98 • 3 7.06 • 0.68 4.80 • 0.51 2 . 2 6 • 0.44 - - - 4 4 . 6 2 • 0 . 7 7 • 3 . 8 5 • 4 . 0 9 • 2 . 8 0 • 1.28 • 5 3 . 0 7 • 2 . 9 7 • 0 . 1 0 + 0 , 4 9 5 . 9 1 + 0 . 8 1 4 . 3 8 • 1.53 • 6 9 . 7 2 • 2 . 0 4 • 7 . 6 8 • 5 . 2 3 • 4 . 1 7 • 1.0~5 • 7 6.33 • 0.77 3.72 • 0.39 2.61 - 0.86 4.39 • 0.85 3.25 • 0.33 1.14 • 0.92 8 2.27 • 0.25 2.06 • 0.26 0.22 • 0.36 4.88 • 0.67 1.12 • 0.34 3.76 • 0.74 9 1.21 • 0 . 1 2 1.32 • 0.16 - 5.21 • 1.11 1.32 • 0.36 3.89 • 1.15 10 3 . 1 1 • 1 . 4 3 • 1 . 6 8 • 4 . 1 0 • 2 . 6 6 • 1.44 • 11 1 . 5 9 • 3 . 3 3 • - 5 . 9 4 • 4 . 1 2 • 1.82 • 12 2.99 • 0.28 - - 6.72 • 0.62 3.82 • 0.23 2.90 • 0.67 13 1 . 2 4 • 0 . 8 0 • 0 . 4 4 • 2 . 0 0 • 0 . 5 2 • 1.48r • 14 4 . 4 3 • 0 . 6 0 • 3 . 8 3 • 8 . 0 6 • 1 . 1 2 • 6.87 • 15 1.26 • 0.14 2.17 • 0.31 - 16.30 • 0.99 3.70 - 0.42 12,61 • 1.07 16 1 , 9 5 • 0 . 4 3 • 1 . 5 1 • 2 2 . 6 3 • 5 . 7 0 • 16.94 • 17 4.40 • 0 . 6 0 0.78 • 0,11 3 . 6 I • 0.60 5.47 • 0.91 5.23 • 0.44 0 . 2 3 4 • 1.04 18 - - - 3.63 • 0,71 4.41 • 0.46 - 19 3.37 • 0.37 3,18 • 0.34 0.19 • 0.51 2.37 • 0.72 1.95 • 0.33 0.41 • 0.79 20 3.58 • 0.43 1,41 • 0.19 2.18 • 0.47 11.26 • 1.26 4.24 • 0.31 7,02 • 1.36 21 2.39 • 0.22 5,96 • 0.59 - 10.22 • 2.24 10.38 • 0.97 - 2 2 0.76 • 0.08 1.81 • 0.22 - 7.67 • 1.11 1.89 • 0.45 5.78 • 1.20
corresponding sedimentation rates are 0.16+0.01 cm .-1 (0.08+0.01 g - c m -2 y~Z), 0.31 +0.05 c m . y-1 (0.13 +0.02 g. cm -2. y-l) and 0.085 c m . y-1 (0,040+0.003 g- . cm-2, y-l) for cores 2, 3 and 35, respectively. The atmospheric fluxes of 21~ for these cores are evaluated as 0.15 + 0.01 pCi- cm -2. y-l, 0.12 + 0.03 pCi. cm -2- y-i and 0.14 + 0.02 pCi. cm -2. y-l, respectively.
The results of the C.I.C. and C.R.S. models for cores 2, 3 and 35 are in good agreement with each other, as shown in Figs. 3c to e. The 2~~ inventories in cores 2, 3 and 35 were computed by assuming an annual atmospheric flux o f 0.9 dpm 9 cm -2. y-~. The results were 27.5, 23.3 and 34%, respectively. Such low inventories may be due to the possible loss of 2Z~ activity or more probably due to the high value of atmospheric flux assumed. Indeed the average flux of 21~ computed in this region was around 0.14 pCi 9 cm -2 9 y-~, which is by a factor of three less than the reported value.
;>
S. TADJIKI, H. N. ERTEN: RADIOCHRONOLOGY OF SEDIMENTS
e~
g~
e ~ 41 ~ § '1'1 ~ I ~ ~ I '1'1 I I I '1'1 '1'1 ~ ~ ~ ~ ~ ~ ~ ~ § I ~ § 2 4 7 9 1"1 § I "H I § I I "I-I I I . . . ~ +I '1'1 I '1'1 ~ ~ ,1,1 .1.1 ~ I '1'1 § § .1.1 ~ '1'1 ~ fl .1.1 I § fl I § § § § ,1,1 § .1.t § .1.1 ~ ~ ~ '1'1 § § § § § ~ § § § § § ~1 §S. TADJIKI, H. N. ERTEN: RADIOCHRONOLOGY OF SEDIMENTS
Table 4
Results of the activity measurements for cores KS--1 and K ~ - 2
KS-1 KS-2
Depth,
em A210pbTot. ' A210pbst~.' . A210PbUntupp. ' A210PbTot ', A210pbsupP .' A210pbUnsupp. '
dpm/10 g dpm/10 g dpm/10 g dpm/10 g dpm/10-g dpm/10 g 0.5 46.85 -,- 2.66 5.66 • 0.63 41.19 9 2.73 24.19 • L7o 13.73 • 0.79 10.46 • 1.88 1.0 6.37 -,- 1.61 5.91 • 0.53 0.46 • 1.7o 12.39 • 2.98 11.42 • 0.65 0.98 • 3.05 1.5 6.79 • 1.08 2.24 • 0.29 4.55 • 1.11 41.68 • 3.50 7.92 • 1.35 33.93 -,- 3.76 2.0 3.95• 0.86 6.66 • 0.52 - 8.86 • 2.33 12.18 • 0.97 2.5 9.16 • 1.43 7.93 • 0.51 1.23 • 1.52 22.68.• 2.71 8.63 • 0.98 14.05 • 2.88 3.0 6.49 • 1.o4 3.93 • 0.56 2.56 • 1.18 18.42 • 1.43 15.44 • 0.58 2.97 • 1.54 3.5 7.89 • 1.21 6.95 • 0.50 0.94 • 1.72 8.97 • 1.18 12.15 • 0.67 4.0 11.45 -,- 1.0o 11.46 • 0.64 - 16.o5 • 2.34 23.46 • 1.02 4.5 15.oo • 1.72 4.61 • 0.45 10.39 • 1.77 15.37 • 2.76 8.93 • 1.16 6.43 • 2.99 5.0 20.84 • 1.41 7.43 • 0.44 13.41 • 1.48 3.22 • 1.33 13.43 • 0.56 5.5 20.62 + 2.40 7.48 • 0.78 13.14 • 2.52 - 17.68 • 1.21 6.0 25.26 • 3.05 10.88 • 0.10 14.38 • 3.05 13.67 • 0.69 6.5 26.55 • 3.27 9.76 • 0.96 16.79 • 3.41 9.17 • 1.94 10.77 • 0.92 - 7.0 28.78 • 3.62 10.78 • 1.20 18.0o • 3.81 16.08 • 1.59 13.66 • 0.49 2.4i • 1.66 7.5 25.63 • 2.77 10.39 • 0.87 15.24 • 2.90 - 13.53 • 1.07 8.0 16.33 • 3.06 8.68 • 0.84 7.65 • 3.18 14.96 • 2.17 11.39 • 0.95 3.56 • 2.37 8.5 15.69 • 2.98 9.35 • 0.89 6.34 • 3.11 9.77 • 2.70 8.62 • 0.79 1.15 • 2.81 9.0 3.95 ~ 2.42 14.87 • 0.72 . . . . 9.5 - 12.75 • 1.89 . . . . 13.5 8.28 • 1.0o 2.91 • 0.49 5.37 • 1.11 14.0 5.31 • 1.43 0.73 • 0.35 4.58 • 1.47 - - - A p o s s i b l e s e d i m e n t l o s s a t t h e t o p m o s t s e c t i o n s h o u l d n o t a f f e c t t h e s e d i m e n t a t i o n r a t e d e t e r m i n e d b y t h e 21~ m e t h o d . It w i l l h o w e v e r , s e r i o u s l y a f f e c t t h e r a t e d e t e r m i n e d b y t h e 137Cs m e t h o d . I n o u r c a s e t h e s e d i m e n t a t i o n r a t e s o b t a i n e d b y b o t h m e t h o d s a g r e e q u i t e w e l l . W e t a k e t h i s a s a n i n d i c a t i o n o f n o l o s s in t h e u p p e r m o s t s e c t i o n s o f t h e s e d i m e n t c o r e s a m p l e s . T w o s e d i m e n t c o r e s w e r e r e c o v e r e d f r o m n o r t h e r n C y p r u s ( K S - 1 a n d K S - 2 ) , T h e a c t i v i t y m e a s u r e m e n t s a r e s u m m a r i z e d in T a b l e 4. F i g u r e s 2 f to g s h o w t h e u n s u p p o r t e d 21~ a c t i v i t y p r o f i l e f o r K S - 1 a n d K S - 2 . T h e s e d i m e n t a t i o n r a t e s w e r e e v a l u a t e d a s 0 . 2 8 + 0 . 0 1 c m . y - i ( 0 . 2 2 + 0 . 0 1 g - c m - z - y - l ) a n d 0 . 1 6 + 0 . 0 4 c m 9 y-1 ( 0 . 1 3 + 0 . 0 3 g - . c m - 2 . y - l ) , r e s p e c t i v e l y , T h e c o r r e s p o n d i n g a t m o s p h e r i c f l u x e s o f 2~~ w e r e 0 . 4 4 + 0 . 0 2 p C i . c m - 2 . y-1 a n d 0 . 1 7 + 0 . 0 4 p C i ~ c m - 2 . y-1. T h e 21~ i n v e n t o r i e s b a s e d o n a f l u x o f 0 . 9 d p m . c m - 2 . y-1 w e r e in 5 8 % a n d 3 2 % , r e s p e c t i v e l y . T h e a v e r a g e a t m o s p h e r i c f l u x c o m p u t e d f o r t h i s r e g i o n o f a b o u t 0 . 3 0 p C i 9 c m -2 9 y-~ is p r o b a b l y a
S. TADJiKI, H. N. ERTEN: RADIOCHRONOLOGY OF SEDIMENTS
better representation of the atmospheric 2i~ flux. The results of C.R.S, and C.I.C. models are shown in Figs 3f to g .
Fallout iSZCs measurements
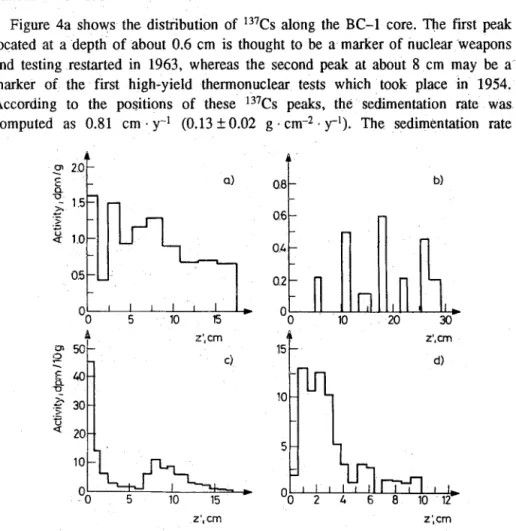
Figure 4a shows the distribution of 137Cs along the BC-1 core. The first p e a k located at a depth of about 0.6 cm is thought to be a marker of nuclear Weapons and testing restarted in 1963, whereas the second peak at about 8 cm may be a~ marker of the' first high-yield thermonuclear tests which t o o k place in 1954. According to the positions of these
137CS
peaks, the sedimentation rate was computed as 0.81 cm .y-1 (0,13+0.02 g.cm-2.y-1). The sedimentation rate" 0
-~
lSi!
~
~z 1.0 0.5 A Z '~ c m o~ 5 0 - c) 30 ,x 2010n -
-
k
~
Y~
5
I0
15
O.8 b) 0.6 0.4n
~ " 1 o 20 ' Z',Cm 1 5 - d) fl i I t I I III I i I t I1,_-0 2 4 6 8 10 "12'
Z!, cro Z'~ c mFig. 4. Distribution of 137Cs activity, a) core BC-1, b) core BC--6A, c) core KS-I, d) core KS-2
obtained from 137Cs profile is in good agreement with the value obtained by the 21~ method. The position of the 1963 peak indicates'a possible loss of the sediment material from the upper part of the core during sampling, Another reason cold be the upward migration of
137Cs
from the deeper Sections. The137Cs
profile did not reveal a clear distribution pattern that could lead to dating for the BC-6A core.s. TADJIKI, H. N. ERTEN: RADIOCHRONOLOGY OF SEDIMENTS
Figures 4c to d s h o w the distribution o f the fallout i37Cs along the K S - 1 and K S - 2 cores. T h e high 137Cs l e v e l s in the top sections o f both cores are striking and can be attributed to the fallout f r o m C h e m o b y l in M a y 1986. The origin o f the 137Cs is c o n f i r m e d by the a s s o c i a t e d p r e s e n c e o f the short-lived t3~2s isotope. T h e activities o f 137Cs and 134Cs at the top section o f the s e d i m e n t cores w e r e corrected to M a y 1986. T h e ratios o f 137Cs to i34Cs activity w e r e c o m p u t e d as 3.13 and 2.68, respectively. T h e s e ratios are in g o o d a g r e e m e n t with those reported, s Sedimentation rates w e r e derived as 0.30 + 0.04 c m 9 y-1 (0.20 + 0.02 g . cm -2. y - l ) and 0.21 + 0.03 cm 9 y-i (0.17 + 0.02 g - . c m - 2 . y - l ) for K S - 1 a n d K S - 2 , r e s p e c t i v e l y , in g o o d a g r e e m e n t with those from 21~ dating. T h e o b s e r v e d fallout 137Cs activities for cores 2, 3 and 35 were quite low to allow any dating.
Conclusion
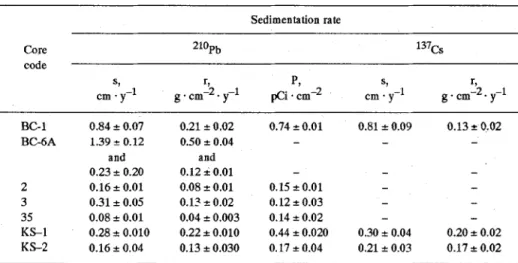
Table 5 s u m m a r i z e s the results o f sedimentation rates for sediments from the Western and Eastern M e d i t e r r a n e a n , using 21~ and i37Cs methods. T h e sedimentation rates in the M e d i t e r r a n e a n S e a s e e m to be higher than those reported for the M a r m a r a S e a (0.11 c m . y-i (0.087 g . cm - 2 . y-l)).9 T h e high sedimentation rates o f the cores B C - 1 and B C - r A are in the s a m e r a n g e as those o f rivers (0.37-4.00 g 9 cm -2. y-1),10 T h e s e high sedimentation rates are p r o b a b l y due to the fact that m o s t o f the cores o f this w o r k w e r e r e c o v e r e d Very near the shore.
Table 5
summary ot resultS ot ttae sea~mentauon rate determinations from cores of the Western and Eastern Mediterranean using 210pb and 137Cs
Sedimentation rate
Core 210pb 137Cs
eode
S~ r~ P~ s~ r,
cm - y-1 g . cm-2. y-1 pCi 9 -2 cm 9 y-1 g . cm-2. y-1 BC-1 0.84 • 0.07 0.21 • 0.02 0.74 • 0.01 0.81 - 0.09 0.13 • I).02 BC-6A 1.39 _* 0.12 0.50 • 0.04 - - - and and 0.23 • 0.20 0.12 4 0.01 - - - 2 0.16 • 0.01 0.08 • 0.01 0.15 • 0.01 - - 3 0.31 • 0.05 0.13 • 0,02 0.12 • 0.03 - - 35 0.08 • 0.01 0.04 • 0.003 0.14 _+ 0.02 - - KS-1 0.28 • 0.010 0.22 _+ 0.010 0.44 • 0.020 0.30 • 0.04 0.20 • 0.02 KS-2 0.16 • 0.04 0.13 • 0.030 0.17 • 0.04 0.21 • 0.03 0.17 • 0.02
S. TADJIKI, HI N. ERTEN: RADIOCHRONOLOGY OF SEDIMENTS
Every radioactive nuclide present in the sediments may, in principal, serve as the basis for a particular method of age determination. The sole knowledge of the concentration of radionuclides in sediment does not suffice and further information is in
fact necessary. In the case of deep-sea sediments, 14C, 1~ 23~ 231pa, 230Th-232Th,
231pa--23~ measurements! 1 are used in chronological studies.
The 2~~ and 137Cs radionuclides may also be considered useful in the chronology
of sea sediments, where the average depth of the region is of the order of those of lakes.
The distribution of 2t~ and 137Cs radioisotopes in the inshore regions may be affected
by physical mixing and/or erosion process.
The sediment cores from Spain were kindly provided by Dr. Graham EVANS of Imperial College, London. Those of Turkey and Northem Cyprus were provided by Dr. Ilkay SALIHOGLU of the Institute of Marine Sciences, Middle East Technical University, Erdemli, Mersin. We thank both colleagues for many fruitful discussions and for the sediment cores.
References
1. J. A. ROBBINS, D. N. EDINGTON, Depositional Processes and the Determination of R e c e n t Sedimentation Rates in Lake Michigan, Proc. Great Lakes Conf. on lnteragency Commission of Marine Science and Engineering, Argonne Natl. Lab., Argonne, IU. 25-27 March, 1976, p. 287.
2. E. MATSUMOTO, Geological Survey of Japan, Yatabe, Tsukuba, Ibaraki, Japan, 1980, p. 305. 3. D. P. KHARKAR, J. THOMSON, K. K. TUREKIAN, R. S. MACCAFFREY, Annual Progress Repoa,
AEC C00-3573-8, Yale University New Haven, Conn., 1974.
4. J. A. ROBBINS, Biogeochemistry of Lead, L P. NRIAGO (Ed.), Elsevier, 1978, p. 285.
5. H.R. VON GUNTEN, M. STURM, H. N. ERTEN, E. ROSSLER, F. WEGMULLER, Schweiz. Z. Hydrol., 49 (1987) No. 3, 275.
6~ H. N. ERTEN, H. R. VON GUNTEN, E. ROSSLER, M. STURM, Schweiz. ZI Hydrol., 47 (1985) 5. 7. K. K. TUREKIAN, L. K~ BENNINGER, E. P. DION, J. Geophys. Res., 88 (1983) 5411.
8. TAEK, Turkish Atomic Energy Commission, Radioactivity Measurements in Turkey after Chemobyl, March, t988.
9. G. EVANS, H. ERTEN, S. N. ALAVI, H. R. VON GUNTEN, M. ERGIN, Geomarine Letters 9 (1989) 27. 10. R. A. CAHILL, A. D. AUTREY, J, Radioanal. Nucl. Chem., 110 (1987) 197."