1445
Received: 7 May 2018 Revised: 27 June 2018 Accepted article published: 8 July 2018 Published online in Wiley Online Library: 30 July 2018 (wileyonlinelibrary.com) DOI 10.1002/pi.5667Property enhancement in polypropylene
ternary blend nanocomposites via a novel
poly(ethylene oxide)-grafted
polystyrene-
block-poly(ethylene/butylene)-block-polystyrene toughener–compatibilizer system
Emre Tekay,
a
Serap Ba¸skır,
b
Nihan Nugay,
b
Turgut Nugay,
b
Bülend Ortaç
c
and Sinan ¸Sen
a*
Abstract
Synthesis and characterization of a novel toughener–compatibilizer for polypropylene (PP)–montmorillonite (MMT) nanocom-posites were conducted to provide enhanced mechanical and thermal properties. Poly(ethylene oxide) (PEO) blocks were syn-thetically grafted onto maleic anhydride-grafted polystyrene-block-poly(ethylene/butylene)-block-polystyrene (SEBS-g-MA). Special attention was paid to emphasize the effect of PEO-grafted SEBS (SEBS-g-PEO) against SEBS-g-MA on morphology, static/dynamic mechanical properties and surface hydrophilicity of the resultant blends and nanocomposites. It was found that the silicate layers of neat MMT are well separated by PEO chains chemically bonded to nonpolar SEBS polymer without needing any organophilic modification of the clay as confirmed by X-ray diffraction and transmission electron microscopy anal-yses. From scanning electron microscopy analyses, elastomeric domains interacting with MMT layers via PEO sites were found to be distributed in the PP matrix with higher number and smaller sizes than the corresponding blend. As a benefit of PEO grafting, SEBS-g-PEO-containing nanocomposite exhibited not only higher toughness/impact strength but also increased creep recovery, as compared to corresponding SEBS-g-MA-containing nanocomposite and neat PP. The damping parameter of the same nanocomposite was also found to be high in a broad range of temperatures as another advantage of the SEBS-g-PEO toughener–compatibilizer. The water contact angles of the blends and nanocomposites were found to be lower than that of neat hydrophobic PP which is desirable for finishing processes such as dyeing and coating.
© 2018 Society of Chemical Industry
Keywords: polypropylene nanocomposites; mechanical properties; elastomeric compatibilizer; silica nanotube; creep; wettability
INTRODUCTION
Polymer nanocomposites have been studied extensively for almost two decades. Particularly, nanocomposites with nanopar-ticles having two nanoscale dimensions show some major improvements in mechanical properties, gas barrier proper-ties, thermal stability and fire retardancy. Toughness as another most important property for polymeric materials to be used in engineering applications attracts an increased interest in both science and industry. Unfortunately, the presence of rigid, inor-ganic nanoparticles in a polymer matrix results in a deterioration of the ductility and toughness.1,2 The reason behind this
phe-nomenon can be either aggregate formation due to incomplete dispersion of nanoparticles which then causes premature crack formation or the presence of exfoliated nanoparticles restricting the molecular mobility of the surrounding matrix material leading to embrittlement or both. Toughening of polymers has been achieved with various methods reported in the literature. Among the most effective toughening techniques used for thermo-plastics is rubber toughening by impact-modifier elastomeric
inclusions in the polymer matrix.3–5 Moreover, elastomeric
properties of polymer nanocomposites can be enhanced by surrounding the nanoparticles with an elastomeric chain. For this purpose, elastomer-based compatibilizer–toughener sys-tems have been widely utilized in polypropylene (PP)-based nanocomposites.6–8 In our recent study, maleic
anhydride-grafted polystyrene-block-poly(ethylene/butylene)-block-polystyrene (SEBS-g-MA) elastomeric compatibilizer was used for PP/halloysite nanocomposites.9The improvement in toughness
∗ Correspondence to: S ¸Sen, Department of Polymer Engineering, Yalova
Univer-sity, Yalova, 77200, Turkey. E-mail: [email protected]
a Department of Polymer Engineering, Yalova University, Yalova, Turkey b Department of Chemistry and Polymer Research Center, Bo˘gaziçi University,
˙Istanbul, Turkey
c UNAM-National Nanotechnology Research Center, Institute of Materials
1446
with modulus and strength was ascribed to interactions of surface functional groups of clays and MA groups of the elastomer.10,11
There have been various efforts mage to enhance the tough-ness of PP nanocomposites. Zhu et al.12 used poly(ethylene
glycol) (PEG)/montmorillonite (MMT) hybrids in the preparation of PP nanocomposites and obtained relatively high toughness with a slight decrease in tensile strength. This was attributed to strong interaction between PEG and MMT layers.13 Also, the
same research group synthesized PEG-grafted PP as a com-patibilizer for PP/MMT nanocomposites14 and obtained 148
and 43% increases in impact strength and elongation at break, respectively, together with improved tensile strength. These enhancements were reported to be caused by interaction of PEG molecules of the compatibilizer with MMT surfaces while its PP segments were in contact with PP matrix molecules. Block copolymers with poly(ethylene oxide) (PEO) such as PEO-block-polyisoprene15 and poly(styrene-block-ethylene
oxide)16 have also been used to prepare clay-containing
nanocomposites.
In the study reported here, a novel PEO-grafted SEBS-g-MA (SEBS-g-PEO) as a toughener–compatibilizer was synthesized for the effective toughening of PP nanocomposites. For this purpose, PEO blocks were synthetically grafted onto SEBS-g-MA. The synthesized SEBS-g-PEO graft copolymer having suitable PEO polar sites is expected interact effectively with unmodified MMT clays during the melt-mixing process in nanocompos-ite preparation. This type of special toughener–compatibilizer system (SEBS-g-PEO) well intercalating the MMT layers via its PEO segments is also expected to be simultaneously effective in toughening and reinforcing of PP. The tensile mechanical, dynamic mechanical, creep and thermal properties of the resul-tant ternary nanocomposites reinforced with 3% MMT were particularly investigated as a function of the nature of the elas-tomeric compatibilizer: SEBS-g-MA or SEBS-g-PEO and their corresponding blends.
EXPERIMENTAL
Materials
SEBS-g-MA with brand name FG 1901X (melt flow index of 22 g (10 min)−1, 230 ∘C, 5 kg), which has 30 wt% styrene
and 1.84 wt% MA, was bought from Kraton Company, USA. Monomethyl ether–PEO with a number-average molecular weight of 2000 g mol−1 was a product of Fluka Chemical
Cor-poration (Ronkonkoma, NY, USA). The solvents tetrahydrofuran (THF), methanol and toluene were purchased from Merck Milli-pore Corporation (Darmstadt, Germany). PP homopolymer (brand name Y101) with a density of 0.9 g cm−3and a melt flow index of
15 g (10 min)−1(230 ∘C, 2.16 kg) was supplied by Sumitomo
Corpo-ration, Turkey. Natural sodium montmorillonite (NaMMT, Nanofil 116) with a cationic exchange capacity of 100 meq (100 g)−1was a
product of Süd Chemie (Moosburg, Germany).
Synthesis of SEBS-g-PEO
The synthesis of SEBS-g-PEO was carried out in a Dean–Stark apparatus by removing water continuously from the solution. The mole ratio of MA to PEO was adjusted to be 1:2. Solutions of 20.04 g of SEBS-g-MA in 200 mL of toluene and 14.59 g of PEO in 150 mL of toluene were stirred in a Dean–Stark apparatus at 110 ∘C for 12 h. The mixture was then precipitated in tenfold excess of methanol.
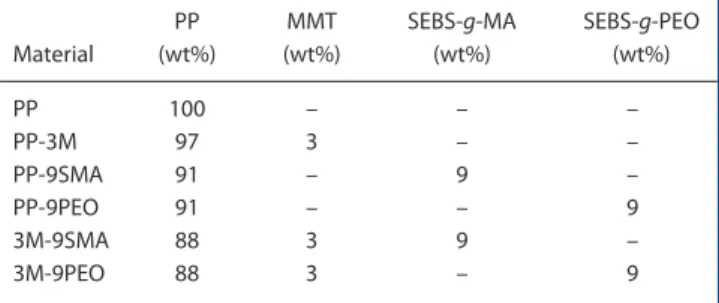
Table 1. Sample designation and composition
Material PP (wt%) MMT (wt%) SEBS-g-MA (wt%) SEBS-g-PEO (wt%) PP 100 – – – PP-3M 97 3 – – PP-9SMA 91 – 9 – PP-9PEO 91 – – 9 3M-9SMA 88 3 9 – 3M-9PEO 88 3 – 9
The product was washed repeatedly with methanol to remove excess PEO.
Preparation of PP–MMT nanocomposites
Ternary nanocomposites were prepared using the melt-mixing method. PP, SEBS-g-MA or SEBS-g-PEO and NaMMT were directly melt-blended in a counter-rotating internal mixer (custom-made Internal Mixer-METGÜR, Turkey). Mixing was conducted at 200 ∘C with a rotor speed of 80 rpm for 10 min. The prepared nanocom-posites were shaped in a hot press at 200 ∘C for 5 min followed by 3 min of cooling under 30 bar. All the compositions prepared are detailed in Table 1.
Characterization
1H NMR spectra of SEBS elastomers were obtained with a 400 MHz
Varian Mercury-VX NMR spectrometer (Varian Associates, Palo Alto, CA, USA). Fourier transform infrared (FTIR) spectra of samples were obtained with a 1600 FTIR spectrophotometer (PerkinElmer, Waltham, MA, USA).
DSC measurements were performed at a heating rate of 10 ∘C min−1 under nitrogen atmosphere with a DSC-Q200
instrument (TA Instruments, New Castle, DE, USA). The DSC thermograms were recorded from the second heating to avoid any thermal history.
XRD analyses were done to measure the basal spacing (d001
reflection) of MMT clay in the nanocomposites using a D/Max 2200 Ultima diffractometer (Rigaku, Japan). The analyses were conducted with Cu K𝛼 radiation (𝜆 = 1.54 Å) at 40 kV and 40 mA with a scanning rate of 2∘ min−1.
TEM analyses of the PP nanocomposites were conducted using a TecnaiTM G2 F30 (FEI, OR, USA) instrument with an accelera-tion voltage of 200 kV. Ultrathin samples (about 100 nm) were pre-pared using a cryo-ultramicrotome (Leica EMUC6/EMFC6, Vienna, Austria) with a diamond knife and then placed on copper grids for the analyses. SEM analyses of the nanocomposites after ten-sile and impact tests were performed using ESEM-FEG and an EDAX XL-30 microscope (Philips, The Netherlands). Moreover, the cryo-fractured samples were etched with THF solvent at 60 ∘C for 30 min to follow SEBS domains dispersed in the nanocomposites.9
Tensile mechanical properties of samples with dimensions of 8.0 × 50 × 1.0 mm3were determined with a Zwick/Roell
univer-sal testing machine (Zwick, Germany) with a 1 kN load cell at room temperature at a constant test speed of 50 mm min−1.
Charpy impact tests of notched (45∘ and 2 mm depth) samples with dimensions of 10 × 50 × 1.0 mm3were performed using a
Ceast 9050 Impact Pendulum (Instron, USA) having a 5 J ham-mer. Dynamic mechanical analysis (DMA) of the PP nanocom-posites was conducted using a DMA Q800 analyser (TA Instru-ments, New Castle, DE, USA). The samples were tested in single
1447
Figure 1. Representative grafting reaction of PEO on SEBS-g-MA.cantilever mode at a constant frequency of 1 Hz and at a heating rate of 5 ∘C min−1under nitrogen atmosphere. The average
dimen-sions of the moulded PP samples were 8 × 35 × 1 mm3.
Isother-mal short-time creep tests of the same sized samples were done using the DMA instrument in single cantilever mode. The creep strain was obtained at a constant stress (𝜎0) of 5 MPa and at
30 ∘C for 15 min. The permanent deformation was measured by a recovery followed after load removal for 15 min at the same temperature.
Water contact angles of the prepared samples were measured with a CAM 101 instrument (KSV Instruments) at room temper-ature. The measurements were repeated five times and aver-aged for each sample using water droplets of about 4 μL. The contact angles were calculated using software according to the Laplace–Young model.
RESULTS AND DISCUSSION
Synthesis and characterization of SEBS-g-PEO
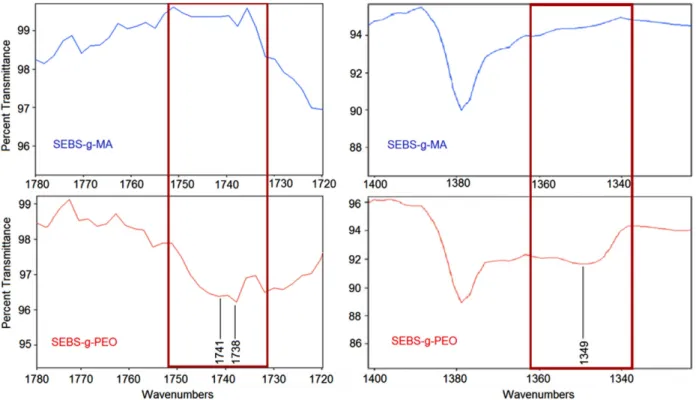
PEO was grafted onto the SEBS-g-MA backbone with the reaction shown in Fig. 1. The grafting of PEO was characterized using FTIR spectra (Fig. 2) and 1H NMR spectra (Fig. 3) of SEBS-g-MA and
SEBS-g-PEO elastomers.
The carboxylic acid and ester groups resulting from the hydroly-sis and MA ring-opening reactions were particularly followed with FTIR spectra (Fig. 2). The peak appearing at 1350 cm−1in the
spec-trum of SEBS-g-PEO is an indication of the ring-opening reaction and formation of acid groups.17Also, the peak at 1738–1741 cm−1
indicates formation of ester group and confirms the presence of PEO blocks in the structure.18Figure 3 shows1H NMR spectra of
SEBS-g-MA and SEBS-g-PEO. A new peak belonging to PEO protons appeared at 3.5 ppm,19indicating that the grafting reaction of PEO
onto SEBS-g-MA had been successful. From the spectra, integral areas of benzylic protons of polystyrene and PEO molecules were compared. Grafting efficiency was calculated using the1H NMR
peak integration method20–22and using the following formula:
Grafting efficiency (%) = XPEO× ZPS× YPS× MMA× 100
YPEO× ZMA× MS× DPnPEO× XPS
(1) where X and Y are peak intensity and proton number, respectively,
Z is the weight percent and M is the molecular weight. The grafting
efficiency of PEO molecules onto SEBS-g-MA elastomer was found to be 22.37%.
As a complementary technique for the characterization of PEO grafting, DSC was used to follow the thermal transitions of SEBS-g-MA and SEBS-g-PEO (Fig. 4). The glass transition of the polystyrene block in the elastomers appeared at much lower temperatures than that of polystyrene homopolymer (around 100 ∘C) which is most probably due to the plasticizing effect of flexible polyethylene–polybutylene units.23The two endotherms
observed at 12.4 and 37.6 ∘C which belong to ethylene–butylene
1448
Figure 3.1H NMR spectra of SEBS-g-MA and SEBS-g-PEO.
Figure 4. DSC thermograms of SEBS-g-MA and SEBS-g-PEO.
crystalline regions24were found to broaden for SEBS-g-PEO
poly-mer which can be ascribed to the disturbance of crystallinities with PEO grafting.23 The ethylene–butylene unit of SEBS-g-MA
exhibited a glass transition temperature (Tg) of −52.5 ∘C whereas
it shifted to a higher temperature (−49.3 ∘C) for SEBS-g-PEO. This result may be attributed to possible interaction of the carboxylic acid groups and PEO molecules of polymers through hydrogen bonding and dipole–dipole forces, leading to a restriction of chain mobility. Moreover, the presence of melting transition of the PEO block of SEBS-g-PEO at 48.4 ∘C confirms its grafting onto SEBS-g-MA. This lower melting temperature of the PEO block in the elastomer as compared to that of PEO homopolymer (around
55 ∘C) may be caused by other blocks of SEBS-g-PEO distorting the crystallinity of PEO.25
Structural characterization of polymer nanocomposites
The effect of PEO grafting on the dispersion of MMT silicate lay-ers in the PP nanocomposites was investigated by performing XRD analyses (Fig. 5). The d-spacing of the clay was determined from its corresponding d001reflection. The NaMMT clay has a
diffrac-tion angle of 7.11∘ with a d-spacing of 12.40 Å for its d001
reflec-tion. Both PP-3M binary nanocomposite and 3M-9SMA ternary nanocomposite exhibited slightly higher d-spacing values (12.69
1449
Figure 5. XRD patterns of PP-3M, 3M-9SMA and 3M-9PEO nanocomposites.and 12.91 Å, respectively) than pure MMT which is an indica-tion of intercalated nanocomposite structures. On the other hand, 3M-9PEO ternary nanocomposite was found to have a much higher d-spacing (16.11 Å) as compared to pure MMT and other nanocomposites, indicating a further expansion of the silicate lay-ers. This result can be ascribed to the effect of longer and polar PEO molecules of the SEBS-g-PEO elastomeric toughener that acts as an effective spacer for clay layers due to its high capability for intercalation of the clay layers as compared to SEBS-g-MA.12–14
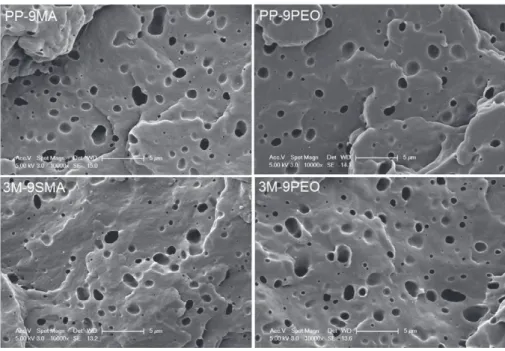
The structural morphologies of the nanocomposites were also examined using TEM analyses and the images are shown in Fig. 6. From low- and high-magnification TEM images, one can easily observe the intercalated structures of the ternary nanocomposites 3M-9SMA and 3M-9PEO as a confirmation of their XRD data (Fig. 4).
In the case of 3M-9PEO, some of the clay layers seem to exist in smaller tactoids with relatively large d-spacing and orient in dif-ferent directions with some exfoliation-based dispersion which is again in agreement with the XRD data of the same nanocomposite. The distribution of the elastomer phases (SEBS-g-PEO and SEBS-g-MA) in the blends and nanocomposites was examined using SEM analyses of the etched surfaces of cryo-fractured samples. Figure 7 shows the corresponding SEM images. It appears from the SEM images of the blends that the SEBS-g-PEO elastomeric compatibilizer seems to be more homogeneously dis-tributed in the matrix with relatively small size (about 2.5 μm and less), as compared to the SEBS-g-MA-containing blend. In terms of the ternary nanocomposites (3M-9SMA and 3M-9PEO), the number of small-sized elastomer particles was found to increase together with a decrease in average particle size, particularly for 3M-9PEO nanocomposite. This can be explained by the shear thinning of the elastomer particles due to their interaction with the MA and PEO groups of the elastomers.10
Tensile mechanical properties and impact strength of nanocomposites
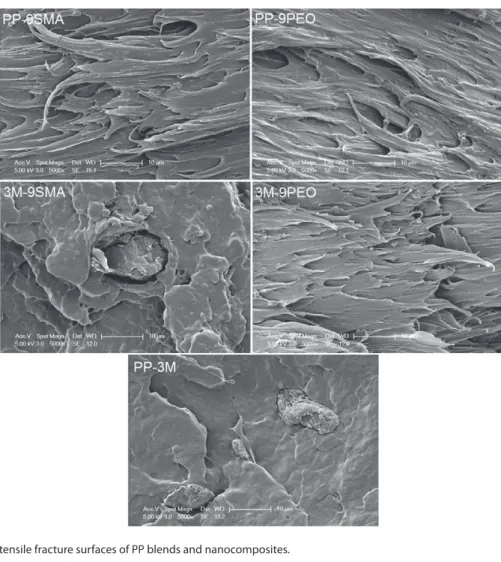
The tensile mechanical properties (tensile modulus, yield strength and toughness) and Charpy impact resistance values of PP, its blends and the ternary nanocomposites are presented in Table 2. Tensile fracture surfaces of the blend and nanocomposite systems were also investigated using SEM (Fig. 8). As evident from Table 2, PP-3M binary system exhibited lower Young’s modulus and yield strength values as compared to neat PP, and the lowest tough-ness among the nanocomposites. This result can be explained by presence of large MMT clay aggregates dispersed in the PP matrix (Fig. 8) resulting from weak PP matrix–clay interactions
1450
Figure 7. SEM images of cryo-fractured and etched surfaces of PP blends and ternary nanocomposites.
Table 2. Tensile mechanical properties and notched Charpy impact strength of PP and PP blends and nanocomposites
Material Young’s modulus, E (MPa) Yield strength, 𝜎Y(MPa) Toughness, W (N mm) Impact strength (kJ m−2) PP 1357 ± 31 39.8 ± 0.5 1272 ± 101 2.9 ± 0.1 PP-3M 1191 ± 57 35.8 ± 0.7 695 ± 33 4.9 ± 0.8 PP-9SMA 1117 ± 33 31.7 ± 1.0 1893 ± 164 6.7 ± 0.8 PP-9PEO 1110 ± 17 30.3 ± 0.2 2550 ± 212 6.9 ± 0.2 3M-9SMA 1010 ± 49 29.8 ± 0.7 1311 ± 14 5.3 ± 0.5 3M-9PEO 1106 ± 17 29.9 ± 0.2 2052 ± 215 8.5 ± 0.1
due to hydrophilic surface of unmodified MMT clay. On the other hand, PP blends (PP-9SMA and PP-9PEO) were found to have much higher toughness values with lower moduli than neat PP. Particu-larly, PP-9PEO showed the highest toughness among the materi-als, as a result of its flexible PEO blocks. The fibrillar type structures of PP-9SMA and PP-9PEO blends (Fig. 8) confirm their enhanced toughness due to their breakage after a yield point.
Among the ternary nanocomposites, using 3% MMT clay in 3M-9SMA resulted in decreased tensile modulus, yield strength and toughness values as compared to PP-9SMA blend. This may be attributed to large clay aggregates in 3M-9SMA (Fig. 8) act-ing as stress concentrators and reducact-ing the surface area for PP-MMT matrix interfacial adhesion.26 This weak interaction is
also highly consistent with the XRD result and TEM image of the same nanocomposite (Figs 5 and 6) showing less expansion of the clay layers. On the other hand, 3M-9PEO nanocompos-ite was found to have slightly lower toughness than PP-9PEO blend with acceptable modulus and yield strength which can be due to strengthened elastomer particles via MMT layers, limiting their flexibilities. Nevertheless, it has much higher toughness than 3M-9SMA and PP-9SMA blends as well as pure PP. The tough-ness enhancement for 3M-9PEO nanocomposite with a higher tensile modulus, as compared to 3M-9SMA, can be explained by
inhibited interactions of SEBS-g-PEO-coated MMT clay layers via help of PEO molecules. This may occur most probably due to the presence of much more hydrogen bonding/dipole–dipole inter-actions of hydroxyl groups of silicate layers and PEO blocks of the SEBS-g-PEO compatibilizer. This result is also in agreement with higher expansion of clay layers (Figs 5 and 6) and greater num-ber of smaller-sized elastomeric particles dispersed in intercalated SEBS-g-PEO nanocomposite (Fig. 7). Moreover, it is evident from Fig. 8 that the 3M-9PEO nanocomposite exhibited a fibrillar struc-ture with an extensive deformation like the PP-9PEO blend. This is an indication of confirmation of the presence of a better interfacial adhesion between PP matrix and MMT with help of the SEBS-g-PEO compatibilizer.
Also, the improvement in toughness for 3M-9PEO may be ascribed to the possible formation of a co-core–shell structure in which the inner core is composed of layered silicates as reinforcers. The inner core may be covered by flexible PEO compatibilizer molecules as co-core with special groups interacting with the particles. This outside core may be surrounded by thermoplastic elastomer SEBS toughener unit as shell exhibiting compatibility with the PP matrix. Similar core–shell rubber particles have been reported to be responsible for increases in toughness of various polymers.27,28
Table 2 also presents Charpy impact strengths of PP and PP blends and nanocomposites. It is clear that all the blends and nanocomposites showed higher impact resistance than neat PP matrix. The impact strengths of PP-9SMA and PP-9PEO blends exhibited an increase of about 130% compared to pure PP, with about the same values. This is due to the absorption of the impact energy of the elastomer particles which are in the dispersed phase in the matrix. The nanocomposite 3M-9SMA was found to have a 77% increase in impact strength compared with pure PP. The MMT clay that cannot disperse in this nanocomposite and maintains its agglomerate presence (Fig. 8) may have caused this situation. On the other hand, the maximum enhancement in impact strength was obtained for 3M-9PEO nanocomposite (almost 188%) with higher modulus, yield strength and toughness than 3M-9SMA, showing the effect of the PEO grafting. This result is in good accord
1451
Figure 8. SEM images of tensile fracture surfaces of PP blends and nanocomposites.Figure 9. SEM images of impact-fractured surfaces of 3M-9SMA and 3M-9PEO ternary nanocomposites. with corresponding toughness values and can be ascribed to
strong interaction of MMT clay layers with SEBS-based elastomeric phase and also their better dispersion in the matrix (Fig. 6) when PEO block is present.
Figure 9 shows SEM images of impact-fractured surfaces of the ternary nanocomposites 3M-9SMA and 3M-9PEO. In the image of 3M-9PEO, there are much smaller SEBS domains and smaller cavities left behind after elastomer debonding. The small-sized elastomer phase distribution is likely to originate from the MMT nanoclay, as mentioned earlier, which may exhibit a more homo-geneous distribution with the help of PEO molecules. Moreover, the small size of elastomeric particles give them higher surface area contributing to the distribution of the sudden impact energy applied by reinforcing the matrix of clay plates and cause more
local plastic deformation of PP which is an indication of the high impact strength.29
From the results of static mechanical tests, it can be concluded that among the nanocomposites, the highest impact strength and toughness are obtained when SEBS-g-PEO elastomeric compatibi-lizer is used together with 3% MMT clay even in unmodified form in 3M-9PEO. This nanocomposite with modulus and strength values can be accepted to have a good balance between stiffness and toughness/impact strength.
Dynamic mechanical properties of nanocomposites
The effects of SEBS-based elastomeric compatibilizers on the dynamic mechanical properties of materials were studied using
1452
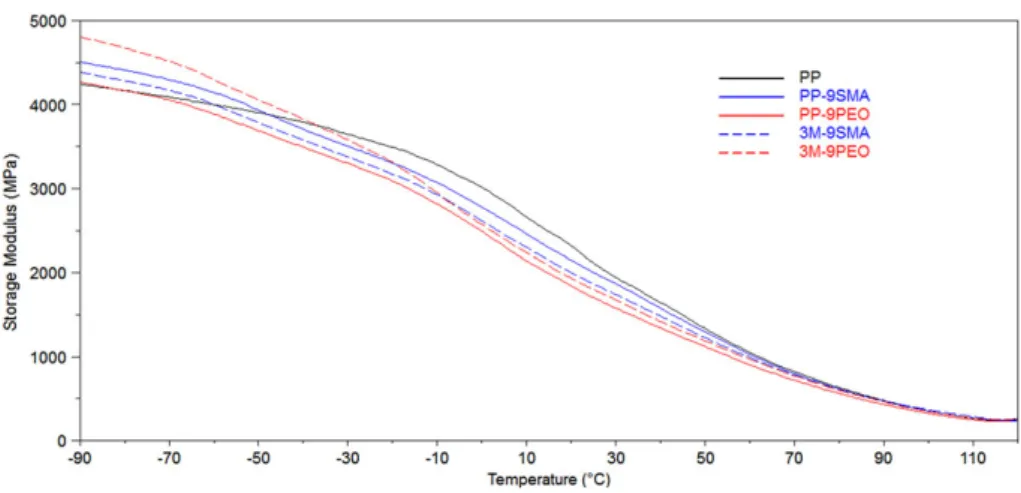
Figure 10. Storage modulus versus temperature plots of PP and PP blends and ternary nanocomposites.
Figure 11. Tan𝛿 versus temperature plots of PP and PP blends and ternary nanocomposites. single cantilever bending mode. The storage modulus versus
temperature and the damping parameter (tan𝛿) versus temper-ature graphs of the samples are presented in Figs 10 and 11, respectively. The DMA data are summarized in Table 3.
As can be seen from Fig. 10, the blends and the nanocompos-ites with higher storage moduli than pure PP exhibit a mod-ulus reduction at lower temperatures due to their elastomeric content as compared to pure PP. Lower storage modulus values were obtained for PP-9PEO as compared to PP-PSMA which is most probably due to the effect of PEO chains having lower Tg
(about −65 ∘C)15than the ethylene–butylene block. The decrease
in the modulus may also be ascribed to greater number of smaller sized SEBS domains of SEBS-g-PEO (Fig. 7) as well proven by Price et al. in their studies focusing on the size dependence of elasticity.30
The 3M-9SMA nanocomposite containing 3% NaMMT shows lower storage modulus values than its corresponding blend (PP-9SMA) at all temperatures. This may be explained by the fact that the NaMMT clay is dispersed as primary particles in the 3M-9SMA composite (Fig. 8) and does not show a good disper-sion, thus not achieving the desired mechanical reinforcement. The 3M-9PEO nanocomposite exhibits higher storage modulus than pure PP, 3M-9SMA and the blends at −50 ∘C (Fig. 10 and Table 3). This can be due to the NaMMT clay exhibiting some exfoliation/intercalation-based dispersion in predominantly inter-calated nanocomposite structure when SEBS-g-PEO is used (Fig. 6), reinforcing PP more effectively with a larger surface area of the clay
Table 3. Dynamic mechanical properties of PP and PP blends and nanocompositesa Material E′ −50∘C (MPa) Tan𝛿−50∘C E′ 25∘C (MPa) Tan𝛿25∘C PP 3900 0.021 2114 0.047 PP-3M 4408 0.021 2255 0.041 PP-9SMA 3933 0.027 2000 0.040 PP-9PEO 3686 0.027 1705 0.050 3M-9SMA 3785 0.028 1865 0.044 3M-9PEO 4053 0.028 1802 0.050 aE′
−50∘C and E′25∘C: storage moduli at −50 and +25 ∘C,
respec-tively; tan𝛿−50∘Cand tan𝛿25∘C: damping factors at −50 and +25 ∘C,
respectively.
interacting with the matrix. Although the PP-3M binary system has the highest storage modulus at −50 ∘C and at higher temperature, its damping value was found to be the same as that of pure PP and much lower compared to other samples (Table 3). This can be safely ascribed to the presence of large aggregates of the MMT clay (Fig. 8) and lack of elastomeric phase in the composite.
All of the materials prepared, except PP-3M, have higher damp-ing abilities with higher tan𝛿 peak heights than pure PP at low temperature (−50 ∘C) (Fig. 11 and Table 3). The ethylene–butylene blocks of PP-9SMA and PP-9PEO blends are believed to move at
1453
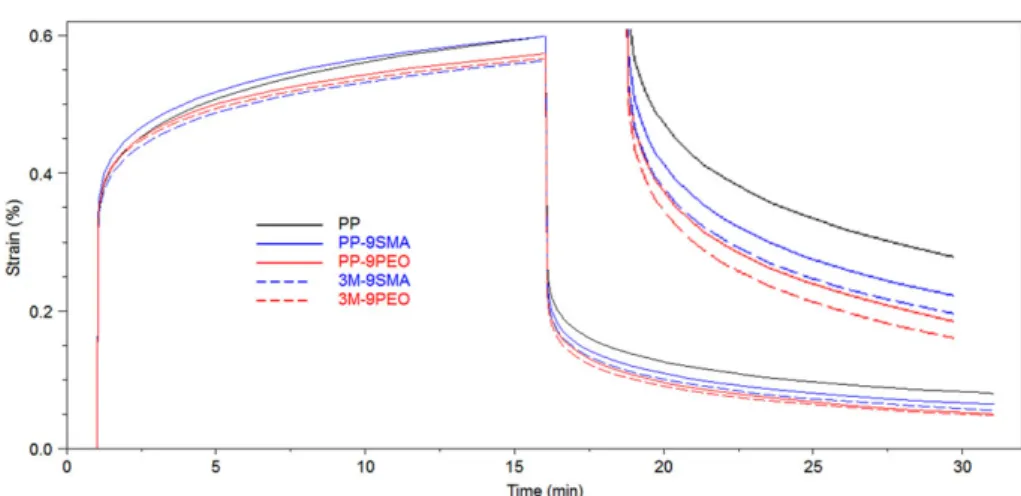
Figure 12. Creep strain of PP and PP blends and ternary nanocomposites as a function of time (T = 30 ∘C,𝜎0= 5 MPa).their Tgpassing to rubbery phase and so achieve higher damping
than neat PP.11Moreover, 3M-9SMA and 3M-9PEO
nanocompos-ites were found to exhibit higher damping abilities with their higher peak heights than the blend materials and pure PP. This result can be attributed to the nanocomposites being able to convert mechanical energy to heat energy more efficiently by friction between nanoclay layers and that between clay–polymer molecules.31 The highest broadening in the damping peak
and lower damping onset temperature were observed for the 3M-9PEO nanocomposite which can be attributed to presence of additional PEO blocks leading to higher abovementioned frictions.
The storage moduli of the blends and their ternary nanocom-posites are lower at higher temperatures than that of PP (Fig. 10 and Table 3) due to the elastomeric property of the included SEBS phase reducing the stiffness of the materials. The ternary nanocomposite 3M-9SMA was found to exhibit lower modulus val-ues at high temperatures than the PP-SMA blend, as for the case at low temperatures. This may be possible due to its heteroge-neous/insufficient clay dispersion (Figs 5, 6 and 8). Even though the PP-9PEO and 3M-9PEO samples show a greater decrease in modulus at higher temperatures, the nanocomposite 3M-9PEO exhibited a higher storage modulus than its PP-9PEO blend (Fig. 10 and Table 3) unlike the nanocomposite 3M-9SMA. This can be ascribed to more homogeneously dispersed MMT layers (Figs 5, 6 and 8) via help of PEO molecules, which reinforce the polymer molecules effectively. This is also an indication of good interaction between PEO molecules and MMT clay layers when SEBS-g-PEO is used as elastomeric compatibilizer instead of SEBS-g-MA.
The damping parameter values (tan𝛿) at higher temperatures, particularly at Tgof PP (about 8 ∘C), were found to be much higher
for PP-9PEO and 3M-9PEO as a result of the presence of PEO blocks in comparison with neat PP and other samples (Fig. 11 and Table 3). This result can be attributed to the presence of flexible PEO molecules and much higher friction occurring between PEO and MMT clay layers, that of PEO molecules with themselves and that of the clay layers with themselves. This causes absorption of mechan-ical energy much more at the glass transition region of PP.31The
smaller sized elastomeric domains obtained by more homoge-neously dispersed MMT clay layers may also result in larger surface area for friction of the polymer molecules. On the other hand, tan𝛿 values of PP-9SMA and 3M-9SMA at high temperatures were found to be lower than that of pure PP (Table 3 and Fig. 11). The reason for higher damping of 3M-9SMA as compared to its PP-9SMA blend
can be explained by the aforementioned clay-induced friction.31
Moreover, the damping onset temperatures of the 3M-9SMA and 3M-9PEO nanocomposites were found to be lower than that of PP matrix at around its Tg. Also, they damp in a broader range of
tem-perature at around Tg. This result can be ascribed to greater friction
of the PEO and the ethylene–butylene blocks as plasticizers with PP molecules and MMT clay layers.11
The optimized balance between damping and dynamic mod-ulus established for the 3M-9PEO nanocomposite system is in a good agreement with one obtained for static mechanical proper-ties as in strength and toughness/impact resistance. Therefore, the SEBS-g-PEO elastomeric compatibilizer seems to be more advan-tageous in terms of interaction of the clay layers and toughening capability for PP matrix, as compared to SEBS-g-MA.
Creep behaviour of nanocomposites
The effects of the compatibilizers on the creep behaviour of the blends and ternary nanocomposites were analysed using short-time isothermal creep testing. Both creep strain and creep recovery curves as a function of time are shown in in Fig. 12 and the related data are presented in Table 4. As seen in Fig. 12, the PP-9PEO blend exhibited lower creep deformation, lower per-manent deformation and higher creep recovery rate than both pure PP and PP-9SMA blend. This can be due to decreased molecular mobility caused by possible dipole–dipole interactions between PEO molecules and dipole–dipole/hydrogen bonding interactions between PEO molecules and MA and the acid groups formed with the grafting reaction. Among the ternary nanocom-posites, although 3M-9SMA exhibits relatively low creep defor-mation, it has higher permanent deformation and lower creep recovery rate than PP-9PEO and 3M-9PEO materials. This result may be due to inadequate clay distribution and clay aggre-gates in the 3M-9SMA composite (Fig. 8), reducing its elastic character.
The 3M-9PEO nanocomposite was found to have a slightly lower creep strain, as compared to 3M-9SMA, which may be ascribed to enhanced toughening/damping effect (Table 2, Fig. 11 and Table 3) of the PEO grafting. On the other hand, 3M-9PEO showed a faster creep recovery rate together with a lower permanent deformation than neat PP, both blends and 3M-9SMA ternary nanocomposite (Table 4). The reason for this can be attributed to increased elastic character with much higher expansion of MMT clay layers leading to a maximized interaction with polymer molecules (Figs 5 and 6).
1454
Table 4. Viscoelastic creep deformation data of PP and PP blends and nanocomposites
Material Creep straina(%)
Permanent deformationb(%) PP 0.599 0.080 PP-3M 0.496 0.048 PP-9SMA 0.600 0.064 PP-9PEO 0.598 0.060 3M-9SMA 0.563 0.056 3M-9PEO 0.568 0.050
aViscolelastic creep strain at 15 min.
bPermanent deformation at 15 min after removal of stress.
Contact angle measurements
Dyeability of PP thermoplastic is a problem due to its highly crystalline morphology and nonpolar structure, restricting the diffusion/coating of dye molecules onto the polymer surface. This disadvantage limits its use in related applications like pro-duction of carpets, automotive interior parts, geotextiles and so on.32,33In order to achieve dyeable PP surfaces, various methods
such as blending with polar group-containing polymers,34–37
copolymerization,38 plasma surface treatment,39 use of pigment
masterbatch40 and others have been reported in the
litera-ture. Another method is to introduce nanoparticles into the PP matrix.41,42
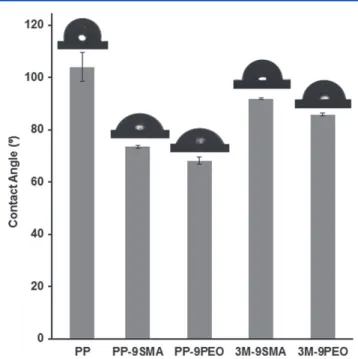
In our study, the water contact angles on the surfaces of neat PP, blends and ternary nanocomposites were measured to provide information about the surface wettability. The hydrophilicity or hydrophobicity of PP-containing materials is a fundamental key for their abovementioned dyeability applications.36,43–45Figure 13
shows variation of water contact angles of neat PP and PP blends and nanocomposites. As can be seen, PP has a water contact angle of about 104∘ whereas all the PP blends and nanocomposites exhibited lower contact angles than neat PP. The decrease in contact angle of neat PP can be ascribed to the presence of polar MA and PEO groups as well as MMT clay layers in the blends and nanocomposites. It seems that PEO grafting causes a further decrease in the contact angle making the surface more hydrophilic in both blend and nanocomposite. The lowest contact angle was achieved for the PP-9PEO blend (68.17∘) having anhydride, PEO and carboxylic acid groups, which resulted from grafting reaction, having more capability for hydrogen bonding and leading to a more hydrophilic surface.
CONCLUSIONS
In this study, PEO molecules were successfully grafted on SEBS-g-MA elastomer. The obtained new elastomeric compat-ibilizer was used to prepare PP/SEBS-g-PEO/MMT nanocom-posite and its properties were compared with those of PP/SEBS-g-MA/MMT composite. XRD and TEM analyses showed that the intercalation of MMT clay layers increased more in the presence of PEO molecules. The nanocomposite prepared with SEBS-g-PEO (3M-9PEO) exhibited higher damping than that pre-pared with SEBS-g-MA for the same temperature range together with a lower permanent deformation in the creep test. The tensile toughness, modulus and impact resistance of the nanocom-posite 3M-9PEO were found to be higher as compared to the nanocomposite having SEBS-g-MA elastomer with the same yield
Figure 13. Contact angles of PP and PP blends and nanocomposites. strength. The same nanocomposite also showed an increase in toughness and impact strength of about 61 and 188%, respec-tively, compared to pure PP. In addition, the grafting of the polar and hydrophilic PEO molecules onto the SEBS reduced the water contact angles which can be due to increased hydrophilicity and, in turn, increased wettability of the highly hydrophobic PP in the prepared blend and nanocomposite. This makes the nanocom-posite advantageous for dyeability processes in which PP alone suffers from limitations.
ACKNOWLEDGEMENTS
Support given by Scientific Research Projects Coordination Departments of Yalova University (project no. 2017/DR/0003) is gratefully acknowledged.
REFERENCES
1 Ishak ZM, Chow W and Takeichi T, Eur Polym J 44:1023–1039 (2008). 2 Tjong S and Meng Y, J Polym Sci B 41:2332–2341 (2003).
3 Wang X-f, Yang C-j, Yang J-h, Wang Y and Zhang J-h, Composites A
90:200–210 (2016).
4 González I, Eguiazábal JI and Nazabal J, Composites A 43:1482–1489 (2012).
5 Ignaczak W, Sui X, Kellersztein I, Wagner HD and El Fray M, Polym Int
67:414–421 (2018).
6 Daniel DJ and Panneerselvam K, J Compos Mater 52:1833–1843 (2017). 7 Nakhaei MR, Mostafapour A and Naderi G, Polym Compos 38:421–432
(2017).
8 Lim JW, Hassan A, Rahmat AR and Wahit MU, Polym Int 55:204–215 (2006).
9 Tekay E, Nugay N, Nugay T and ¸Sen S, Polym Compos (2017). https://doi .org/10.1002/pc.24592.
10 Bagcioglu C, Altuntas E, ¸Sen S, Bora ˙Islier M, Ersoy OG, Ersoy N et al.,
Polym Int 57:1395–1403 (2008).
11 Ishak ZM, Chow W and Takeichi T, Composites A 39:1802–1814 (2008). 12 Zhu S, Chen J and Li H, Polym Bull 63:245–257 (2009).
13 Aranda P and Ruiz-Hitzky E, Appl Clay Sci 15:119–135 (1999). 14 Zhu S, Chen J, Li H, Cao Y, Yang Y and Feng Z, Appl Clay Sci 87:303–310
(2014).
15 Gournis D and Floudas G, Chem Mater 16:1686–1692 (2004). 16 Hou S-S, Bonagamba T, Beyer F, Madison P and Schmidt-Rohr K,
1455
17 Wu C-S and Liao H-T, Polymer 48:4449–4458 (2007).
18 Abbas A, Hussain MA, Amin M, Tahir MN, Jantan I, Hameed A et al., RSC
Adv 5:43440–43448 (2015).
19 Mahou R and Wandrey C, Polymers 4:561–589 (2012).
20 Hu L, Stevanovic T and Rodrigue D, J Appl Polym Sci 131:4140 (2014). 21 Phua Y, Chow W and Mohd Ishak Z, Express Polym Lett 7:340–354
(2013).
22 Passaglia E, Ghetti S, Picchioni F and Ruggeri G, Polymer 41:4389–4400 (2000).
23 Kennedy JE and Higginbotham CL, Synthesis and characterisation of styrene butadiene styrene based grafted copolymers for use in potential biomedical applications, in Biomedical Engineering, Trends
in Materials Science, ed. by Laskovski A. InTech, Rijeka, pp. 465–488
(2011).
24 Sierra C, Galan C, Fatou J, Parellada M and Barrio J, Polymer
38:4325–4335 (1997).
25 Li S, Rashkov I, Espartero J, Manolova N and Vert M, Macromolecules
29:57–62 (1996).
26 Balakrishnan S, Start P, Raghavan D and Hudson SD, Polymer
46:11255–11262 (2005).
27 Garg AC and Mai Y-W, Compos Sci Technol 31:179–223 (1988). 28 Gam K, Miyamoto M, Nishimura R and Sue H, Polym Eng Sci
43:1635–1645 (2003).
29 Ajayan PM, Schadler LS, Giannaris C and Rubio A, Adv Mater
12:750–753 (2000).
30 Price WJ, Leigh SA, Hsu SM, Patten TE and Liu G-y, J Phys Chem A
110:1382–1388 (2006).
31 Weibo H and Fengchang Z, J Appl Polym Sci 50:277–283 (1993). 32 Yigit EA and Teker M, Polym Polym Compos 19:711 (2011).
33 Zhang S, Horrocks AR, Hull R and Kandola BK, Polym Degrad Stab
91:719–725 (2006).
34 Teli M, Adivarekar R, Ramani V and Sabale A, Fibers Polym 5:264–269 (2004).
35 Kotek R, Afshari M, Gupta BS, Kish MH and Jung D, Color Technol
120:26–29 (2004).
36 Ujhelyiova A, Bolhova E, Oravkinova J, Ti ˇno R and Marcinˇcin A, Dyes
Pigm 72:212–216 (2007).
37 Seves A, Testa G, Marcandalli B, Bergamasco L, Munaretto G and Beltrame P, Dyes Pigm 35:367–373 (1997).
38 Gupta B and Plessier C, J Appl Polym Sci73:2293–2297 (1999).
39 Yaman N, Özdo ˘gan E, Seventekin N and Ayhan H, Appl Surf Sci
255:6764– 6770 (2009).
40 Mirjalili F, Moradian S and Ameri F, Sci World J 2013:1–9 (2013). 41 Mani G, Fan Q, Ugbolue SC and Eiff IM, AATCC Rev 3:22–26
(2003).
42 Fan Q, John J, Ugbolue SC, Wilson AR, Dar YS and Yang Y, AATCC Rev
3:25–28 (2003).
43 Razafimahefa L, Chlebicki S, Vroman I and Devaux E, Color Technol
124:86–91 (2008).
44 Marcincin A, Ujhelyiova A and Marcincinova T, Macromol Symp
176:65–72 (2001).
45 Si X, Guo L, Wang Y and Lau K-t, Compos Sci Technol 68:2943–2947 (2008).