Parametrically coupled multiharmonic force imaging
M. Kurtuluş Abak, Ozan Aktas, Rashad Mammadov, İhsan Gürsel, and Aykutlu Dâna
Citation: Appl. Phys. Lett. 92, 223113 (2008); View online: https://doi.org/10.1063/1.2940304
View Table of Contents: http://aip.scitation.org/toc/apl/92/22 Published by the American Institute of Physics
Parametrically coupled multiharmonic force imaging
M. Kurtuluş Abak,1 Ozan Aktas,2 Rashad Mammadov,1 İhsan Gürsel,1,3 and Aykutlu Dâna1,a兲
1
Institute of Materials Science and Nanotechnology, Bilkent University, 06800 Ankara, Turkey 2
Department of Physics, Bilkent University, 06800 Ankara, Turkey 3
Department of Molecular Biology and Genetics, Bilkent University, 06800 Ankara, Turkey
共Received 19 February 2008; accepted 16 May 2008; published online 6 June 2008兲
We report use of nonlinear tip-sample interactions to parametrically convert the frequency components of periodic tip-sample interaction forces to frequencies where they can be resonantly detected. One flexural mode of a cantilever is used for tapping-mode imaging and another flexural mode is used for detection of forces converted in presence of an externally injected mechanical oscillation at the difference frequency of the detecting mode and a harmonic of the tapping mode. Material contrast in attractive and repulsive regimes are demonstrated on samples with polymethyl methacrylate patterns and with deoxyribonucleic acid strands on silicon. © 2008 American Institute
of Physics. 关DOI:10.1063/1.2940304兴
Measurement and imaging of material dependent nonlin-ear tip-sample interactions in atomic force microscopy1 共AFM兲 provides information about the structure of the sample on the nanoscale. In the conventional tapping mode, a single mode of the cantilever is used to resonantly detect the fundamental frequency component of the time varying interaction force, which is observed in the perturbations of the amplitude and phase of the oscillation.2 This selective measurement filters out higher harmonics of the interaction force and results in loss of information and material contrast is observed in dissipation related phase changes in the oscillation.3–5 Although excitation of the higher frequency harmonics can be strongly related to material elasticity they are not detected in conventional tapping mode.6 The main reason for this is, for a rectangular cantilever, higher order mode frequencies are not integer multiples of the fundamen-tal mode frequency.7–11 Several authors have addressed the problem of measuring the complete tip-sample interaction during tapping using special modifications to the cantilever or the scanning probe electronics.12,13 Multifrequency exci-tation of the cantilever simultaneously at the two flexural resonances has also been demonstrated to give complemen-tary material contrast.14,15
In this article, the highly nonlinear tip-sample interaction is used to convert the frequency components of the interac-tion force generated during tapping to a frequency that can be resonantly measured. Both parametric up-conversion 共PUC兲 and down-conversion 共PDC兲 schemes can be imple-mented. One of the flexural modes is used in tapping mode imaging while a sinusoidal mechanical signal is applied at the difference frequency of the force component to be mea-sured and the mode frequency to be used for detection. The frequency-converted force components are then resonantly detected using a lock-in amplifier. Frequency conversion ef-ficiency is also related to the mechanical properties of the sample, therefore the conversion process itself also results in material contrast.
In the experiments different commercial AFM systems 共PSIA XE100 retrofitted with a homemade vibrating sample holder and an Asylum MFP 3D system fitted with an external
circuit for multifrequency excitation兲 are used. One of the flexural harmonics is used in tapping mode by the AFM con-troller and the ac deflection of the other flexural mode is detected using a rf lock-in amplifier共model SR844兲. Com-mercial rectangular AFM cantilevers are used. Typical mea-sured mode resonant frequencies are f0= 68– 80 KHz, f1 = 410– 500 KHz, and nominal spring constants are k0 = 2.7 N/m, k1=共f1/ f0兲2k0= 99.3 N/m. Typical quality factors of the fundamental and second order flexural modes are de-termined to be Q0⯝200 and Q1⯝500. Supplier specified tip radius is R = 15 nm. Deflection detection noise floor of the AFM systems used are xmin⬃2⫻10−13m/
冑
Hz and resonant force measurements are Brownian motion limited. In PUC experiments, the fundamental mode is driven with an ampli-tude A0⯝10 nm at a frequency f0⬘
= f0−⌬f, and a local oscil-lator vibration with amplitude ALO⯝1 nm is applied either by vibrating the tip or the sample at a frequency fLO. The result of the mixing is monitored at f1. Repulsive or attrac-tive branches of the tip-sample interaction can be chosen by selecting a sufficiently large positive or negative frequency offset ⌬f.16 The parametrically excited second order mode amplitudes A1 as a function of the tip-sample separationzts are plotted in Figs. 1共b兲–1共d兲 for fLO= f1− nf0
⬘
where n = 1 , 3 , 6 共other n not shown for figure clarity兲. The PUCprocess is seen to depend on local oscillator amplitude ALO 关Fig.1共e兲兴. In the down-conversion process, the second order flexural mode is used in tapping and lever vibration is moni-tored at a frequency fⴱ= f1
⬘
− fLO. Since the fundamental mode spring constant k0 is smaller compared to the higher order mode spring constant k1, resonant frequency shift of the fun-damental mode is more pronounced关Fig.1共f兲兴. For resonant detection of PDC signal, fLO was carefully chosen to coin-cide the PDC signal with the shifted fundamental mode reso-nance frequency f0⬘
关Fig.1共g兲兴. However, nonresonant detec-tion of PDC signal is also possible, at the expense of increased ALO 关Fig. 1共h兲兴. In all cases, in order to avoid jumping between attractive and repulsive regimes, ALOmust be kept adequately small. For certain set of parameters, in-stabilities are observed for very large ALO 共⬎5 nm兲 and in some cases increased stability was observed with increasingALO, possibly due to dithering effects.17The noise spectrum a兲Electronic mail: [email protected].
APPLIED PHYSICS LETTERS 92, 223113共2008兲
of the phase signal was observed before measurements to ensure stability.
In order to understand the parametric conversion of force harmonics, we use numerical analysis. The cantilever dy-namics can be modeled using lumped independent harmonic oscillators for different flexural modes. The resonant fre-quency shift of the cantilever mode is given by18
␦f共zts兲 = f2 kA
冕
01/f
Fts关zts+ Acos共2ft兲兴cos共2ft兲dt, 共1兲 where Ftsis the tip-sample interaction force, A is the ampli-tude of oscillation, k is the lumped spring constant, and f is the resonant frequency. When the cantilever is driven by a fixed amplitude sinusoidal force Fd共t兲=Fdcos共2fdt兲 at fre-quency fd, the complex oscillation amplitude A˜ can be cal-culated through A ˜共兲 = h共兲Fd=⌺nFd kn 1 共1 −2/ r,n 2 兲 + i/ r,nQn , 共2兲
where=d= 2fd is the drive frequency, Fdis the driving force amplitude, Qn is the effective quality factor, and
r,n= 2共fn+␦fn兲 is the resonance frequency of the mode n perturbed by the sample interaction. The nonlinear tip-sample interaction can be modeled using a piecewise description.16In this approach the interaction force F共zts兲 can be described in terms of tip and sample elastic moduli and tip radius as a function of tip-sample separation zts. For the sake of simplicity the nonconservative effects are ignored. For
A0⯝10 nm and ALO⬍1 nm, and assuming that the resulting oscillations at frequencies other than fLOand fd⬇ f0are also smaller than 0.1 nm, the time-dependent tip-sample separa-tion zts共t兲 can be approximated as
zts共t兲 = z0+ ALOcos共2fLOt兲 + A0cos共2fdt兲, 共3兲 where z0 is the average tip-sample separation. In order to calculate A0at a given tip-sample separation, Eqs.共1兲and共2兲 are solved iteratively for A˜ for a given set of parameters and the proper solution is selected. In the analysis, we make the approximation that ALO, A1ⰆA0, and higher order parametric processes are ignored共i.e., parametric mixing happens only once兲. Using Eq. 共3兲 and the interaction model, a time-dependent interaction force F共t兲 can be calculated. The har-monic component of F共t兲 at frequency can be calculated by F=兰F共t兲exp共−it兲dt. The amplitude of oscillation of the
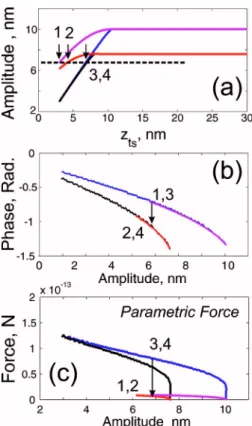
cantilever can be then calculated through Eq.共2兲. Using the described approach, A0 versus z0 关Fig.2共a兲兴 and
parametri-cally converted force amplitude F1versus A0关Fig.2共c兲兴 are calculated where curves are plotted for silicon共Si兲, and poly-styrene共PS兲 surfaces. PS is chosen as an example soft ma-terial. Since dissipative interactions were not explicitly in-cluded in the simulations, in order to observe the effect of dissipation, the calculations are repeated with Q factors of 200 and 150. In tapping mode, feedback fixes A0. Therefore, to compare material contrast observed in different channels for a given A0 set point, we label the equilibrium points as 1⬟共PS, Q=200兲, 2⬟共PS, Q=150兲, 3⬟共Si, Q=200兲, and 4⬟共Si, Q=150兲, respectively. Conventional phase contrast of the tapping mode is seen to depend only on dissipation, as seen in Fig.2共b兲. However, parametrically converted forces 关Fig.2共c兲兴 show elasticity dependent contrast.
In order to demonstrate that the material dependent con-trast can be imaged using the PUC/PDC processes, images were obtained on polymethyl methacrylate共PMMA兲 patterns FIG. 1.共Color online兲 Excitation of the second order mode through
para-metric mode coupling as a function of tip-sample separation during tapping with the fundamental mode in attractive regime. The sample is 100 nm thick PMMA on silicon.共a兲 Typical force-distance and amplitude-distance curves acquired simultaneously with the PUC measurements. Second order mode amplitude A1when共b兲 fLO= f1− fd,共c兲 fLO= f1− 3fd, and共d兲 fLO= f1− 6fd.共e兲
Parametrically up-converted amplitude A1increases with increasing LO am-plitude ALO.共f兲 Perturbation of the dynamic properties of the fundamental mode is observed in the noise spectrum of the cantilever deflection signal when the second mode is tapping in attractive共left arrow兲 and repulsive modes共right arrow兲 and away from the surface 共middle arrow兲. 共g兲 Para-metrically down-converted signal at the shifted fundamental mode reso-nance frequency during tapping with higher order flexural mode. As ALOis increased parametrically down-converted signal amplitude increases. 共h兲 Parametrically down-converted signal to 30 KHz共nonresonant兲.
FIG. 2. 共Color online兲 Simulation results for PUC process in the repulsive regime while fundamental mode is used for tapping and second order mode is used for detection.共a兲 Amplitude vs zts for si and PS samples for Q0 = 200 and 150.共b兲 Phase vs A0shows dissipation contrast.共c兲 Parametrically up-converted force amplitude calculated for ALO= 0.2 nm and fLO= f1− f0⬘vs
A0shows that contrast is dominated by elasticity of sample.
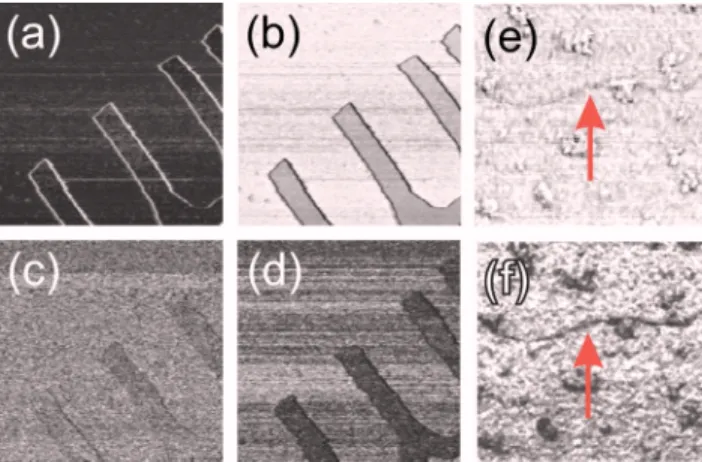
on silicon 关Fig.3共a兲–3共d兲兴 and on plasmid DNA strands on
silicon 关Figs. 3共e兲 and 3共f兲兴. On large PMMA patterns on silicon, in the attractive regime where there is little dissipa-tion, PUC contrast is observed for the conversion of funda-mental and third harmonics关Figs.3共b兲and3共d兲兴 even when there is no significant phase contrast关Fig.3共a兲兴. The absence
of dissipation is also directly observed in the low contrast of Fig.3共c兲, where the second harmonic of the interaction force is monitored. In the attractive regime, simulations show re-duced parametric generation. Therefore, in order to observe the contrast, considerably larger 共about a nanometer兲 ALO was used. In order to demonstrate applicability of the tech-nique to biological molecules, a sample with DNA strands on silicon was imaged using the second order flexural mode for tapping and using PDC. In this case, repulsive mode is easier to obtain and elasticity dependent PDC contrast can be ob-served. The observed contrast is parallel with theoretical pre-dictions of Fig.2共c兲, where increasing sample modulus re-sults in increased parametric conversion. It was also observed that 共data not shown兲 increasing ALO or using a much lower amplitude set point results in destruction of iso-lated DNA strands due to increased peak interaction forces. Simulations show that for standard cantilevers, the interac-tion pressures are large enough to disturb the molecule’s structural integrity. Therefore the technique is applicable for
molecular imaging but care must be given to keep the peak forces low.
The method presented here can be applied using a stan-dard rectangular cantilever and a stanstan-dard AFM system with a vibrating sample holder or an AFM system that allows access to the lever dither piezo by external electronics. In multifrequency excitation through the cantilever dither piezo, the oscillation amplitudes are determined by the lever trans-fer function, and imaging the fifth harmonic of the force was seen to be most convenient using the PUC process due to enhanced intermediate frequency excitation. Elasticity de-pendent contrast on molecular level can be observed using a standard cantilever. Further optimization of the cantilever properties can be done to operate the technique with lower interaction forces. The technique presented here can be used to study tip-sample interactions and nanoscale contact me-chanics in greater detail than possible with a standard tping mode AFM. The technique can also potentially be ap-plied for label-free biomolecular detection using integrated micro and nanomechanical devices.
This work was partially funded by Tübitak Grant No. 107T547 and by funding from the State Planning Agency of the Turkish Republic. Aykutlu Dâna thanks Özgür Şahin for enlightening discussions on tip-sample interactions.
1G. Binnig, C. F. Quate, and C. Gerber,Phys. Rev. Lett. 56, 930共1986兲. 2Y. Martin, C. C. Williams, and H. K. Wickramasinghe,J. Appl. Phys. 61,
4723共1987兲.
3J. Tamayo and R. Garcia,Appl. Phys. Lett. 73, 2926共1998兲.
4J. P. Cleveland, B. Anczykowski, A. E. Schmid, and V. B. Elings,Appl.
Phys. Lett. 72, 2613共1998兲.
5R. W. Stark, T. Drobek, and W. M. Heckl,Appl. Phys. Lett. 74, 3296 共1999兲.
6R. W. Stark and W. M. Heckl,Surf. Sci. 457, 219共2000兲. 7R. W. Stark and W. M. Heckl,Rev. Sci. Instrum. 74, 5111共2003兲. 8S. Crittenden, A. Raman, and R. Reifenberger,Phys. Rev. B 72, 235422
共2005兲.
9M. Stark, R. W. Stark, W. M. Heckl, and R. Guckenberger,Appl. Phys.
Lett. 77, 3293共2000兲.
10M. Balantekin and A. Atalar,Appl. Phys. Lett. 87, 243513共2005兲. 11M. Balantekin and A. Atalar,Phys. Rev. B 71, 125416共2005兲. 12M. Stark, R. W. Stark, W. M. Heckl, and R. Guckenberger,Proc. Natl.
Acad. Sci. U.S.A. 99, 8473共2002兲.
13O. Sahin, C. F. Quate, O. Solgaard, and A. Atalar, Phys. Rev. B 69, 165416共2004兲.
14N. F. Martinez, S. Patil, J. R. Lozano, and R. Garcia,Appl. Phys. Lett.89, 153115共2006兲.
15J. R. Lozano and R. Garcia,Phys. Rev. Lett. 100, 076102共2008兲. 16R. Garcia and A. San Paulo,Phys. Rev. B 60, 4961共1999兲. 17O. Morgul,Phys. Lett. A 262, 144共1999兲.
18F. J. Giessibl,Appl. Phys. Lett. 78, 123共2001兲. FIG. 3. 共Color online兲 Material contrast observed through PUC in the
at-tractive regime on PMMA patterns on silicon.共a兲 Phase contrast image. 共b兲 Parametrically up-converted force detected at the second order mode fre-quency when sample is oscillated at fLO⬇ f1− f0,共c兲 fLO⬇ f1− 2f0, and共d兲
fLO⬇ f1− 3f0. Images acquired with 0.5 Hz per line, 5m image width.共e兲 Material contrast can observed through PDC in the repulsive regime with plasmid DNA strands on silicon: Conventional phase共full scale 30°兲 and 共f兲 PDC signal at 90 KHz. Double strand共arrow兲, curled particles, and bundles of DNA can be discerned. Softer material gives darker signature. Images acquired with 1.5 Hz per line, 0.25m image width.