PATIKA
WEB :A WEB SERVICE FOR
ACCESSING AND VISUALIZING PATHWAY
DATA IN PATIKA DATABASE
a thesis
submitted to the department of computer engineering
and the institute of engineering and science
of bilkent university
in partial fulfillment of the requirements
for the degree of
master of science
By
Emine Zeynep Erson
July, 2005
I certify that I have read this thesis and that in my opinion it is fully adequate, in scope and in quality, as a thesis for the degree of Master of Science.
Asst. Prof. Dr. U˘gur Do˘grus¨oz (Advisor)
I certify that I have read this thesis and that in my opinion it is fully adequate, in scope and in quality, as a thesis for the degree of Master of Science.
Prof. Dr. ¨Ozg¨ur Ulusoy
I certify that I have read this thesis and that in my opinion it is fully adequate, in scope and in quality, as a thesis for the degree of Master of Science.
Assist. Prof. Dr. Uygar Tazebay
Approved for the Institute of Engineering and Science:
Prof. Dr. Mehmet B. Baray Director of the Institute
ABSTRACT
PATIKA
WEB :A WEB SERVICE FOR
ACCESSING AND VISUALIZING PATHWAY
DATA IN PATIKA DATABASE
Emine Zeynep Erson M.S. in Computer Engineering Supervisor: Asst. Prof. Dr. U˘gur Do˘grus¨oz
July, 2005
After completion of Human Genome Project, there has been an exponential in-crease in the available biological data. Although there has been an enormous ef-fort for creating ontologies, standards and tools, current bioinformatics infrastruc-ture is far from coping with this data. The Patika Project aims to provide the community an integrated environment for modeling, analyzing and integrating cellular processes.
Patika project develops software tools providing access, visualization and analysis on the data in Patika database. In this thesis, we present analysis, de-sign and implementation of Patikaweb, a Web-service having a user-friendly in-terface without requiring any registrations, installations. To achieve an enhanced data analysis , Patikaweb provides a multiple-view schema , compartments and compound graphs for visualizing molecular complexes, pathways and black-box reactions.
Querying component supports SQL-like queries and an array of graph-theoretic queries for finding feedback loops, common targets and regulators, or interesting subgraphs based on user’s genes of interest. Constructed models can be saved in XML, exported to standard formats such as BioPAX, SBML or con-verted to static images. A highly interactive and user friendly querying interface is supported with Patikaweb.
Visual representation of complex information in pathway research is very im-portant. The information should be presented with high coverage, while providing a user friendly interface. In this thesis we also present a new approach to visualize complex pathway information coping with the limitations introduced by ontology and graphical representation.
iv
Patikaweb ’s unique visualization and querying features fill an important gap in the pool of currently available tools and databases.
Keywords: Bioinformatics, pathway visualization, complex view management, Web service.
¨
OZET
PATIKA
WEB : PATIKA VER˙ITABANıNDAK˙I YOLAK VER˙IS˙INE ER˙IS¸MEK VE G ¨OR ¨UNT ¨ULEMEK ˙IC¸ ˙IN A ˘G H˙IZMET˙IEmine Zeynep Erson
Bilgisayar M¨uhendisli˘gi, Y¨uksek Lisans Tez Y¨oneticisi: Assist. Prof. Dr. U˘gur Do˘grus¨oz
Temmuz, 2005
˙Insan Genome Proje’sinin tamamlanmasının ardından, biyolojik sistem veri-lerinde ¨ustsel bir artı¸s oldu. Fazla sayıdaki ontoloji, standart ve ara¸c yaratabilme ¸cabalarına ra˘gmen, mevcut biyo-enformatik yapısı bu verilerin karma¸sıklı˘gı ile m¨ucadele etmekten ¸cok uzaktır. Patika Projesi toplulu˘ga h¨ucresel i¸slemleri mod-ellemek, ¸c¨oz¨umlemek ve birle¸stirmek i¸cin t¨umle¸sik bir ortam sa˘glamayı ama¸clar. Patika projesi Patika veritabanındaki veriye ula¸sılmasını, ¸c¨oz¨umlenmesini ve g¨or¨unt¨ulenmesini sa˘glayan yazılım ara¸cları sa˘glamaktadır. Bu tezde, Patikaweb isimli a˘g tabanlı, kullanı¸slı, kayıt, y¨ukleme gerektirmeyen yazılım aracının tasarım ve uygulanmasını sunmaktayız. Geli¸smi¸s veri ¸c¨oz¨umleme olana˘gını sa˘glamak i¸cin, Patikaweb iki seviyede ¸coklu g¨or¨unt¨u olana˘gı, molek¨uler komplekslerin, yolakların ve kara kutu reaksiyonların g¨or¨unt¨ulenmesi i¸cin bile¸sik ¸cizge sa˘glamakta ve kompartmanları desteklemektedir.
Sorgulama bile¸seni, geribildirimli d¨ong¨uleri, ortak hedef ve d¨uzenleyici veya kullanıcının ilgili genine dayalı ilgili alt ¸cizgeleri bulmak i¸cin hem SQL benzeri sorguları hem de ¸cizge kuramsal sorgu dizilerini destekler. Olu¸sturulan mod-eller XML formatında saklanabilir; BioPAX, SBML gibi standart bi¸cimlere ak-tarılabilir veya sabit g¨or¨unt¨ulere ¸cevirilebilir. Patikaweb fazla etkile¸simli ve kullanı¸slı sorgulama aray¨uz¨un¨u destekler.
Yolak ara¸stırmalarında, karma¸sık bilginin g¨orsel olarak g¨osterimi kritik bir rol oynamaktadır. Kullanı¸slı bir aray¨uz olu¸sturmaya ¸calı¸sırken bilgi do˘gru olarak, m¨umk¨un olan en geni¸s kapsamla g¨osterilmelidir. Bu tezde, aynı zamanda karma¸sık yolak bilgisini g¨orselle¸stirmede ontoloji ve ¸cizgesel g¨osterimden kay-naklanan sınırlamalarla m¨ucadele eden yeni bir yakla¸sım sunmaktayız.
Patikaweb’in benzersiz g¨orselle¸stirme ve sorgulama olanakları ile, ¸su anda v
vi
mevcut ara¸clar ve veritabanları havuzunda ¨onemli bir bo¸sluk doldurmaktadır.
Anahtar s¨ozc¨ukler : Biyo-enformatik, yolak g¨orsellenmesi, karma¸sık g¨or¨unt¨u idaresi, a˘g hizmeti.
Acknowledgement
I would like to express my deepest gratitudes to my supervisor Assist. Prof. U˘gur Do˘grus¨oz, for his guidance and feedbacks during the preparation of this thesis. It has been a great experience and privilege for me to work with him and get benefit from his valuable mentorship.
I also would like to thank Prof. Ozg¨¨ ur Ulusoy and Assist. Prof. Uygar Tazebay for reviewing the manuscript of this thesis and spending their valuable time.
During these two years I had the chance to work with a perfect team, Patika team. Friendships and supports of Asli Ayaz, ¨Ozg¨un Babur, Ahmet C¸ etinta¸s, Emek Demir and Erhan Giral were very valuable for me. They are, and will always be, more than friends for me.
Above all, I am very grateful for the endless love and support of my parents Leyla and Metin Erson, and my dearest sister Elif Erson. I feel stronger and happier with their love.
Contents
1 Introduction 1 1.1 Motivation . . . 2 1.2 Background Information . . . 3 2 Related Work 5 2.1 PATIKA Project . . . 8 3 Software System 11 3.1 Problem Statement . . . 11 3.2 PATIKAweb Client . . . 163.2.1 Analysis of Query Facility . . . 16
3.2.2 Analysis of User Interface . . . 16
3.2.3 Detailed Design of PATIKAweb Client . . . . 17
3.3 PATIKAweb Bridge . . . . 22
3.3.1 Analysis of Pathway Data Visualization and Editing . . . . 22
3.3.2 Detailed Design of PATIKAweb Bridge . . . . 27 viii
CONTENTS ix
3.4 PATIKA Server, Data Flow and Communication . . . 40 3.5 Implementation Details . . . 40
4 Conclusions 46
4.1 Contribution . . . 47 4.2 Future Work . . . 48
List of Figures
1.1 Sample pathway: Valine Catabolism, from Patikaweb . . . . 4
2.1 Screenshot from Patikapro . . . . 10
3.1 Modular architecture of Patikaweb . . . 13
3.2 General use cases of Patikaweb . . . . 14
3.3 Editing use cases of Patikaweb . . . . 14
3.4 Deployment diagram of Patikaweb . . . . 15
3.5 User interface of Patikaweb. . . . 18
3.6 Class diagram for query applet . . . 21
3.7 Sequence diagram for a query execution . . . 22
3.8 Abstractions in Holo and Expanded states . . . 25
3.9 Abstractions in Collapsed and Expanded states . . . 26
3.10 Bridge design . . . 28
3.11 Sequence diagram for node deletion in Patikaweb . . . 30
3.12 State-transition diagram of abstractions’ visual states . . . 33 x
LIST OF FIGURES xi
3.13 Design of abstraction view manager . . . 39
3.14 Sequence of expanding a hidden abstraction . . . 39
3.15 Architecture diagram of Patikaweb and their communication scheme . . . 41
3.16 Screenshot for the signed applet jars . . . 44
A.1 Welcome page of Patikaweb . . . 52
A.2 Query applet . . . 52
A.3 Query is in progress . . . 53
A.4 Result report for the submitted query . . . 54
A.5 Result of the query is visualized with the inspector window open for pathway object . . . 55
List of Tables
3.1 Summary of the valid options for all types of abstractions . . . 27 3.2 Programmatic states for abstractions’ visual states . . . 32 3.3 Browser statistics month by month from W3 Schools . . . 45
Chapter 1
Introduction
Bioinformatics, which is a fast evolving field of modern science is defined as the computational analysis and processing of biological information. Roots of bioin-formatics date back to 1950’s, when the DNA structure was discovered by Watson and Crick and the encoding of genetic information for proteins was studied by Gamow [12]. Since then, high-throughput biological experiments caused accumu-lation of information and huge amount of data. Moreover in molecular biology, the discoveries are expressed in natural language rather than mathematical models as in physics. Defining qualitative and quantitative functionalities in molecular level presented computational challenges and that’s how importance of bioinformatics is perceived [3]. Especially after 1990, when different types of high-throughput data became available, analysis of this data and higher order functionalities in cellular processes increased [7]. In parallel to these improvements, data access and analysis problems in molecular biology started to enter the scope of computer science approaches.
An era started in molecular biology, therefore in bioinformatics, when the Genome Project began in 1996. By 2003, 160 genomes were completely se-quenced, and a lot more sequencing projects were in progress. The available data for DNA/protein sequences increased exponentially following these studies. The produced data were stored in databases like GenBank, EMBL (European Molec-ular Biology Laboratory nucleotide sequence database), DDBJ (DNA Data Bank
CHAPTER 1. INTRODUCTION 2
of Japan), PIR (Protein Information Resource) and SWISS-PROT [7]. Although the sequence information is almost completely discovered, functional attributes of genes are not fully understood. In other words, although we have the ingredients, we still do not have the recipe of how an organism functions. Therefore, the next logical step in Human Genome Project is discovering what these sequences mean in terms of their functions and possible interactions [17]. Due to the complexity of the problem, research on perceiving this information requires a different mod-eling approach. Bioinformatics, presenting computer science approaches provides the solution for this problem. Modeling the available data and its representation is one of the essential purposes of bioinformatics. Presenting available informa-tion with heterogeneous meta-data, especially for the funcinforma-tional genomics, is the solution produced by bioinformatics research [17]. A level of abstraction is re-quired to manage and perceive the data. Therefore pathways are used, as the abstraction of molecular and cellular functional events, such as metabolic path-ways and signaling transduction. Next step is to analyze this level of information for more complicated interactions and pathways. Analyzing pathways, brought new problems into consideration such as accessing and visualization of this data in an effective way. We attack this problem in this thesis, with a new software tool named Patikaweb, a promising solution to some of these issues.
1.1
Motivation
Accessing, analyzing and editing available information for metabolic/signaling pathway data became an important research in molecular biology. As new bioin-formatics tools are developed, new requirements are emerged. The Patika project has been developing integrated visual environments for collaborative con-struction and analysis of various cellular pathways. These tools provided very ex-tensive functionalities for data access, analysis and submission/integration. How-ever even for the editing or the creation of a new pathway, the research process requires to access the current available data and analyze this data. Therefore easy access and enhanced analysis techniques like graphical visualization becomes a key step in pathway informatics. When we analyzed the use cases of Patika, we
CHAPTER 1. INTRODUCTION 3
have observed that most frequent use cases are the data access and analysis as opposed to data submission.
Another motivation of this research thesis is related to the preferences of the users about the convenience of the tools. For accessing and analyzing a specific gene or protein and related pathways, researchers do not want to spend time on registering for, downloading and setting up software. With these observations in mind, we have developed an easy-to-access tool Patikaweb, which is a Web based service. Main motivation for this tool is to provide a service to reach the data in Patika database via an extensive querying interface and visualize this data.
1.2
Background Information
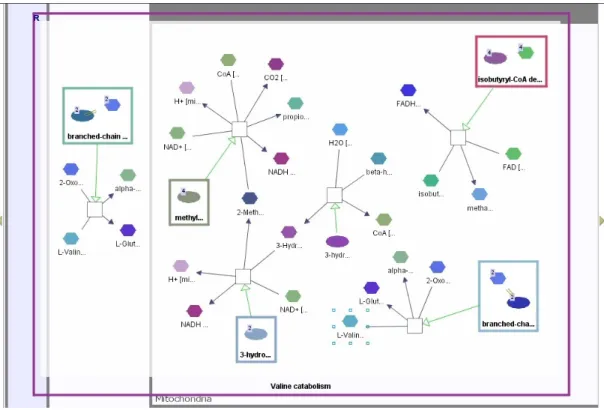
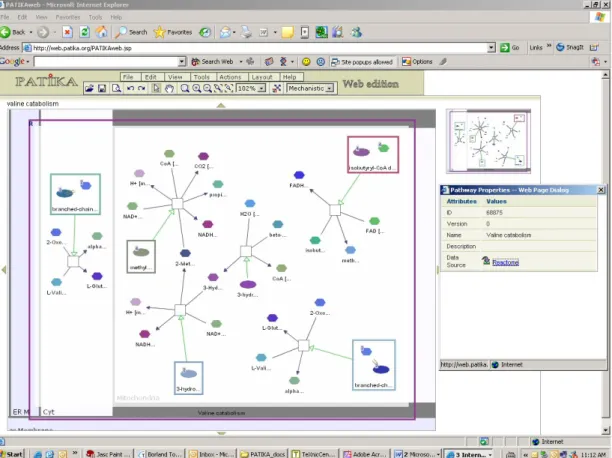
A pathway is a network of interacting proteins to perform a specific metabolic or signaling task in living systems (See Figure 1.1). Signal transduction is the process converting one kind of signal into another by chemical modifications. Series of biochemical reactions produce metabolic byproducts, end-products or become part of other pathways themselves. Current knowledge in metabolic pathways is deeper than the signaling pathways [1].
Since the completion of the Human Genome Project, scientists have been generating huge amounts of data on cellular pathways. Therefore, many different databases started to host such data to simplify such complicated information. Although such databases contain different types of data, there is significant data overlap problem in these sources. KEGG1, Enzymes and Metabolic Pathways database (EMP)2, EcoCyc3, SWISS-PROT4, Gene Ontology (GO)5, ExPASY6
1http://www.genome.jp/kegg/ 2http://www.empproject.com/ 3http://ecocyc.org/ 4http://www.expasy.org/sprot/ 5http://www.geneontology.org/ 6http://www.expasy.org/
CHAPTER 1. INTRODUCTION 4
Figure 1.1: Sample pathway: Valine Catabolism, from Patikaweb
are only a few of examples. Some of these databases contain only metabolic path-way information like EcoCyc and EMP. Some others contain both metabolic and regulatory pathway data like KEGG. Researchers need to access the integrated information from these databases, while conducting their research. Accessing such data and integrating them will not be the feasible solution for most of the scientist. Therefore we developed a knowledge base, where we perform the data integration process and provide the integrated data from different databases. We used many public databases while integrating data for Patika database, includ-ing Entrez Gene, UniProt, PubChem, GO, Reactome and KEGG.
As sources available to reach data increased, the requirement for the portabil-ity of the data became an important issue. A standard way should be developed to exchange available data and newly produced data. BioPAX7 and SBML (The
Systems Biology Markup Language)8 are such efforts. We use these standards in
our software tools, to provide data portability.
7http://www.biopax.org/ 8http://sbml.org/index.psp
Chapter 2
Related Work
As biological pathway data started to accumulate, software tools to access and vi-sualize this data became indispensable. Therefore both commercial and academic research groups aimed to satisfy this requirement.
Initially the developed tools only presented still pictures of known pathways. BioCarta1, which is a commercial company founded in 2000, developed this kind
of a tool, where they provided still images of specific pathways. As new path-ways are introduced into the knowledgebase of BioCarta, corresponding images have to be created manually. The necessary description of the pathway is then given by a summary text. ExPASy2 is a similar tool providing a simple
inter-face for textual queries to match any of the available biochemical data. Data is presented with map like still pictures. KEGG (Kyoto Encyclopedia of Genes and Genomics) provides hand-drawn still images3. MetaCyc4 provides access to metabolic pathways for over than 300 organism. Similarly EcoCyc5 is a database providing genome, metabolic pathway information for the bacterium Escherichia coli. Both MetaCyc and EcoCyc provide Web based tools for querying, editing and visualization for the data in their database [9].
1http://www.biocarta.com/ 2http://www.expasy.org/cgi-bin/search-biochem-index 3http://www.genome.jp/kegg/ 4http://metacyc.org/ 5http://ecocyc.org/ 5
CHAPTER 2. RELATED WORK 6
One of the major drawbacks of all these tools is that it is required to create the pathway drawings as new data is introduced. That means that the integration of data and its representation in images require a significant amount of extra effort. Moreover still images cannot be modified, therefore they are only used for knowledge acquisition of one type. Research and development in this area started to develop new tools to provide dynamic visualization of pathways and to be able to integrate different databases at the same time.
Cytoscape6 is a free, open source tool for general purpose modeling
environ-ment. The strongest point of Cytoscape compared to other tools is its plug-in adaptable architecture. Especially for data analysis, they provide different plu-gins like microarray data analysis. Integration of data, mainly annotations to the available graph is strongly supported. However, as it is mainly designed as a modeling tool, knowledge acquisition through Cytoscape is possible through plugins to load some data. They introduce new plugins as new types of data to load becomes available. For example, latest plugin release supports downloading protein-protein interactions. Another way to analyze the current data in Cy-toscape is to save the data in the acceptable format and to reload it. Different layout algorithms are implemented to enhance the visualization quality. Cy-toscape Core is implemented in Java with LGPL Open Source license. Graphical component of Cytscape uses yFiles Graph Library (Java Graph Layout and Vi-sualization Library)7. One potential downfall for users is that Cytoscape requires
a download and installation to run the software [14].
Another software tool for pathway visualization is VisANT8, which is an open-source, online tool for access and visualization of bimolecular interactions. Currently VisANT obtains pathway data from KEGG database and draws infor-mation from Predictome database. Annotation and cross references are obtained by GenBank and SwissProt. The system provides navigation of data, manipula-tion and expansion of visualized pathways by basic graph operamanipula-tions like degree distribution, loop detection and shortest path identification [5].
6http://www.cytoscape.org/ 7http://www.yworks.com 8http://visant.bu.edu/
CHAPTER 2. RELATED WORK 7
Users need to point their browsers to the provided Web page and, choose to run the VisANT applet, run the VisANT Java Web-Start Application or down-load and install the stand-alone application. VisANT provides textual querying facility, where the user can enter the ORF IDs, GI numbers, or KEGG pathway IDs for an arbitrary number of genes. Saving the pathway locally or by protecting password to reach later remotely is possible in a simple delimiter based format. However not all the functionalities are available for the downloadable applet form. Registration is required for save and load operations. The system provides online structure by using J2EETM technology. They require a Web browser and Java Runtime Engine (JRE).
Another academic group developed a similar tool for pathway visualization. Center for Computational Genomics at the Case Western Reserve University, developed a system called Pathways Database System [10]. This system is an integrated system, composed of different software components. This system’s database component provides pathway data extraction from different databases such as SwissProt and GenBank. They also provide a querying component, to access the data in their database. Their third main component is the visual-ization component. To achieve the visualvisual-ization of the pathway data, they use their own graph editing library, PathwayViz in Java [13]. In their visualiza-tion scheme, they allow multiple level of abstracvisualiza-tions to visualize data. To get full functionality for the system, users need to download different components, like browser and the viewer independently. Currently available components are metabolic/signaling pathway browsers, pathway viewers, pathway explorer, path-way editor, Java based viewer and an XML based Web service to make queries. Java based viewer component loads an applet from the Web site, and provides a tree of pathways, processes and molecular entities to be visualized. There is a limited number of entities provided to be visualized within this component. Limited editing operations are provided , like move, expand/collapse and find node/edge.
Observing the positive and negative points of these tools, Bilkent Univer-sity Center for Bioinformatics started a project namely, Patika, which produce
CHAPTER 2. RELATED WORK 8
software tools containing workpackages like data integration, analysis and visu-alization.
2.1
PATIKA Project
The Patika project aims to cope with the complex information in cellular processes and provide an infrastructure for this information. Having this road map, Patika project produces software tools with its own ontology, mapping to the data in its knowledge base visualizable, editable and analyzable in an editor [2]. Ontology is the formal specification of a concept, built to be portable among applications with different domains [8]. Patika team developed its ontology en-abling integration of incomplete, complex and fragmented pathway information [1]. Throughout this thesis we will refer to the components of this ontology, therefore we will briefly cover these components.
• States and Bioentities: Macromolecules, small molecules are the actors of molecular level reactions. However these molecules have different states in the cell based on the localization or chemical modifications. Therefore we define these molecules as bioentities and define their states based on the variable conditions.
• Transitions: It is modeling for a functional process. They provide as avoid-ing hyper edges in graphical representation of a pathway.
• Compartments: Physical localizations of proteins play a significant role in pathway analysis as a potential implication of function. Therefore graphi-cally cell compartments must be modeled as well.
• Molecular Complexes: Molecules performing in structural or functional groups are defined as complexes.
CHAPTER 2. RELATED WORK 9
• Abstractions: Incomplete and complex information contributing to the net-work of higher level information must be represented. Abstracting a path-way information as a single processes or grouping similar process are re-quired for complexity management. Abstractions are basically composed of states, transitions and possibly other abstractions. Visual representation of abstractions with the limitations introduced by the compartments and graphical invariants are also addressed in this thesis. We have five types of abstractions defined in Patika ontology as Homology State, Homology Transition, Incomplete State, Incomplete Transition and Regular Abstrac-tion.
Considering the visualization of the pathway data specified with Patika on-tology, we designed different levels of visualization. Analysis and representation of different levels of data requires separate handling. Therefore we defined two views as Mechanistic Level View and Bioentity Level View. Relations among bioentities, such as protein-protein interactions, are represented in Bioentity view, whereas data related to metabolic or signaling pathways are visualized in Mechanistic view. Visual representation of the ontological components can be seen in Figure 2.1 in both Bioentity and Mechanistic levels.
CHAPTER 2. RELATED WORK 10
Chapter 3
Software System
3.1
Problem Statement
As we have stated previously in Section 1, data available in cellular processes at molecular level is accumulating very fast; and thus in parallel, researchers would like to reach this information rapidly. Presentation of the information is at least as important as the fast and rapid access to the data. Visual representation of the pathway information is preferred over the textual representation of the data by the researchers, due to the nature of the information.
We reconsidered these facts with the current user profile of Patika and other pathway visualization tools. Most of the researchers need fast and easy access to the metabolic/signaling pathway information to accelerate their research. Down-loading, installing, executing a software tool, just to perform read only operations on a pathway database is not desirable in terms of time and effort for most of the researchers. We also foresee that, majority of the users will perform read-only access to our database, rather than write operations such as data submission. Therefore, we have decided to provide a Web service reachable through a Web browser.
In Patika the problem of pathway visualization and tools having extensive 11
CHAPTER 3. SOFTWARE SYSTEM 12
visualization facilities had been attacked previously. For visualization compo-nent in Patikapro we have used Tom Sawyer Visualization Java Edition and customized it for extensive pathway visualization [15].
We need to build a framework where we can reuse the previously built vi-sualization component of Patikapro and integrate it with the new Web based service, Patikaweb. Therefore our problem comes down to defining the require-ments of Patikaweb based on the so far defined use case, design the system so that we can integrate the currently available approach to pathway visualization and define the technology to apply these architectures. We will address these issues in the next chapter.
Given the problem stated in Chapter 3.1, we have decided to build a Web-based service providing a read-only access to the Patika database, an interface to visualize this data and limited editing operations on the visualized data. However when we considered the use cases, we concluded that there is a considerable amount of memory and CPU requirement even for read only operations to be serviced by Patikaweb. Carrying the load of computationally heavy to the client side was not desired, since we do not want to put any necessary requirements on use of Patikaweb like CPU power or memory. The other alternative was to carry the logic that requires computation sensitive operations to the server side. This idea led us to the thin client concept.
A thin client is defined as a front-end having minimal software requirements and performing minimal computational operations. Internet and intranet are fundamentally based on the thin client paradigm [6] .All resource-requiring oper-ations are performed at the server side, and results of the computoper-ations are trans-ferred back to the client. Properly partitioning the resource-requiring processes between clients and servers is an effective way to distribute the computing re-sources. Based on the domain of the application the resource requirements change, but basic ones to consider are CPU cycles, memory, security, virtual memory, and high-speed data storage, etc. [4]. Another major advantage of thin clients is the concern for the developers and maintenance. Ability to have both scalability and centralized administration with thin client architectures is a
CHAPTER 3. SOFTWARE SYSTEM 13
Figure 3.1: Modular architecture of Patikaweb considerable benefit for fast changing resources and requirements [4].
Although thin-client architecture is advantageous for many perspectives, there are some drawbacks to consider. Client/Server architecture, which use the thin client approach rely on the bandwidth and network latency. It is experimentally shown that network latency becomes the bottleneck in such applications [11]. On the other hand, it is clear that network latency problem cannot be avoided for most of the fat clients as well. Improvements in the Web technology also helped to overcome these problems. Web components, plugins, like applets, JavaBeans, dynamic HTML pages are the technologies used extensively.
Web services are defined as the services available through Internet, accessible by standard Web protocols like http, using messaging data formats like XML1.
Web services have a self-containing and modular structure to provide any appli-cation logic reachable through Internet2. Therefore we initially decided to define the modular structure of our Web service, Patikaweb and divide design steps based on the application logic.
In Figure 3.1, we present the multi-tier architecture for our Web-service. In this architecture, user, application and data components are tiered apart.
1www.w3.org/2003/glossary/subglossary/xkms2-req/ 2http://www.ecots.org/
CHAPTER 3. SOFTWARE SYSTEM 14
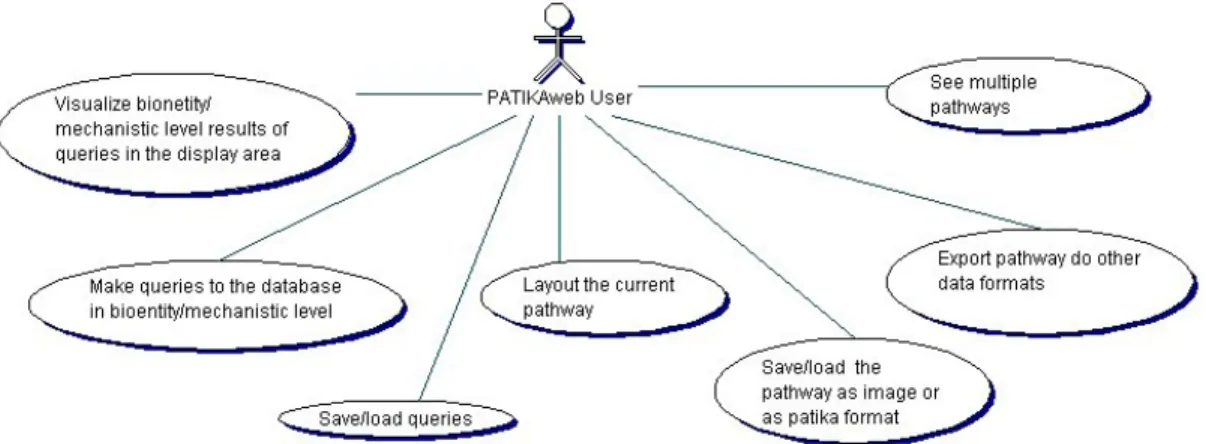
Figure 3.2: General use cases of Patikaweb
Figure 3.3: Editing use cases of Patikaweb
We have defined the functionalities of the components of the tiered architec-ture based on the requirements. For the requirements analysis phase, initially we have defined the use cases of Patikaweb in Figures 3.2 and 3.3.
Analyzing the use cases presented in Figure 3.2 and Figure 3.3, we identified the basic functionalities that we must provide as follows:
1. Pathway data model access by queries,
2. Visualization and editing of the current pathway model,
In the multi-tiered architecture, these functionalities are decomposed and de-signed in different components and mentioned in the following sections.
CHAPTER 3. SOFTWARE SYSTEM 15
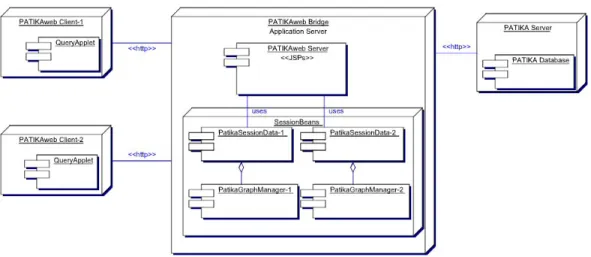
Figure 3.4: Deployment diagram of Patikaweb
We have decomposed our system according to the multi-tiered architecture and considered the following components in the design process as seen in Figure 3.1:
• Patikaweb Client Side Design: This component maps to the user tier in our architecture. In the client side, we focused on the user interface design of the Web page. Communication of the client to Patikaweb bridge over http is considered as well.
• Patikaweb Bridge Design: This component maps to the application tier in our architecture. In this part we designed the application logic. As we have defined in Section 3.1, we aim to reuse the code base that we have developed for previous pathway visualization tools, customized and integrated it with the new design developed for Patikaweb.
• Patika Server, Data Flow and Communication: This component maps to the data tier in our architecture. This part also covers the communication with Patika server.
Deployment of tiered architecture of Patikaweb , is detailed in Figure 3.4. In this figure we see that Patikaweb client communicates with Patikaweb bridge over http. We use the Java Server Pages (JSP) technology to handle the dynamic
CHAPTER 3. SOFTWARE SYSTEM 16
web content. In the bridge, which behaves as the application server in the multi-tier architecture, we host the JSP’s (Java Server Pages, see Section 3.5) and implement the application logic. Each client’s session, in other words each client’s application data is kept independently. The association of the user and the session information is managed by JavaBeans. Details of the components and their communication are given in the following sections.
3.2
PATIKAweb Client
3.2.1
Analysis of Query Facility
The only way to analyze data in Patikaweb is by reaching data in Patika database through submission of queries on this data. As we have mentioned in Section 2.1, we support data in two levels, as mechanistic and bioentity levels. Therefore to facilitate the access of data in both levels, Patikaweb provides mechanistic and bioentity levels in both querying and visualization interfaces.
The queries to be submitted to Patika database should be as extensive and powerful as possible, to get full advantage of the integrated knowledgebase. In addition to the basic textual queries, we should also provide graph theoretical ones. Nesting of these queries is also critical, since the user may have a very specific interest in the pathway data. Having created a complex, recursive query, a user might like to save the query and load it later to continue working on it. Considering all these requirements, we realized that we needed a very extensive interface, where sophisticated user interaction is provided.
3.2.2
Analysis of User Interface
Considering the use cases mentioned in the Figures 3.2 and 3.3 and requirements pointed in Section 3.2.1, Section 3.3.1 and Section 3.3.1.1, we developed a service, where the users are able to reach an interface where they can query, visualize and
CHAPTER 3. SOFTWARE SYSTEM 17
edit pathway data with a few mouse clicks. User interface of Patikaweb has the following components to provide these functionalities:
1. A drawing area for displaying pathway graphs: Results of the queries are displayed on this area. Only one pathway can be drawn at a time. We will refer to this area as canvas, from now on.
2. An inspection area: This is where the selected object properties are dis-played
3. A query dialog: This is where the queries are created and submitted. The results are displayed either as a new drawing or merged into the existing one.
4. Menus and toolbars: To provide the limited editing functions on the path-way data, functional menus and toolbar components are provided.
To supply the requirements defined for the interface, we developed an inter-face as in Figure 3.5. As you see in this figure, we provide a canvas where we display the results of queries. This canvas displays both bioentity and mecha-nistic level graphs. We provide an overview window for the graph displayed in the canvas. Inspection of the pathway objects is facilitated with the inspector window. Considering the limitation of a Web browser by space, we planned to reserve the largest room for the the canvas (in the middle) , and located the overview window and inspector window to the remaining places as seen in Figure 3.5.
3.2.3
Detailed Design of PATIKAweb Client
Patikaweb clients access the service supplied via their Web browsers. In these browsers, we provide highly dynamic visualization facilities over the displayed pathway information. Therefore we designed a mechanism where we can manage this dynamism both in the client side and at the server side. However we kept in mind that, our aim is to build a thin client, where most of the computation
CHAPTER 3. SOFTWARE SYSTEM 18
CHAPTER 3. SOFTWARE SYSTEM 19
requiring operations will be performed on the server side. Consequently, what we tried to manage at the client side required basic scripting.
Simply what we have been mentioning so far is a dynamically created html page with client side scripting. Client side scripting is a strategy preferred lately, used to reduce both the CPU requirement at the server and the communication cost. JavaScript is the technology used for the specified cases.
We represent the pathway data as still images in .jpeg format in the canvas. Creation of this still image and transmission of this image is provided by TSV JSP Edition framework. We customized this functionality by adding limited editing operations on the image. All editing actions performed on the canvas, other operations like pathway object property requests are initially handled by JavaScript, where we can perform primitive operations. Computation requiring requests for the client action are submitted to the bridge.
The creation of the still jpg images are done by TSV JSP Edition tag libraries. Similarly creation of the overview image is done with these libraries [16].
We also provide the utility to export the locally visualized data to other exchange formats like BioPAX3 and SBML4. Moreover the users are able to save
the current pathway in Patika model, as a pmdl file, which is the Patika pathway model file in XML format, and load it later. All these use cases require, the facility to load a file from Patika bridge. Therefore load/save actions, that require access to the user’s local machine are designed to be part of the html design. Since these operations are not part of the application logic, we considered them as the client side programming and designed the JSP pages accordingly.
3.2.3.1 Detailed Design of Query Dialog in PATIKAweb client
Another component that we designed as part of the client side, is the query dialog. Once we investigated the requirements of querying facility in Section
3http://www.biopax.org/ 4http://sbml.org/index.psp
CHAPTER 3. SOFTWARE SYSTEM 20
3.2.1, we observed that the query interface required extensive capabilities such as nesting, saving, loading, etc. One alternative was to build these facilities with JSP technology, with a sacrifice in extensive user interface facilities. On the other hand, we had an alternative that enabled us to reuse the existing querying interface we have developed for Patikapro. This alternative was implementing the query dialog as an applet. By this way, we were able to adapt the old code base with minimal modification and moreover, we got full advantage of applet in interactive query creation and submission phase. However we admit that this choice has a drawback. Downloading an applet over an internet connection may be a slow operation, which is an issue we try to avoid. Considering the pros and cons of this approach, we decided that sacrificing speed over extensive querying facilities was feasible. Thus we designed query dialog as an applet and added the facility that enabled the clients to download the JavaTM Archive (jar) files and to execute the query applet at the client side.
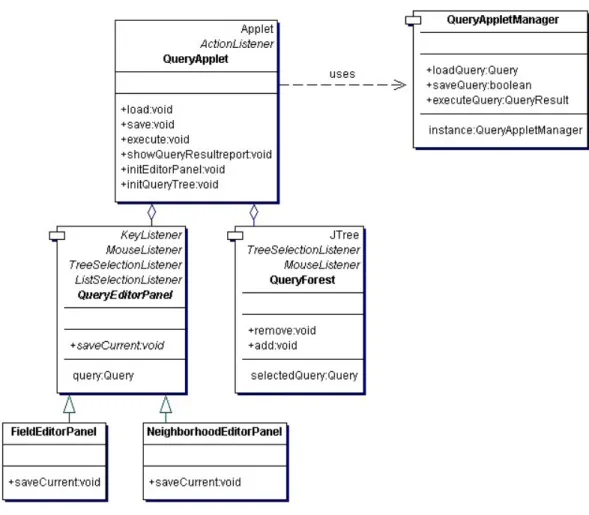
In the query applet, we provide query saving, loading and executing actions. Interface of the query applet was previously designed. We have customized the design for Patikaweb as in Figure 3.6. QueryApplet contains the interface com-ponents for building the nested queries such as EditorPanel and QueryForest. EditorPanel is an abstract editor panel class for handling different types of queries such as field queries or neighborhood queries. The creation of the query object is handled at the these editors. Functionalities of the QueryApplet is handled by the QueryAppletManager. Saving, loading and execution of the queries are the responsibilities of the QueryAppletManager.
Sample sequence for the execution of a query can be seen in Figure 3.7. In this sequence diagram, the client executes the selected query, by sending the request to the corresponding data, which we will refer as PatikaSessionData in the Patika bridge with an http request. In this http request, Patikaweb client sends the composed query object in XML. PatikaSessionData receives the request for the execution of a query action with the query as a stream and behaves like a pipe and forwards the stream to Proxy. Proxy is responsible for the communications with Patika server. Proxy sends the query to the Patika server and waits for
CHAPTER 3. SOFTWARE SYSTEM 21
Figure 3.6: Class diagram for query applet
the query result. Once the result is received from the Patika server, PatikaSes-sionData informs the clients of the results and waits for a feedback. Patikaweb client may choose to see or ignore the query results. If the user wants to see the query result in the browser window, then the visualizable graph for the query result is processed. User has the option to merge the query result to the current view or visualize it as a new graph. All these visualization related operations are performed at the bridge and the graph is rendered as still image and sent to the client side format via http. Creation of the still image in jpeg format is handled by the TSV API.
CHAPTER 3. SOFTWARE SYSTEM 22
Figure 3.7: Sequence diagram for a query execution
3.3
PATIKAweb Bridge
3.3.1
Analysis of Pathway Data Visualization and Editing
Once the requested model is retrieved from the Patika database, the user at the Patikaweb client side is able to visualize the result. In other words, Patikaweb client behaves like a graph window for the Patikaweb bridge.
Users are able to create and extend pathway models by performing queries both through an interface given and also through the object interface in the current view. As the obtained model gets complicated, the users want to save the current model. We provide saving capability in Patika model language, pmdl and allow loading it later. Moreover exporting the obtained graph to other standard data formats like BioPax5 and SBML6 are supported for enabling data
portability.
Considering the read-only structure of our tool, we provide mechanisms to
5http://www.biopax.org/ 6http://sbml.org/index.psp
CHAPTER 3. SOFTWARE SYSTEM 23
increase quality of the visualization facility. We considered following components to increase this quality:
• Bioentity and Mechanistic Levels: Pathway data in bioentity and mechanistic levels should be visualized independently. We have to provide a visual representation of the cell model, while visualizing the mechanistic level data.
• Layout of the pathway data: Since we provide extensive querying facil-ity, we need to present the result in the best possible way. Therefore, we apply a layout process on the pathway data prior and during the visualiza-tion.
• Editing Operations: Although we provide a read-only interface for path-way data in Patika database, to provide better visualization, we facili-tate operations like zoom in/out, delete, pan/scroll, hit testing, overview, drag/drop, etc. Extending a pathway by submitting new queries are also be provided.
• Complex pathway representation: As mentioned in Section 1.2, path-way data can be hard to visualize in two dimensions with limited graphical representation facility. We need to represent this information with maxi-mum coverage. This requirement can be thought of an independent compo-nent, therefore analysis and design of this component is studied separately in the following section.
3.3.1.1 Analysis of Complex Pathway Visualization
Incomplete and complex information contributing to the network of higher level information must be represented. Abstractions are introduced for this purpose in Patika ontology. We represent abstractions graphically with compound nodes having child graphs with the TSV API [15]. Compound nodes enable nesting child graphs, in other words provides us the framework to represent the compound pathway information for different levels of information.
CHAPTER 3. SOFTWARE SYSTEM 24
Graphical representation of abstractions in Patika ontology is an impor-tant task. Since abstractions represent a cellular events/pathways, a molecular component can be part of two different cellular pathways. Representing two dif-ferent pathways sharing an element, either requires making multiple copies of a molecule, or introducing a new graphical representation technique. Representing a molecule multiple times in a cell, within different pathways is misleading by giving wrong quantitative information. Therefore, we proposed different visual states of pathways, or abstractions as in our ontology.
We visualize abstractions as compound graphs with different visual states in our graphical representation scheme. These states and their meanings in graphs are as follows:
• Expanded: The default view of a compound graph is its expanded state. The child graph of the expanded node is visualized.
• Collapsed: A Collapsed compound node is represented as a single black-box like node, with the child graph folded. Collapsing a compound node conceals its child graph.
• Hidden: We define this state, as the abstraction being not visible. However in this state, we sill represent the members of the abstraction. Only we hide the information of abstraction owning the members. When an abstraction is hidden, its child graph becomes part of the parent graph and can be visualized.
• Holo: In this state we represent the pathway information without the compound node and child graph components. We present this information by adding a color information to the member of the abstraction. When an abstraction is in holo state, its child graph becomes part of the parent graph, as in hidden state; however we present the information of the abstraction with color coding.
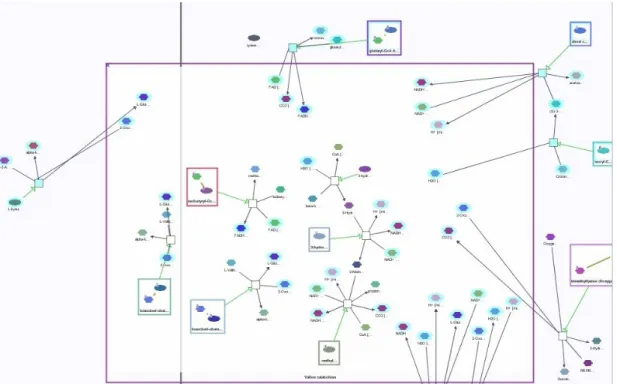
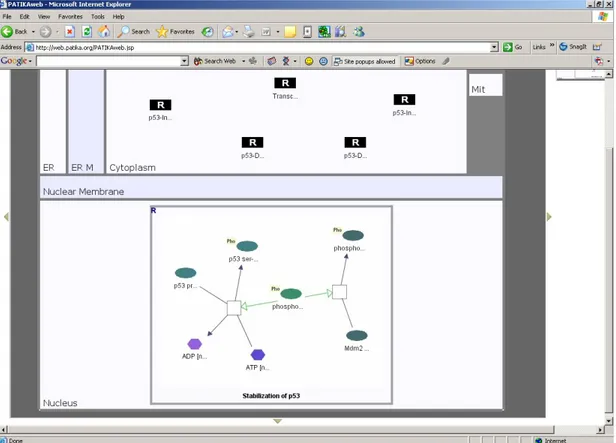
You can visualize the abstractions in Expanded and Holo states in Figure 3.8. States with a green holo color are members of another abstraction. In Figure 3.9,
CHAPTER 3. SOFTWARE SYSTEM 25
Figure 3.8: Abstractions in Holo and Expanded states
we can see the abstractions in Collapsed and Expanded states. Abstractions in the cytoplasm, drawn as black nodes are abstractions in collapsed state and the abstraction in the nucleus is in expanded state, where we can see its members in the child graph.
We define a concept of relationship among abstractions in terms of the rela-tions among the members of the abstraction. Abstraction A and abstraction B, may share a subset of their elements. In this case we define these abstraction A and abstraction B as having improper inclusion relationship. On the other hand, abstraction A may contain completely abstraction B itself as a sub-component. In this case we define these abstraction A and abstraction B as having proper inclusion relationship. These definitions are critical when we try to find the best possible visual state in a pathway and present it.
As we have stated earlier in Section 2.1, we have five types of abstractions which are Regular Abstraction, Homology State, Homology Transition, Incom-plete State and IncomIncom-plete Transition. We can represent all of these abstractions in expanded form. However due to the restrictions introduced by the cell model
CHAPTER 3. SOFTWARE SYSTEM 26
CHAPTER 3. SOFTWARE SYSTEM 27
Hidden Collapsed Holo Expanded Regular Abstraction
(Spanning 1 compartment) + + + + Regular Abstraction
(Spanning many compartments) + + + -Incomplete State + + - + Homology State + + + +
Complex State - + - +
Table 3.1: Summary of the valid options for all types of abstractions and biological constraints, not all visual states are applicable for all abstraction types. Allowed visual states for abstraction and complexes can be seen in Table 3.1.
3.3.2
Detailed Design of PATIKAweb Bridge
Patikaweb bridge is the tier, where the application logic is implemented. Data access and visualization are the basic functionalities of our application. As we have mentioned earlier, we have a visualization approach for pathway visualiza-tion, developed earlier for other Patika tools. We have customized this code base to integrate it with the visualization scheme of Patikaweb.
CHAPTER 3. SOFTWARE SYSTEM 28 Figur e 3.1 0: Bridge des ig n
CHAPTER 3. SOFTWARE SYSTEM 29
In Figure 3.10, the architecture of the session data can be seen. Session data, which is PatikaSessionData for our case, is instantiated as JavaBean, in the jsp file. As the user requests for the jsp file, this bean is instantiated in the bridge with the scope of session. This session bean keeps the data for that session, containing the current pathway data, query results and visual properties. Therefore, any action requiring a modification on any of these data, and consequently on the still image displayed on the canvas, is handled by the session data.
PatikaSessionData, is extended from TSESessionData, to customize it accord-ing to our preferences. Concept of two graph managers per session data, display-ing query results, expanddisplay-ing/collapsdisplay-ing and performdisplay-ing other editdisplay-ing operations on the graph data are achieved with PatikaSessionData. Each PatikaSessionData, has one BioentityGraphManager and one MechanisticGraphManager. We carry the subject-view mechanism of Patika visualization scheme to Patikaweb as well. That’s why each PatikaSessionData has one subject graph, SPatikaGraph instance (See Figure 3.10).
Although we limit the editing operations on the visualized pathway graph in Patikaweb , we allow operations like delete, expand/collapse, merge graphs and layout. Since these operations modify the graph topologically or visually, undo operations must be provided. However due to our one subject and multiple view mechanism, one operation in one view may require a modification in the other view. For example, deletion of a bioentity in the bioentity view causes removal of all of its states in the mechanistic view. If we want to perform an undo operation on bioentity view, we need to perform the corresponding undo operations on the mechanistic view. Command structure provided by TSV JSP Edition [16], does not provide this type of control. Therefore, we extended TSECommandManager into to sub-command managers as BioentityCommandManager and Mechanisti-CommmandManager (See Figure 3.10).
CHAPTER 3. SOFTWARE SYSTEM 30 Figur e 3.1 1: Sequence dia gra m fo r no de deletion in P a tika web
CHAPTER 3. SOFTWARE SYSTEM 31
In our design every interactive operation requiring process on the pathway data, requires access to the Patika bridge. All of these editing operations has a corresponding action class (e.g. PatikaExpandAction, PatikaLayoutAction, etc.) at the bridge. As the user performs any of these editing operations, the request to perform that action at the session data is sent to the bridge. For example, in Fig-ure 3.11, we see a sample sequence of a node deletion action. Patikaweb client performs the action on the browser, by calling the corresponding JavaScript. This script makes a request to the jsp file. As the jsp is compiled and the Java code is executed, PatikaSessionData, calls the corresponding method, newDeleteN-odeAction(). This method creates and returns an instance of the action object. PatikaDeleteNodeAction transmits the command for the deletion of the node. As we are dealing with deletion of view-level objects and the command for node dele-tion requires the subject-level node, we need to access the node’s subject at this point. We transmit the command to the correct command manager based on the type of the node, either MechanisticCommandManager or BioentityCommand-Manager. This command removes the node from the graph and adds the com-mand to the undo stack, for enabling undo operations.
3.3.2.1 Complex Pathway Visualization Design
In Patikaweb the results of queries are visualized in the best possible way. While preparing the visual representation of the query result, one issue that we need to consider is the abstractions. As mentioned in Section 3.3.1.1,we allow abstractions to be visualized in four different visual states. Some of these visual states are not applicable for all abstractions, based on their relationships as defined in Section 3.3.1.1.
Visual state of an abstraction to be visualized in Patikaweb is decided in the Patika bridge and visualized in that state. Limited visual state transitions are allowed by user’s choice. A Patikaweb user can only change an abstraction’s visual state between expanded and collapsed. On the other hand an abstraction can be visualized in any of the visual states applicable for that abstraction, when it is initially visualized in the graph. The selection of the proper visual state of the
CHAPTER 3. SOFTWARE SYSTEM 32
State in Editor Programmatic State Hidden ReadyToViz or NotReadyToViz
Holo Visible Holo or Invisible Holo Expanded Visible Expanded or Invisible Expanded Collapsed Visible Collapsed or Invisible Collapsed Table 3.2: Programmatic states for abstractions’ visual states
abstraction is done automatically. Based on the relationship of the abstraction with the other abstraction in the current graph, its visual state is decided. The order of visual state tested is like this: expanded, collapsed, holo and hidden state. Programmatically, visual state transitions for an abstraction depends on the other associated abstractions in the view. We defined low level visual states matching with the user perceived visual states. User perceived visual states for abstractions correspond to the programmatic visual states of an abstraction as in Table 1. Complex molecules are compound molecules, although they are not abstractions ontologically and not all the visual states are allowed for complexes. Correspondences among them can be seen in Table 3.2.
CHAPTER 3. SOFTWARE SYSTEM 33 Figur e 3.1 2: Sta te-transitio n dia gra m o f a bs tractio ns’ visua l sta tes
CHAPTER 3. SOFTWARE SYSTEM 34
Possible dependencies among abstractions are explained in the state-transition diagram (see Figure 3.12). As can be seen from the diagram, every user perceived state is divided into two sub states to manage the dependencies. One important design decision to point out is the order of transitions. An abstraction cannot pass directly from holo state to expanded state. Abstraction must first pass to hidden state, then to collapsed state and then to expanded state.
Dependencies among abstractions affect the visual state transitions of indi-vidual abstractions. There are two basic dependencies among abstractions in the same view: proper and improper intersection dependencies. In the proper inter-section, members of one abstraction is a proper subset of members of another abstraction. We will refer the abstraction which contains all the members of another abstraction as the parent abstraction of the other. In the improper inter-section dependency, two (or more abstractions) share one or more members but neither contains all members of the other. State transitions according to these dependencies are as in Figure 3.12. Each transition is labeled with a number and events that trigger these transitions, conditions that control these transitions and actions taken with these transitions are explained in detail below:
1. Event: Insert to view occurs.
Condition: If abstraction A has an improper intersection with some other abstraction B and abstraction B is in visible collapsed state.
2. Event: Insert to view occurs.
Condition: If there is no such dependency as in (1) in the view.
Action: Disable collapsed state if another abstraction B having an im-proper intersection with current abstraction is in holo state.
Action: Disable collapsed /expanded states if another abstraction B having an improper intersection with current abstraction is in expanded state. Action: Enable collapsed /expanded /holo states if all members are in un-hidden states.
3. Event: Parent abstraction of abstraction A changes to visible collapsed state.
CHAPTER 3. SOFTWARE SYSTEM 35
Event: Abstraction B having improper intersection with abstraction A changes to visible collapsed state.
4. Event: Parent abstraction of abstraction A changes to visible expanded or ready to visualize state from visible collapsed state.
Event: Abstraction B (having improper intersection with abstraction A) changes to visible expanded or ready to visualize state from visible collapsed state.
Action: Disable collapsed state if another abstraction B having an im-proper intersection with current abstraction is in holo state.
Action: Disable collapsed /expanded states if another abstraction B having an improper intersection with current abstraction is in expanded state. Action: Enable collapsed /expanded /holo states if all members are in un-hidden states.
5. Event: Visual state of abstraction A is set to collapse.
Condition: All members of abstraction A must be in unhidden states. Action: insert() into the view is performed.
Action: Enable all state options for this abstraction.
Action: All member abstractions change their visible states to correspond-ing invisible states. If in ready to visualize state, changes to not ready to visualize state. Disable hidden state for member abstractions.
Action: All abstractions having improper intersection with abstraction A, change their states to not ready to visualize state from ready to visualize state. Disable collapsed /expanded /holo state options for these abstractions. 6. Event: Visual state of abstraction A is set to hidden.
Action: All member abstractions change invisible states to corresponding visible states. Remove from the view is performed.
Action: All abstractions having improper intersection with abstraction A, change their states to ready to visualize state from not ready to visualize state. Remove from the view is performed.
Action: Disable collapsed state if another abstraction B having an im-proper intersection with current abstraction is in holo state.
CHAPTER 3. SOFTWARE SYSTEM 36
an improper intersection with current abstraction is in expanded state. Action: Enable collapsed /expanded /holo states if all members are in un-hidden states.
7. Event: Visual state of abstraction A is set to hidden.
Action: Disable collapsed state if another abstraction B having an im-proper intersection with current abstraction is in holo state.
Action: Disable collapsed /expanded states if another abstraction B having an improper intersection with current abstraction is in expanded state. Action: Enable collapsed /expanded /holo states if all members are in un-hidden states.
8. Event: Parent abstraction of abstraction A changes state to visible col-lapsed.
Action: All state options for this abstraction are disabled.
9. Event: Parent abstraction of abstraction A changes state to visible ex-panded or ready to visualize.
Action: Enable all state options for this abstraction.
Action: All member abstractions change their visible states to correspond-ing invisible states. If in ready to visualize state, changes to not ready to visualize state. Disable hidden state for member abstractions.
Action: All abstractions having improper intersection with abstraction A, change their states to not ready to visualize state from ready to visualize state. Disable collapsed /expanded /holo state options for these abstractions. 10. Event: Parent abstraction of abstraction A changes state to visible
ex-panded or ready to visualize.
Action: All state options for this abstraction are enabled.
Action: All member abstractions change invisible states to corresponding visible states. hidden state is disabled for member abstractions.
Action: For abstractions having improper intersection:
• If they are in not ready to visualize state, change to ready to visualize state, disable collapsed state option, enable expanded, hidden and holo state option for these abstractions.
CHAPTER 3. SOFTWARE SYSTEM 37
• If they are in visible holo state, for current abstraction disable collapsed and expanded state options; enable hidden and holo state options. Disable collapsed state for improper intersecting abstractions.
11. Event: Parent abstraction of abstraction A changes state to visible ex-panded or ready to visualize.
Action: All state options for this abstraction are enabled.
Action: All member abstractions change invisible states to corresponding visible states. hidden state is disabled for member abstractions.
Action: For abstractions having improper intersection:
• If they are in not ready to visualize state, change to ready to visualize state, disable collapsed state option, enable expanded, hidden and holo state option for these abstractions.
• If they are in visible holo state, for current abstraction disable collapsed and expanded state options; enable hidden and holo state options. Disable collapsed state for improper intersecting abstractions.
12. Event: Parent abstraction of abstraction A changes state to visible col-lapsed.
Action: All state options for this abstraction are disabled. 13. Event: Visual state of abstraction A is set to expanded.
Condition: All members of abstraction A must be in unhidden states. Action: All member abstractions change invisible states to corresponding visible states. hidden state is disabled for member abstractions.
Action: For abstractions having improper intersection:
• If they are in not ready to visualize state, change to ready to visualize state, disable collapsed and expanded state option, enable hidden and holo state option for these abstractions.
• If they are in visible holo state, for current abstraction disable collapsed state option; enable expanded, hidden and holo state options. Disable collapsed state for improper intersecting abstractions.
CHAPTER 3. SOFTWARE SYSTEM 38
14. Event: Visual state of abstraction A is set to collapse.
Condition: All members of abstraction A must be in unhidden states. Action: Enable all state options for this abstraction.
Action: All member abstractions change their visible states to correspond-ing invisible states. If they are in ready to visualize state, change their state to not ready to visualize state. Disable hidden state for member abstrac-tions.
Action: All abstractions having improper intersection with abstraction A, change their states to not ready to visualize state from ready to visualize state. Disable collapsed /expanded /holo state options for these abstractions. 15. Event: Parent abstraction of abstraction A changes state to visible
col-lapsed.
Action: All state options are disabled for this abstraction.
16. Event: Parent abstraction of abstraction A changes state to visible ex-panded or ready to visualize.
Action: Disable hidden state for all member abstractions .
Action: All abstractions having improper intersection with abstraction A, must disable their collapsed state option.
Once we have identified the flow of the states and transitions, we have de-signed the system and integrated it within the existing view design as in Figure 5.13. As seen in this figure management of the visual states of each abstrac-tion is handled by its view manager. State transiabstrac-tion requests are handled in AbstractionViewMgr.
Each view manager of an abstraction keeps the lists of abstractions having improper relation or proper relations with itself. Upon changing a visual state of an abstraction, its view manager iterates over its dependency list, makes required modifications. Based on the limitations and relations, some visual states for the abstractions in the dependency lists are enabled or disabled. A sample sequence for expanding a hidden abstraction can be seen in Figure 3.14.
CHAPTER 3. SOFTWARE SYSTEM 39
Figure 3.13: Design of abstraction view manager
CHAPTER 3. SOFTWARE SYSTEM 40
3.4
PATIKA Server, Data Flow and
Communi-cation
Patikaweb server currently is the tier keeping the data. In Patika database we have pathway data integrated from different databases. We access to Patika server with Patikapro clients, in other words with fat clients and Patikaweb clients via the bridge. Therefore the interface and the protocols for data access are designed to be exactly same. Considering the modular structure for Patikaweb, the Patikaweb bridge as explained in Section 3.3.2, is designed to have the interface of a fat client for Patika server. Besides reusability, this modular and scalable architecture provided us the flexibility to modify the client or the application module, without the consideration of Patika server.
Communication of the Patikaweb bridge to the Patika database is done over http. Since read-only operations are allowed in Patikaweb this communication is basically required for data access. As the user sends the query to the bridge via http in XML, the bridge behaves like a pipe and forwards the XML representation to the Patika database using the http protocol again. At this point, bridge knows nothing about the query, as it only transfers the XML file. Up to this point, the client and the bridge together behaves like a fat client. When the server performs the query and returns the query result over http to Patikaweb bridge in XML file, bridge itself behaves like a fat client for the representation of the query. The query result object is extracted from the XML and then is processed to represent it with a pathway graph. Once the graphical representation of the query result is finished, only the still image is passed back to the client side via http.
3.5
Implementation Details
We have used different technologies in the implementation of Patikaweb. As we have implemented a three-tier architecture, each tier uses different components to achieve its task (See Figure 3.15). In the client side, we use JavaScript, HTML
CHAPTER 3. SOFTWARE SYSTEM 41
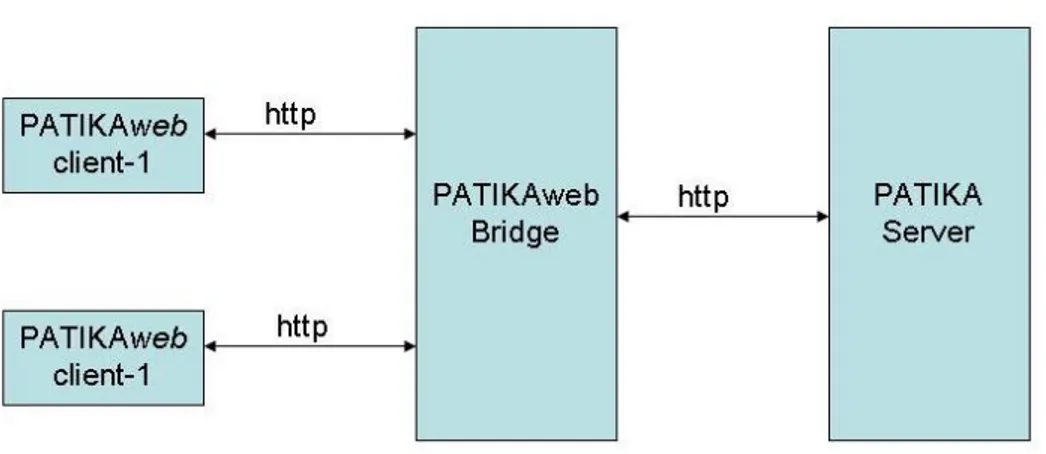
Figure 3.15: Architecture diagram of Patikaweb and their communication scheme
and DHTML to build the Web pages. These technologies provide us the dynamic content creation and limited event handling. We us DHTML for creating the menu and toolbar. In Patikaweb server, we use JSP technology within the TSV JSP Edition framework containing the graph editing toolkit. For the data flow, we use the XML format. We transfer queries from query applet at the client side to Patikaweb server and receive query results in XML format from Patika server. To handle marshaling and unmarshaling of these XML files we use Java Architecture for XML Binding (JAXB)7 technology. In the Patika
server PostgreSQL is used as the Database management system. For the object-relational mapping, Hibernate8 is used. Control of the components in the server
with MVC and managing the Hibernate are handled with Spring framework9.
Prior to the design process, we investigated the Tom Sawyer Software, JSP Edition. This edition provided us the framework for a thin client, where we can present any graph visualization facility at a Web page. In this framework JSP
7http://java.sun.com/developer/technicalArticles/WebServices/jaxb/ 8http://www.hibernate.org/
CHAPTER 3. SOFTWARE SYSTEM 42
(Java Server Pages) technology is used. JSP technology facilitates the creation of dynamic Web pages10, which is crucial in our service. JSP technology is an
extension to the Servlet Technology, which are server side modules for interactive Web applications11. Moreover in the framework provided by TSV JSP Edition,
JavaBeans, a reusable component12 which we can integrate with our Web ap-plication to represent objects mapped to the clients’ at the server side is also used.
Using these technologies, TSV JSP Edition provided us the basic skeleton that we will customize extensively for our Web service. Below is the sketch of TSV JSP Edition covering both the mentioned technology details and the provided framework :
1. Addressing the browser to main page, makes the request to the correspond-ing jsp page. This jsp page is first converted to Java code, compiled and loaded in the browser.
2. In the main jsp page loaded, there is html code and JavaScript and jsp code embedded.
3. When the main page is being loaded, an instance of the object is created that is defined as session bean in the jsp code part. The session bean instantiated in this framework is mapped with the graph that the user will be dealing with through out the session.
4. Every action on the main page is associated with a separate page, i.e has separate .jsp for every action. (Such as graph editing actions or file loading actions)
5. Every component that requires an action to be performed and be reflected to the browser, is linked to a JavaScript code.
6. Upon a click on a component on main page, corresponding JavaScript code forwards the browser to the corresponding jsp page.
10http://java.sun.com/products/jsp/
11http://java.sun.com/products/servlet/overview.html 12http://java.sun.com/products/javabeans/
CHAPTER 3. SOFTWARE SYSTEM 43
7. In each of these .jsp pages, the session bean is used to perform corresponding actions. For example in TSLoadFileAction.jsp, loadgraph() operation is called on canvas with the given file name. (This filename is carried from the selection on the main page).
8. Every .jsp page includes other .jsp references to maintain other required actions. For example, TSLoadFileAction after loading the graph on canvas, needs to call TSFitInCanvas.jsp to fit the created image of the drawing in the drawing area. After the completion of the load action, main page must be reloaded. To be able to do this, TSGoToMainPage.jsp action page is included in all proper action pages.
9. For some actions such as zoom, scroll, or selection of ”fit In canvas” explic-itly, only the image displayed in the main page is changed. The whole page is not reloaded.
As we have been using Tom Sawyer Software’s visualization tools, we choose to use the same framework to increase the development time. This choice has also served our strategy to reuse the previous visualization solutions developed in Tom Sawyer Software’s Graph Editing Toolkits. Therefore we have built our design on top of the skeleton provided by TSV, JSP Edition. However due to the license agreements of TSV JSP Edition, we could not provide an open source or non-limited license agreement tool. We warn the users of Patikaweb with an opening page about the license agreements. Patikaweb is a freely available software through Internet for non commercial uses only.
We can think of the Query Applet as an independent component within Patikaweb. Therefore we considered different implementation issues for the query applet. As seen in the use cases specified in Section 3.2, Patikaweb clients should be able to save the queries that they have built in the query interface provided. Loading of these queries should be allowed as well. These scenarios require that a downloaded applet performs an access to the client’s local ma-chine. For obvious security reasons, any downloaded applet cannot perform a read or write access to the local machine. Only trusted applets can perform such operations. JDK 1.3 or higher provide the technology to create trusted applets.