Monte Carlo simulation of localization dynamics of excitons in ZnO and CdZnO
quantum well structures
T. Makino, K. Saito, A. Ohtomo, M. Kawasaki, R. T. Senger, and K. K. Bajaj
Citation: Journal of Applied Physics 99, 066108 (2006); doi: 10.1063/1.2181431 View online: http://dx.doi.org/10.1063/1.2181431
View Table of Contents: http://aip.scitation.org/toc/jap/99/6 Published by the American Institute of Physics
Monte Carlo simulation of localization dynamics of excitons in ZnO
and CdZnO quantum well structures
T. Makinoa兲
Department of Material Science, University of Hyogo, Kamigoori 672-1297, Japan
K. Saito
Department of Physics, The University of Tokyo, Tokyo 113-0033, Japan
A. Ohtomo and M. Kawasaki
Institute for Materials Research, Tohoku University, Sendai 980-8577, Japan
R. T. Senger
Department of Physics, Bilkent University, 06800 Ankara, Turkey
K. K. Bajaj
Department of Physics, Emory University, Atlanta, Georgia 30322
共Received 11 January 2006; accepted 7 February 2006; published online 27 March 2006兲
Localization dynamics of excitons was studied for ZnO / MgZnO and CdZnO / MgZnO quantum wells共QWs兲. The experimental photoluminescence 共PL兲 and absorption data were compared with the results of Monte Carlo simulation in which the excitonic hopping was modeled. The temperature-dependent PL linewidth and Stokes shift were found to be in a reasonable agreement with the hopping model, with accounting for an additional inhomogeneous broadening. The density of localized states used in the simulation for the CdZnO QW was consistent with the absorption spectrum. © 2006 American Institute of Physics.关DOI:10.1063/1.2181431兴
Recently, there have been extensive studies on optical properties of semiconductor quantum structures.1In particu-lar, II-VI oxides have attracted a great deal of attention ow-ing to the fact that their excitons have large bindow-ing energies.2,3 The recent success of p-type doping2,3 has opened a door to realize application of ultraviolet共UV兲 light-emitting diodes. Introduction of cadmium and/or magnesium into ZnO plays a key role in strain4and band engineering of these oxides.5,6 In previous work, we have reported an S-shaped temperature dependence of the photoluminescence 共PL兲 in ZnO/MgZnO and CdZnO/MgZnO quantum wells 共QWs兲.7–9
Here, we report the W-shaped dependence of the PL.10 We model these temperature behaviors of the emission band and compare the results with the experimental data. We use a Monte Carlo simulation which is based on the excitonic kinetics.10
The samples were ZnO and CdZnO QWs. Both of these QWs were grown with laser molecular-beam epitaxy on ScAlMgO4 substrates. The material of our barrier layers is 5-nm-thick MgxZn1−xO. The PL was studied in the
tempera-ture range from 5 to 300 K. The continuous-wave He–Cd laser was used.11
The luminescence spectra taken for the ZnO /
Mg0.27Zn0.73O QW 共the well width being 1.8 nm兲 exhibit a
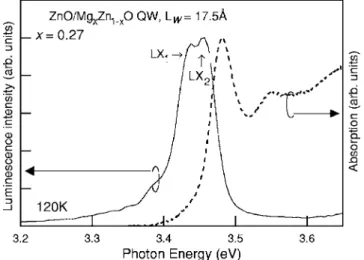
double band8,12 at intermediate temperatures of 95– 175 K. Figure 1 shows a typical PL spectrum at 120 K. These two emission bands correspond to radiative recombination of lo-calized excitons 共LX1 and LX2兲. The temperature depen-dence of the peak共see also Fig. 2 of Ref. 8兲 exhibits a
well-known S-shaped variation.8 The initial redshift reflects the ability of localized excitons to reach lower-energy sites via thermally activated hopping. The blueshift and the splitting of peaks that are observed with further increase in tempera-ture may be attributed to the population of the localized ex-citon states with increasingly higher energy.
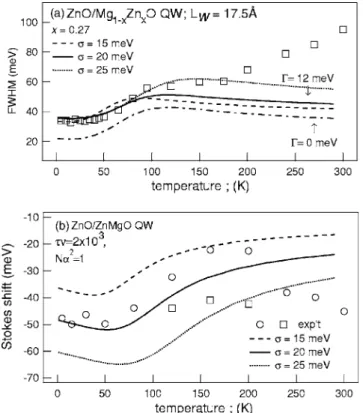
The features of hopping of localized excitons are sup-ported by the linewidth and Stokes shift measurements. The points in Figs. 2共a兲 and 2共b兲 show temperature variations of the full width at half maximum共FWHM兲 and Stokes shift of the PL band. Here, we notice a W-shaped temperature dependence10of the linewidth. Its abrupt increase with tem-perature共5–100 K兲 was related to thermalization of the ex-citons over localized states, as opposed to the situation at
a兲Electronic mail: [email protected] FIG. 1. The excitonic absorption and PL spectra in a ZnO / MgMQW共well width being 1.8 nm兲 taken at 120 K. 0.27Zn0.73O
JOURNAL OF APPLIED PHYSICS 99, 066108共2006兲
lower temperatures where the excitons do not attain their equilibrium distribution. On the other hand, the temperature variation of Stokes shift is more complicated due to the peak splitting at the intermediate temperatures.
The temperature dependences were simulated by a two-dimensional 共2D兲 Monte Carlo algorithm. This algorithm adopts the Miller-Abrahams rate for phonon-assisted exciton tunneling between initial and final states 共i and j兲 with the energies of⑀iand⑀j, respectively,10
ij=0exp
冉
−2rij
␣ −
⑀i−⑀j+兩⑀i−⑀j兩
2kT
冊
. 共1兲Here rijis the distance between the localization sites,␣is the
decay length of the exciton wave function, and 0 is the
attempt-escape frequency. Hopping was simulated over a randomly generated set of localized states with the sheet den-sity of N. Denden-sity of states共DOS兲 of the localization energies was assumed to be in accordance with a Gaussian distribu-tion,
g共⑀兲 = 共N2/22兲2exp关− 共⑀− E
0兲2/22兴, 共2兲
with the peak positioned at the mean excitonic energy E0and
the dispersion parameter共the energy scale of the band poten-tial profile fluctuation兲 . The reference energy was ⑀= E0,
which is the center of the distribution. All the energies in our simulation were below this value, i.e., a “half” distribution.13 For each generated exciton, the hopping process terminates by recombination with the probability0−1 and the energy of the localized state is scored to the emission spectrum.
The temperature variation of the data is basically deter-mined by the spatial 共the product N␣2兲 and temporal 共the
product00兲 parameters. For example, the kink in the
tem-perature dependence of the FWHM is related to the energy of the potential fluctuations , i.e., = 2kBTkink 共Refs. 10 and
14兲.
It has been difficult to reproduce both of our FWHM and energy shifting behaviors with the identical set of simulation parameters. Nevertheless, if we adopt the values of N␣2= 1,
00= 2⫻103, and= 20 meV, the calculated result
approxi-mately reproduces the 22 meV amplitude of the variation of FWHM curve as shown by a solid curve in Fig. 2共a兲. The dashed and dotted lines in Fig. 2共a兲 demonstrate the sensitiv-ity of the simulated results with respect to the hopping en-ergy scale . Increased matches better with the experi-ment, but, as explained later, we will meet serious difficulty in accommodating the experimental Stokes shifts. The quan-titative agreement with the experimental data requires an ad-ditional inhomogeneous broadening 共⌫=12 meV兲 to be introduced.10 The dash-dotted line shows the simulated de-pendence without inhomogeneous broadening 共⌫兲. The fur-ther increase of the linewidth above 175 K is attributed to the participation of the longitudinal optical phonons in the radiative transition not accounted for in the model.
The temperature behavior of the Stokes shift is depicted in Fig. 2共b兲. The following feature was reproduced in the simulated results: the crossover temperature for the energy minimum in the S-shaped dependence 共50–60 K兲. On the other hand, the initial redshifting behavior at low tempera-tures is somewhat exaggerated. We can accommodate this disagreement if the value of00is reduced. But, the agree-ment for the FWHM becomes worse. More refineagree-ment of the model should be necessary to describe this splitting. Never-theless, it is thought that the simulated Stokes shift energies correspond to the average energy of the splitted peaks. At temperatures higher than 230 K, the experimental data of the Stokes shift are not in good agreement with those of the simulation. This is probably because the spectral weight moves to the direction of the emission peak of longitudinal-optical phonon replicated recombination at the elevated tem-peratures as has been pointed out for ZnO bulk crystals and thin films.15,16
For comparison, the simulated results for the
Cd0.04Zn0.96O / Mg0.12Zn0.88O QW 共the well width being
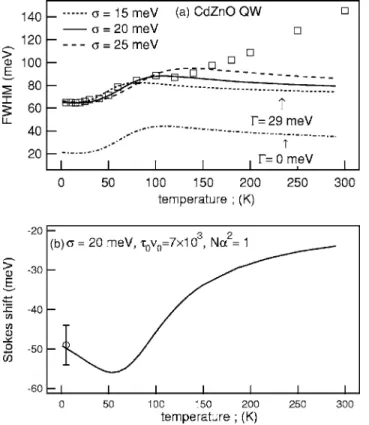
1.8 nm兲 were shown in Figs. 3共a兲 and 3共b兲. The solid line in Fig. 3共a兲 represents the best fit obtained for the following values of the parameters: N␣2= 1, 00= 7⫻103, ⌫
= 29 meV, and= 20 meV. Unfortunately, the experimental Stokes shift datum was obtained solely at 5 K. This is in a good agreement with the result of simulation as shown with the open circle in Fig. 3共b兲.
Finally, Fig. 4 compares the 5 K absorption spectrum共a dashed line兲 with the actual density of localized states used in the simulation共a solid line兲,
D共E兲 ⬀ exp
冋
−共E − E0兲2
2共2+⌫2兲
册
, 共3兲where the inhomogeneous broadening is taken into account by the introduction of ⌫ 共here 29 meV兲. These densities of FIG. 2.共a兲 Evolution of the FWHM of the PL band with temperature. Open
squares show experimental data; dashed, dotted, and solid lines depict re-sults of the simulation for different scales of random potential fluctuations 共indicated兲 with the inhomogeneous broadening ⌫; and the dash-dotted line represents results for= 20 meV and⌫=0. 共b兲 Simulated and experimental temperature dependences of the Stokes shifts.
band-tail states are centered at the exciton transition energy 共3.285 eV兲 obtained by adding the simulated Stokes shift 关Fig. 3共b兲兴 with the experimental PL energy 共see also Fig. 2 of Ref. 7兲. In addition, the long-wavelength wing of D共E兲 is seen to be in a fairly good coincidence with the low-energy tail of the corresponding absorption spectrum.
The value of⌫ for the CdZnO QW 共29 meV兲 is signifi-cantly larger than that for the ZnO QW 共12 meV兲, which is not surprising because of the more severe inhomogeneity in the former sample; both the well and barrier layers are com-prised of alloyed materials. Accordingly,00for the CdZnO
QW is also larger. It is likely that the effective lifetime 共re-lated to0兲 is longer.7
Here we try to evaluate precise Cd concentration at irra-diated region of the sample from a variational calculation17 where the electron-phonon interaction is taken into account. If the concentration is set to 4.3%, the transition energy is calculated to be 3.288 eV, which is very close to the exciton transition energy at 5 K.
In conclusion, we studied the evolution of the PL maxi-mum and FWHM of ZnO QWs with temperature by the Monte Carlo simulation. By making efforts to reproduce both of FWHM and energy shift with the same set of param-eters, the characteristic energy scale of the distribution of the localized states was⬇20 meV. The values of ⌫ and 00
for the CdZnO QW are significantly larger than those for the ZnO QW. The density of localized states employed in the simulation turned out to be in a good agreement with the long-wavelength region of the absorption spectrum.
The authors are thankful to Y. Segawa, N. T. Tuan, C. H. Chia, and Y. Takagi, for discussions. Thanks are also due to H. Koinuma.
1A. L. Efros, M. Rosen, M. Kuno, M. Nirmal, D. J. Norris, and M.
Ba-wendi, Phys. Rev. B 54, 4843共1996兲.
2D. C. Look, D. C. Reynolds, C. W. Litton, R. L. Jones, D. B. Eason, and
G. Cantwell, Appl. Phys. Lett. 81, 1830共2002兲.
3A. Tsukazaki et al., Nat. Mater. 4, 42共2005兲.
4T. Makino, Y. Segawa, A. Ohtomo, K. Tamura, T. Yasuda, M. Kawasaki,
and H. Koinuma, Appl. Phys. Lett. 79, 1282共2001兲.
5T. Makino, Y. Segawa, M. Kawasaki, A. Ohtomo, R. Shiroki, K. Tamura,
T. Yasuda, and H. Koinuma, Appl. Phys. Lett. 78, 1237共2001兲.
6T. Makino, Y. Segawa, M. Kawasaki, and H. Koinuma, Semicond. Sci.
Technol. 20, S78共2005兲.
7T. Makino, N. T. Tuan, Y. Segawa, C. H. Chia, M. Kawasaki, A. Ohtomo,
K. Tamura, and H. Koinuma, Appl. Phys. Lett. 77, 1632共2000兲.
8T. Makino et al., Appl. Phys. Lett. 78, 1979共2001兲.
9T. Makino, C. H. Chia, K. Tamura, A. Ohtomo, M. Kawasaki, H.
Koi-numa, and Y. Segawa, J. Appl. Phys. 93, 5929共2003兲.
10K. Kazlauskas et al., Appl. Phys. Lett. 83, 3722共2003兲.
11T. Makino, C. H. Chia, N. T. Tuan, Y. Segawa, M. Kawasaki, A. Ohtomo,
K. Tamura, and H. Koinuma, Appl. Phys. Lett. 76, 3549共2000兲.
12T. Makino, K. Tamura, C. H. Chia, Y. Segawa, M. Kawasaki, A. Ohtomo,
and H. Koinuma., Phys. Rev. B 66, 233305共2002兲.
13B. D. Don, K. Kohary, E. Tsitsishvili, H. Kalt, S. D. Baranovskii, and P.
Thomas, Phys. Rev. B 69, 045318共2004兲.
14R. Zimmermann, F. Grosse, and E. Runge, Pure Appl. Chem. 69, 1179
共1997兲.
15W. Shan, W. Walukiewicz, J. W. Ager III, K. M. Yu, H. B. Yuan, H. P. Xin,
G. Cantwell, and J. J. Song, Appl. Phys. Lett. 8, 191911共2005兲.
16T. Makino, Y. Segawa, S. Yoshida, A. Tsukazaki, A. Ohtomo, M.
Ka-wasaki, and H. Koinuma, J. Appl. Phys. 98, 093520共2005兲.
17R. T. Senger and K. K. Bajaj, Phys. Rev. B 68, 205314共2003兲.
FIG. 3. Same as Fig. 2 except that the sample is now a
Cd0.04Zn0.96O / Mg0.12Zn0.88O QW共well width being 1.8 nm兲.
FIG. 4. Optical absorption spectrum共dashed line兲 of a CdZnO MQW taken at 5 K. A solid line shows the density of band-tail states used in the simu-lation with the inhomogeneous broadening 共⌫兲 accounted for. The most prominent peaks共“ZnO A, B”兲 come from the ZnO buffer layer.