MODELING AND ANALYSIS OF MOVEMENT OF
A TURKISH ARMORED BATTALION TO MOBILIZATION
TASK AREA USING SIMULATION
A THESIS
SUBMITTED TO THE DEPARTMENT OF
INDUSTRIAL ENGINEERING
AND THE INSTITUTE OF ENGINEERING AND SCIENCES
OF BILKENT UNIVERSITY
IN PARTIAL FULFILLMENT OF THE REQUIREMENTS
FOR THE DEGREE OF
MASTER OF SCIENCE
BY
BURHAN ÜREK
August, 2002
I certify that I have read this thesis and that in my opinion it is fully adequate, in scope and in quality, as a thesis for the degree of Master of Science.
______________________________________________________
Assoc. Prof. İhsan Sabuncuoğlu (Principal Advisor)
I certify that I have read this thesis and that in my opinion it is fully adequate, in scope and in quality, as a thesis for the degree of Master of Science.
______________________________________________________
Asst. Prof. Doğan Serel
I certify that I have read this thesis and that in my opinion it is fully adequate, in scope and in quality, as a thesis for the degree of Master of Science.
______________________________________________________
Asst. Prof. Murat Fadıloğlu
Approved for the Institute of Engineering Sciences:
______________________________________________________
Prof. Mehmet Baray
ABSTRACT
MODELING AND ANALYSIS OF MOVEMENT OF
A TURKISH ARMORED BATTALION TO MOBILIZATION
TASK AREA USING SIMULATION
Burhan ÜREK
M.S. in Industrial Engineering
Supervisor: Assoc. Prof. İhsan SABUNCUOĞLU
August, 2002
Beginning with the cold war era especially the Combat Readiness and Peacekeeping missions become more important than the other tasks of the armies. The War Gaming and the Combat Simulations, which are developed especially for the purpose of evaluating combat between heavily armored forces, have recently been dealing with these new missions. The movement of ground forces, which is one of the major tasks of any ground commander, becomes a very significant operation in these new missions.
In this study, the existing movement plan of a Turkish Armored Battalion is studied by using a simulation model of the system. This simulation model helps staff officers of the headquarters which are the planners of military operations to build movement plans for the armored battalions early in decision process, identifies the problem areas in the movement plan, and takes necessary precautions, and evaluates the risk management before conducting a real operation.
This thesis aims for modeling and evaluating the movement of a Turkish armored battalion emplaced next to border from assembly area to the mobilization task areas, determining the amount of time delay of each retarding event caused both by terrain and the enemy and analyzing the cost for using the semi-trailers to carry armored vehicles of the battalion. The output of the model is analyzed by appropriate statistical methods. The code of the simulation is written in Arena simulation program.
Key Words: Military Simulation, War Gaming, Movement of Ground Forces,
ÖZET
BİR TANK TABURUNUN
SEFERBERLİK GÖREV YERİNE İNTİKALİNİN
MODELLENMESİ VE
SİMÜLASYON YOLUYLA İNCELENMESİ
Burhan ÜREK
Endüstri Mühendisliği Bölümü Yüksek Lisans
Tez Danışmanı: Doç. Dr. İhsan SABUNCUOĞLU
Ağustos, 2002
Soğuk savaş döneminin başlamasıyla birlikte Muharebeye Hazır Olma ve Barışı Koruma görevleri günümüz ordularının diğer görevlerinden daha çok önem kazanmıştır. Özellikle ağır zırhlı birlikler arasındaki muharebenin incelenmesi amacıyla geliştirilmiş olan Harp Oyunları ve Muharebe Simülasyonu son zamanlarda bu görevlerle daha çok ilgilenmektedir. Bütün kara birlik komutanlarının en önemli görevlerinden biri olan kara birliklerinin intikali bu görevlerin en önemli bölümlerinden birini teşkil eder.
Bu çalışmada bir Tank Taburunun intikal planı sistemin bir simülasyon modeli kullanılarak incelenmiştir. Bu simülasyon modeli, askeri harekatların planlayıcıları olan karargah kurmay subaylarına henüz karar aşamasında iken tank taburlarının intikal planlarının hazırlanmasına, intikal planlarındaki problemlerin tespitine, bu problemler için gerekli önlemlerin alınmasına ve gerçek bir operasyon icra edilmeden önce operasyonun risk yönetiminin incelenmesine yardımcı olacaktır.
Bu tez çalışması, sınıra yakın konuşlu bir tank taburunun alarm toplanma bölgesinden seferberlik görev yerine olan intikalinin incelenmesini, bu intikali etkileyen her bir faktörün toplam intikal süresi içindeki payının tespit edilmesini ve taburun zırhlı araçlarının taşınmasında kullanılan tank taşıyıcı araçların (çekicilerin) kullanılmasıyla ortaya çıkacak maliyet analizinin yapılmasını amaçlar. Model ARENA 3.0 simülasyon programı kullanılarak yazılmış, modelin çıktı veri analizi uygun istatistiksel metotlar kullanılarak incelenmiştir.
Anahtar Kelimeler: Askeri Simülasyon, Harp Oyunları, Kara Birliklerinin İntikali, Deneysel Tasarım, Karar Verme.
ACKNOWLEDGEMENT
I would like to express my gratitude to Assoc. Prof. Dr. İhsan Sabuncuoğlu for his guidance, understanding, motivating suggestions, and patience throughout all this work.
I would like to thank Asst. Prof. Dr. Murat Fadıloğlu and Asst. Prof. Dr. Doğan Serel for their valuable comments, kindness, and time.
I cannot fully express my gratitude to my friends and commanders in Armored Units School and Training Division Commandant for their support and encouragement.
To my family, I thank them for their sacrifice, support and patience during the preparation of this thesis.
Contents
1 Introduction 1
1.1 Movement……… 1
1.2 Movement Planning and Organization……… 2
1.3 Defense Against Enemy Attacks in the Movement of Armored Forces……….. 3
1.3.1 Enemy Artillery Attack or Indirect Fire……… 3
1.3.2 Enemy Air Attack………. 4
1.3.3 Enemy Ambush………. 5
1.3.4 Mines and Booby Traps……… 5
1.4 Usual Breakdowns………... 6
1.5 Movement of an Armored Battalion, Emplaced Next to Border, From Assembly Area to Mobilization Task Area……… 7
1.6 Thesis Outline……….. 9
2 Literature Review 11 2.1 Military Simulation……….. 14
2.2 Combat Modeling and Tactical Simulation………. 15
3 The Simulation Model 18 3.1 Problem Formulation and Setting Objectives……….. 18
3.2 Model Development………. 21
3.2.1 Conceptual Model………. 22
3.2.2 Components of the System………... 23
3.2.3 Logical Model (Flowchart of the System)……… 27
3.3 Input Data Analysis……… 32
3.4. Model Verification and Validation….………... 32
3.4.1 Verification of the Model…….……….. 33
3.4.2 Validation of the Model……….………. 34
3.4.2.1 Tests for Reasonableness…...………... 34
3.4.2.2 Model Structure and Data Tests………... 36
4 Design and Analysis of Experiments 37 4.1 Comparative Experiments….………. 37
4.1.1 Determination of Sample Size………. 38
4.1.2 Building Confidence Intervals………. 40
4.1.3 Comparison of Alternative System Designs...………. 41
4.2 2k Factorial Design………. 45
4.2.1 Diagnostic Checking……… 46
4.2.2 Analysis of ANOVA Results..………. 55
4.2.2.1 Evaluation of Main Effects and Interactions for MTIS.……… 55
4.2.2.2 Evaluation of Main Effects and Interactions for NODV...…… 61
4.3 Conclusions……… 63
5 Further Analysis of Scenario-1 and Scenario-2 Including the Cost Criterion Into Model 66 5.1 Cost for Using Transporters………... 68
5.2 Multi-attribute Utility Theory…...……….. 69
5.2.1 MAUT for the Best Case………..………... 74
5.2.2 MAUT for the Most Possible Case………..……… 77
5.2.3 MAUT for the Worst Case……….………..………... 82
6 Effects of Logistics Information System (LIS) on Movement 85
6.1 Logistics Information System (LIS)……… 85
6.2 Effects of LIS on the Movement of Armored Battalions to Mobilization Task Area……… 87
6.3 Conclusions……… 94
7 Conclusions 96 7.1 General……… 96
7.2 Design and Analysis of Experiments……….. 97
7.3 Further Analysis of Scenario-1 and Scenario-2 Including the Cost Criterion Into Model……….. 99
7.4 Effects of Logistics Information System (LIS) on Movement……… 100
7.5 Concluding Remarks……… 101
Appendices
Appendix A Tank Carrying Vehicles……… 104
Appendix B Computer Code of the Simulation Model.……… 107
Appendix C Flowchart of the System……… 111
Appendix D Input Data………..……… 116
Appendix E Sample Sizes…………..……… 127
Appendix F Data Lists of Paired-t Test….……… 129
Appendix G Design Matrix for 25 Factorial Design………..………… 130
Appendix H Regression Models for Performance Measures.………... 135
Appendix I ANOVA Results for Performance Measures………. 138
List of Figures
1.1 Movement of A Turkish Armored Battalion to Mobilization Task Area...……… 8
3.1 Model Development……….……….. 21
3.2 Conceptual Model……….. 22
3.3 General Flowchart of the System.……….. 31
3.4 A Screen Shot from Model……..………... 35
3.5 Flowchart of the System………….….………... 111
4.1 Scatter Plot of Residuals for MTIS………..………... 48
4.2 Scatter Plot of Residuals for NODV………....………... 48
4.3 Normal Probability Plot of Residuals for MTIS……..……….. 49
4.4 Normal Probability Plot of Residuals for NODV……….. 50
4.5 Plot of log Si vs. log y ……….. 53 i 4.6 Scatter Plot of Variances for NODV……….. 54
4.7 The Plot of Main Effects for MTIS……… 56
4.8 The Plot of Interaction Between Air Attack and Ambush……….…. 57
4.9 The Plot of Interaction Between Breakdown and Mine………. 58
4.10 The Plot of Interaction Between Air Attack and Mine………... 59
4.11 The Plot of Interaction Between Air Attack and Breakdown...……….. 60
4.12 The Plot of Main Effects for Number of Destroyed Vehicles..……….. 61
4.13 The Plot of Interaction Between Air Attack and Breakdown for NODV.……….. 62
5.1 Decision Matrix……….. 70
5.2 Utility Matrix……….. 70
5.3 Preference Diagram for Case 1………... 72
5.4 Preference Diagram for Case 2………... 73
6.1 The Effect of LIS on MTIS for the Most Possible Case (Scenario-1)...…………. 89
6.2 The Effect of LIS on MTIS and Minimum Improvement Rate for the Most Possible Case (Scenario-1)………. 89
6.4 The Effect of LIS on MTIS and Minimum Improvement Rate for the Worst
Case (Scenario-1)……….……….. 91 6.5 The Effect of LIS on MTIS for the Most Possible Case (Scenario-2)...…………. 92 6.6 The Effect of LIS on MTIS and Minimum Improvement Rate for the Most
Possible Case (Scenario-2)………. 93 6.7 The Effect of LIS on MTIS for the Worst Case (Scenario-2)……… 93 6.8 The Effect of LIS on MTIS and Minimum Improvement Rate for the Worst
List of Tables
2.1 Summary Table of Literature Review……….. 17
3.1 Technical Information About Simulation Model………. 30
4.1 Summary Table of 100(1-α ) % Confidence Interval for MTIS……….… 40
4.2 Summary Table of 100(1-α ) % Confidence Interval for NODV…...………….. 40
4.3 Results of Paired-t Test for the Best Case……… 43
4.4 Summary Table of Paired-t Test Results for MTIS. ……….……….. 44
4.5 Summary Table of Paired-t Test Results for NODV……….….. 44
4.6 The Factor Description and Factor Levels………... 46
4.7 Bartlett’s Test Results for MTIS……….……….………… 51
4.8 Bartlett’s Test Results for MTIS with Transformed Data..…….……….………… 54
4.9 Summary Table of Significant Factors and Interactions……….. 65
4.10 Summary Table of Sample Sizes for MTIS in Scenario-1………... 127
4.11 Summary Table of Sample Sizes for NODV in Scenario-1………. 127
4.12 Summary Table of Sample Sizes for MTIS in Scenario-2………... 128
4.13 Summary Table of Sample Sizes for NODV in Scenario-2………. 128
4.14 Data List for MTIS………... 129
4.15 Data List for NODV..………... 129
4.16 Design Matrix for 25 Factorial Design………. 130
4.17 The Outputs of 32 Design Points for MTIS………. 131
4.18 The Outputs of 32 Design Points for NODV..………. 133
4.19 Regression Model of Response for Performance Measures……… 135
4.20 Residuals for MTIS Performance Measure……….. 136
4.21 Residuals for NODV Performance Measure……… 137
4.22 ANOVA Results for MTIS……….. 138
4.23 ANOVA Results for NODV……… 139
CHAPTER I
Introduction
1.1. Movement
Movement is the movement of any unit from one place to another by any available
means. The capability to convey a quick movement to concentrate the effects of combat power at conclusive points is the most important feature of the battlefield agility.
All commanders want to increase their effectiveness by trying to prevent the enemy from moving enemy forces into predominant positions meanwhile by concentrating their forces to these key positions. It is necessary to hold all the key positions in the theater from the beginning of any operation. Therefore, the movement is one of the most important military tasks for all commanders.
There are three types of unit movement: 1.Administrative Movement, 2.Tactical Road March and 3. Approach March.
Administrative Movement
Administrative movement is a kind of movement applied when no enemy interference is expected except enemy air attack. Administrative movements are conducted only in secure areas in which units and vehicles are arranged to accelerate the movement for the purpose of saving time and energy.
Tactical Road March
Tactical road march is a kind of movement applied when the enemy contact is
possible and expected. In the tactical road march the attack of enemy ground forces is not expected but the moving units always take precautions against an enemy or paramilitary ambush. The main purpose of the tactical road march is to position the units within the theatre as fast as possible.
The primary consideration of the tactical road march is rapid movement. However, the moving force employs security measures, even when contact with enemy ground forces are not expected. Units conducting road marches may or may not be organized into a combined arms formation. During a tactical road march, the commander is always prepared to take immediate action if the enemy attacks.
Approach March
Approach march is a kind of movement applied when direct contact with the enemy forces is expected. It is conducted when the enemy’s location is known almost sure. In this movement speed is very important and the psychical security and dispersion has the second role.
1.2. Movement Planning and Organization
In Turkish Army the planning process is based on five basic factors regardless of the operation. According to the kind of operation there are always other secondary factors influencing the operation but the basic factors remain same. These basic factors are:
Other influencing factors for these types of operations are number of vehicles, roads, and training of the drivers.
Motorized movements are organized and controlled by arranging the moving unit’s vehicles into convoys. The convoy is the column of vehicles organized for the aim of control by a single commander. Convoys are used in:
1. Administrative movement of personnel and equipment, 2. Administrative movement of logistic units,
3. Tactical movement of combat forces.
The number of vehicles in a convoy varies from 2 to 300.
1.3. Defense Against Enemy Attacks in the Movement of Armored Forces
A unit cannot be regarded as in safe if it has no all around security. In addition to the operational threats the moving units must always be ready against an enemy or paramilitary ambush or sabotage. A successful mission can only be accomplished with the security measures taken against the enemy attacks. Besides, the losses and the vulnerability can be reduced with these security measures. Training is the key for the safety of the operation.1.3.1. Enemy Artillery Attack or Indirect Fire
Tactical movement of armored troops may be harassed or retarded by the enemy indirect fire or artillery units. The course of action when an enemy artillery attack occurs is the following:
A. Artillery Concentration Is Ahead of The Convoy: In this case the convoy should be
halted. The commander of the convoy searches for an alternate road around the impact area. If there is any road around the impact area the convoy immediately speeds up and passes
around the impact area by dispersing as much as possible. If there isn’t any alternate road the convoy disperses to the area as much as terrain allows and wait for the artillery attack to pass by.
B. Artillery Concentration Is Behind or On The Flanks of The Convoy: If this is the case,
the convoy should immediately increase its speed and pass away the impact area as fast as possible.
C. Artillery Concentration is On The Convoy: In this case the convoy disperses quickly to
the area as much as the terrain allows to decrease the casualty and gets out of impact area by speeding up.
1.3.2. Enemy Air Attack
The assets for the enemy air attack are attack aircraft, attack helicopters and the long-ranged missiles. The enemy air attack is one of the most hazardous operations for the convoys especially moving along open roads. The convoy has two courses of action against the enemy air attack:
A. Passive Defense: When an enemy aircraft is spotted the convoy commander has two
options: halt the convoy or disperse quickly to the terrain. The convoy commander may choose halting the convoy because it is difficult to see a halted convoy for the enemy pilots compared to a moving convoy. But this option has the disadvantage that a halted convoy makes a good target and in case of an attack the loss will be greater. The second option is dispersing quickly to terrain, taking cover and staying in concealed positions not to be noticed by enemy pilots. Dispersing vehicles hardens to be detected by enemy pilots and in case of an air raid decreases the casualty.
B. Active Defense: This course of action is applied when the enemy pilot notices and
attacks to convoy. The active defense against the enemy air attack means to fire against the enemy aircraft or helicopters with suitable guns. The basic principle of firing against aircraft or helicopters is to concentrate all fires on the targets and putting a large volume of interdiction fire according to type and the flight direction of the targets.
1.3.3. Enemy Ambush
In the tactical road marches especially the security and escort vehicles may be ambushed by the enemy or guerilla forces. The first rule of minimizing the casualty caused by an ambush is to apply the techniques of passing through the dangerous zones. Generally, a part of a convoy either the head, the main body or the trail is ambushed. The part that is ambushed should immediately exit the kill zone as fast as possible if the road or the terrain is available. The following vehicles push the vehicles, which are destroyed or disabled to move by the enemy fire, away from the road. Other parts of the convoy, which are behind the kill zone, do not enter this zone or if they are ahead of the kill zone they continue to march. The security or armed escort vehicles, which are ordered before the movement by the convoy commander to return fire to the enemy, attack to enemy forces. The vehicles in the kill zone return fire to the enemy while exiting the kill zone.
1.3.4. Mines and Booby Traps
The enemy uses mines or booby traps generally for blocking the movement road to harass the vehicles and to retard the movement. If the mine or the booby traps are noticed,
vehicle commander stops his vehicle and reports it to the convoy commander then searches for if there is a road around the mine or booby trap. If there is an alternate way to pass around, the mine or booby trap zone is signalized and the following vehicles are guided around this zone by a soldier. If there is no possibility to pass around this area, the mine cleared away and the convoy goes on marching.
If any vehicle is destroyed or disabled by a mine, which planted on the road, the convoy stops. The vehicle that is destroyed or disabled is cleared away from the road. If there is a possibility to repair the vehicle, the maintenance and repairing team repairs it while other vehicles go on marching. If the vehicle has failed catastrophically it is left in a secured area with its crew.
1.4. Usual Breakdowns
Usual breakdowns are one of the important factors that affect the movement. When usual breakdown occurs the vehicle moves out of the road and waits for the maintenance and repairing team if it is possible to repair it. After repairing, the vehicle goes on marching by joining the trail of the convoy. If there is a breakdown, which disables the vehicle to move any longer, the vehicle is left in a secure place with its crew.
1.5. Movement of an Armored Battalion Emplaced Next to Border From
Assembly Area to Mobilization Task Area
The movement of armored battalions, which are emplaced next to any border of Turkey, from assembly area to their mobilization task areas is one of the most important and critical tasks. The task is graphically explained in Figure 1.1.
This task is not a kind of task, which is conducted frequently by these units. This task is conducted only at times of crisis or war. Since it is performed at times of war or crisis, the contact with enemy forces is possible and expected at these times. Therefore, it can be regarded as a tactical road march. Any failure or fault that retards this mission directly affects the success of the next operations. This causes the failure to hold the key positions in the theatre and gives the enemy the opportunity to take the initiative from the beginning of war. This mission plays a vital role for the next operations. So, this movement should be completed with minimum loss and in a very short time. The units must be fresh and less harassed for the next operations so it should be completed with minimum loss. Especially, the time is very important for this mission because all units must be on their task areas at the same time for the next operation (attack or defense). Any lateness of any units will cause next operations to begin late so it should be completed exactly in planned time.
Since the time, namely the rapid movement, is the most important factor of this movement, Turkish Army wants to accelerate this movement. There are several ways of speeding up this movement. One of them is to emplace these units near to or on these areas.
ASSEMBLY AREA (AA)
AIR ATTACK
AMBUSH
BOOBY TRAPS OR MINE
50-70 KM.
ARTILLERY ATTACK
NATURAL BREAKDOWNS
MOBILIZATION TASK AREA (MTA)
BORDER
Figure 1.1 Movement of A Turkish Battalion to Mobilization Task Area.
SP
But this has the disadvantage of disability to conduct the inner country security tasks especially in a country like Turkey and this causes some problems in intelligence. Another solution is to increase the movement speed. But this will cause fatal accidents on road and results in casualties that are unwanted. Another way of increasing the speed is to carry the vehicles, which slow down the convoy speed. Especially, the heavy armored vehicles slow down this movement. So, the semi-trailers can be used for the rapid movement.
Turkish Army has been using these kinds of vehicles since 1988 but there isn’t enough number of semi-trailers in Turkish Army inventory to carry all the armored battalions next to any border at once. Therefore, in such a movement operation armored vehicles of some battalions are transported with semi-trailers while armored vehicles of remaining battalions march on foot. The detailed information about semi-trailers is given in Appendix A.
1.6. Thesis Outline
The remaining parts of the thesis are organized as follows. Chapter 2 presents the literature review related with the simulation software and methodology, military simulation and movement of ground forces. In Chapter 3, we develop the simulation model of the movement of an armored battalion, which is emplaced next to border, from assembly area to its mobilization task area. In Chapter 4, we give the design and analysis of experiments with graphical and numerical results. Chapter 5 deals with the output data analysis, which evaluates the results of the simulation model by the help of multi-criteria decision-making methods. In Chapter 6, we determine the effects of Logistics Information System (LIS) on
the movement. In Chapter 7 we interpret the results of this study and give the concluding remarks and insights for future researches. Appendices consist of figures and tables used in constructing this study, outputs and the code of the simulation model.
Chapter 2
Literature Review
In our literature review, we come across only one study that is related to our topic. “The Evaluation of Mobilization and Deployment Plan of A Turkish Armored Battalion Via Simulation” by Müslüm and Sabuncuoğlu (2001). The other studies are not directly related to ours, but in military simulation area. Hence, we explain them briefly under these subtitles:
• Military simulation
• Combat modeling and tactical simulation.
We start with the study directly related to our topic. In the study of Müslüm and Sabuncuoğlu (2001), they evaluate the mobilization and deployment system of an armored battalion, find out the significant factors of enemy threats on the deployment plan and check the mobilization and deployment system limits.
Their study aims for checking the efficiency of the mobilization and deployment system, detecting the bottlenecks of the system, selecting the most vulnerable region of Turkey against enemy attacks and checking the limits of the deployment plan.
There are some similarities and differences between their study and our study. The main differences are as follows:
• They model the mobilization and deployment plan of an armored battalion. In this plan, the armored battalion completes their preparations and march from their garrison to assembly areas. On the other hand, we model the
movement of an armored battalion, emplaced next to borders, from assembly area to the mobilization task area.
• The operation they model is the previous operation of our model and it is a kind of preparatory operation for the movement to the mobilization task area. The movement to the mobilization task area is the previous operation of the main operation such as attack or defense can be regarded as the first step of the war. Thus, it is more critical than movement to the assembly areas.
• The movement operation to the mobilization task areas which are located in the borderlines is performed very close to enemy forces so the probability to contact with the enemy forces of this operation is higher than that of operation they model in their study.
• The average distance between assembly area and mobilization task area is approximately 70 kilometers whereas the average distance from garrison to the assembly area is approximately 20 kilometers. Thus, the operation we model is a long-ranged operation and command, control and coordination measures are more important in our case.
These are the differences between the operation they model and the operation we model. There are also some other differences of our study. These differences are as follows:
• The rapid movement is very important in movement to the mobilization task area and semi-trailers are used to transport the armored vehicles of the some battalions. We model this case as an alternative scenario and find out the differences between existing system scenario and this alternative scenario. • We test the movement operation for these alternative scenarios under
different cases such as best case, most possible case and worst case and try to evaluate the behavior of the system under these cases and compare these scenarios for different performance measures.
• We also model the partial transportation of armored battalions as alternative scenarios and find the effects of each partial transportation types.
• We include the cost of using semi-trailers into our model and find the value of alternative scenarios by using multi-criteria decision-making methods. • We search the effects of some projects affecting the movement operation. The similarities between our study and their study are as follows:
• The movement operation performed in deployment plan can be regarded as a tactical road march if it is performed under war conditions. Therefore, the factors affecting this operation are same with our factors affecting our operation.
• The movement planning and organization procedures are the same. • In both study the same unit (armored battalion) is studied.
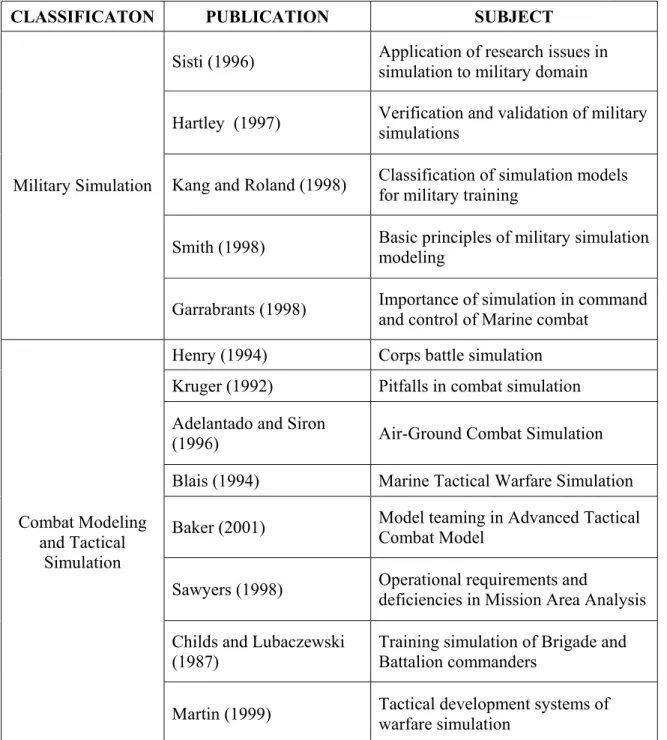
The other related studies in military simulation and combat modeling are as follows. A summary table of these studies is also presented in Table 2.1 to simplify the explanations.
2.1. Military Simulation
In this section we give information about research papers in military simulation. These research papers help us to understand the analyzing the outputs of the military simulation models and modeling of military systems in our study. Besides we use these papers to learn the techniques of verification and validation of the military simulation models.
Sisti (1996) discusses the research issues in simulation science being addressed by presented by academia, industry and Government and their application of these research issues to the military domain; specifically to the problems of Intelligence.
Hartley (1997) studies on the difficulties such as achieving the steady state in combat simulations, repeatability of military simulations caused by employing human decision-making in military simulations. He also explains the cost of validation and verification of military simulations and compares the verification and validation of military simulation models with that of other simulation applications.
Kang and Roland (1998) discuss on the military simulation, give a detailed history of military simulation. They classify the simulation models and give some explanations about simulation as a training tool for military.
Smith (1998) stresses on the basic principles of military simulation modeling. He gives a brief historical introduction and explains the essential methods for military training
simulations. He emphasizes on the importance of physical objects involved in the activities of moving and perceiving other objects in military simulations.
Garrabrants (1998) discusses the importance of simulation in support of all levels of command and control and explains an advanced simulation system, which models all aspects of Marine combat.
2.2. Combat Modeling and Tactical Simulation
Henry (1994) explains the techniques of to transform Corps Battle Simulation for the aim of training the staff officers and commanders in U.S. Army. He models the Corps Battle Simulation using Lanchester-type equations and discusses the evolution of the Corps Battle Simulation.
Kruger (1992) explains the pitfalls in combat simulations. He stresses on the training simulations of staff officers in Corps Battle Simulation and Brigade Battalion Simulation.
Adelantado and Siron (1996) describe the Air-Ground Combat Simulation application. They discuss on the multi-resolution representation of entities (patrols and aircraft’) in combat simulation.
Blais (1994) gives an outline of the hardware and software of Marine Tactical Warfare Simulation system. He explains the basic principles of designing and combat modeling approach.
Baker (2001) discusses several approaches used to model teaming within Advanced Tactical Combat Model (ATCOM) and gives the implementation issues and preliminary trends in performance and outcome of model teaming.
Sawyers (1998) explains the modeling capabilities of the Marine Corps. He describes the new Mission Area Analysis process to determine the operational requirements and deficiencies.
Childs and Lubaczewski (1987) explain a simulation model used for training the Brigade and Battalion commanders and exercising the decision-making skills. They give the background of command and control training.
Martin (1999) explains a concept for tactical development system. In this concept, the analyst is able to study tactics and change the order of steps without having to break to open the model in each step.
Table 2.1 Summary Table of Literature Review.
CLASSIFICATON PUBLICATION SUBJECT
Sisti (1996) Application of research issues in simulation to military domain
Hartley (1997) Verification and validation of military simulations
Kang and Roland (1998) Classification of simulation models for military training
Smith (1998) Basic principles of military simulation modeling Military Simulation
Garrabrants (1998) Importance of simulation in command and control of Marine combat Henry (1994) Corps battle simulation
Kruger (1992) Pitfalls in combat simulation Adelantado and Siron
(1996) Air-Ground Combat Simulation Blais (1994) Marine Tactical Warfare Simulation Baker (2001) Model teaming in Advanced Tactical Combat Model
Sawyers (1998) Operational requirements and
deficiencies in Mission Area Analysis Childs and Lubaczewski
(1987)
Training simulation of Brigade and Battalion commanders
Combat Modeling and Tactical
Simulation
CHAPTER 3
THE SIMULATION MODEL
3.1. Problem Formulation and Setting Objectives
In this thesis, the movement of an armored battalion, which emplaced next to border, from assembly area to the mobilization task area is modeled and evaluated via simulation. This mission plays a very important role due to the reason that this mission is the beginning of main combat operations such as attack or defense. It is very important for any army to be fresh and ready for the main combat operations. Besides, it is very important for the headquarter commanders who are the decision-makers and staff officers who are the planners of the operation to know the time needed for this kind of operation and the estimated casualty after this mission to decide and plan more efficiently before performing the real operation. The objectives of this study are the following:
- To evaluate the movement (transportation) of an armored battalion, emplaced next
to border, from assembly area to the mobilization task areas,
- To analyze the effects of random events (breakdowns, air attacks, artillery assaults,
minefields and ambush of the enemy or the partisans) caused by both terrain and the enemy,
- To determine the amount of time delay namely to determine the time standards of
each random event (factor),
- To test the movement under different scenarios and to find the cases where the
movement plan does not work properly,
- To perform risk management before performing the real operation.
And in this study the following research questions will be answered:
- Is the existing movement plan of the Turkish Armed Forces efficient for necessity
of rapid movement?
- Where do the bottlenecks occur in the system?
- How do the random events (artillery assault, ambush, mine fields, air attack and the
natural breakdowns) affect the performance of the system?
- How does each random event (factor) affect the total movement time and what
should be the time standards for each affecting factor?
- How much is the cost of transporting an armored battalion from assembly area to
its mobilization area by using the semi-trailers?
- What are the trade-offs between the performance measures and which decisions
make the movement more efficient?
- What is the effect of new Logistics Information System (LIS) on the system?
Our system represents the conditions of crisis or war. Thus, it is hard to find the data, which fits the real operation conditions and it is hard since the data are intelligence information.
The Data Requirements of the model are:
- Velocities of the semi-trailers, tanks and the wheeled trucks in the movement,
- Repairing time distributions of the damaged vehicles,
- The probability of occurring of each random event,
- The enemy assets and the hit and kill probabilities of each asset,
- The cost and the properties of semi-trailers, such as movement range and fuel
depot capacity,
- Average number of armored and wheeled vehicles in an armored battalion.
By examining the system in this thesis, especially the headquarters commanders which are the end users of the study will able to see how the movement of ground forces plan is working, how do the random events change the system behavior and will easily decide on the plans of the movement of the ground forces.
Assumptions:
- The movement time of the semi-trailers from their units to the loading point
(assembly area) and the loading time of the tanks and the armored vehicles on these vehicles are not considered. Because during the crisis between two countries and before the war get started these activities are done and in our study only the movement behaviors are examined.
- The road, on which the movement is executed, is either open just for the military
unit movement or the civilian traffic flow does not affect the military movement because of the traffic signalization on road by military police.
- Average velocity of the semi-trailers and the wheeled trucks are 45 km/h. as
specified in the movement order of the Turkish Armed Forces.
- Average velocity of tanks is 32 km/h. as specified in the movement order of the
- Average gap between the vehicles is 50 m. as specified in the movement order of
the Turkish Armed Forces. It varies according to terrain and enemy but 50 m. gap is used for normal marching conditions.
3.2. Model Development
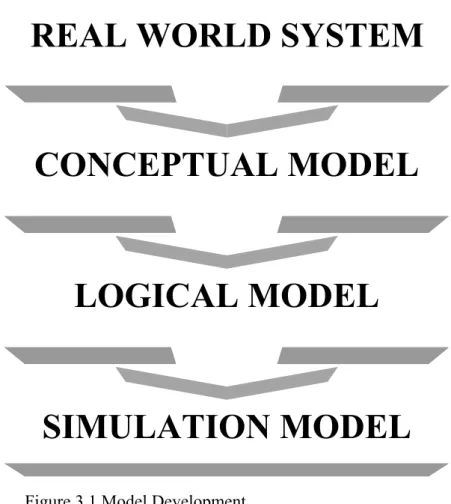
We developed our simulation model starting with the conceptual model by interviewing with both headquarter commanders which are the planners of this movement and battalion and company commanders which are the executors of this movement in theater. Then we constructed the logical model of the system. The code of the model is
then written on Arena Software. The model development is illustrated in Figure 3.1.
Figure 3.1 Model Development.
REAL WORLD SYSTEM
LOGICAL MODEL
SIMULATION MODEL
CONCEPTUAL MODEL
3.2.1.
Conceptual
Model
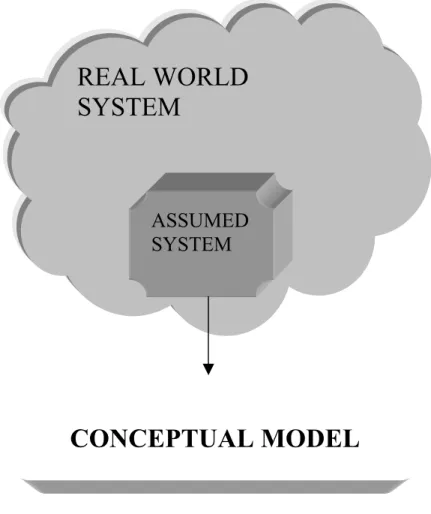
The conceptual model is written by shrinking the real world system into an assumed system with certain assumptions and then the certain characteristics and the components of the system are examined. The graphical explanation of conceptual model is given in Figure 3.2. Then the basic elements of this simulation model are determined by the certain characteristics, components and the structure of the assumed system.Figure 3.2 Conceptual Model.
CONCEPTUAL MODEL
REAL WORLD
SYSTEM
ASSUMED
SYSTEM
3.2.2. Components of the System
Entity: is an object of an interest in the system, which requires an explicit representation in the system. In our system there is only one type of entity.
- Vehicles of armored battalion.
Attributes: are the characteristics of an entity.
- The beginning time of the movement,
- Priority of the vehicles,
- Damage type that the vehicles takes,
- The ending time of the movement.
System State: a collection of variables that contains all the information necessary to describe the system at any time.
- The number of vehicles in the system,
- Status of vehicles (damaged, destroyed or safe),
-
The number idle maintenance and repairing team.Events: an instantaneous occurrence that changes the state of the system.
- The Marching Order: The march order is given to the armored battalion
from the armored brigade commandant and is the beginning of the movement from starting point (assembly area).
- Breakdowns of The Vehicles On The Road: Any vehicle of the battalion that
is broken down on the road, is immediately driven off the road and is repaired by the maintenance and repairing team.
- Artillery Assault On The Road: Any vehicle of the battalion which is
damaged caused by the artillery assault of the enemy is immediately driven off the road and is repaired by the maintenance and repairing team after the assault. If it is totally destructed it is left in a safe area with its crew.
- Air Attack On The Road: Same procedure with artillery assault.
-
Ground Mines On The Road: Same procedure with artillery assault.- Ambush On The Road: Same procedure with artillery assault.
- Repairing Of The Damaged or Broken Vehicles: Maintenance and repairing
team beginning with the armored vehicles immediately repair damaged or broken vehicles.
- Arrival of The Vehicles To The Mobilization Task Areas: Every vehicle,
which reaches the releasing point, marches immediately to mobilization task areas.
Variables:
1. Exogenous Variables: These are the input variables that are external to the model. They exist independently of the model. There are two kinds of exogenous variables:
a. Controllable Variables (Decision Variables) b. Uncontrollable Variables (Parameters)
a. Controllable Variables:
- Velocity of the vehicles of armored battalion and semi-trailers,
b. Uncontrollable Variables:
- Repairing time of broken vehicles due to the breakdowns.
- Repairing time of damaged vehicles due to artillery assault, ambushes, air
attacks and mine fields.
2. Endogenous Variables: These are the output variables that are internal to the model and are the function of the exogenous variables and the model structure. There are two kinds of endogenous variables:
a. State Variables, b. Performance Measures. a. State Variables:
- Number of vehicles waiting in the artillery assault repairing queue,
- Number of vehicles waiting in the air attack repairing queue,
- Number of vehicles waiting in the minefield repairing queue,
- Number of vehicles waiting in the ambush repairing queue,
- Number of vehicles waiting in the breakdown repairing queue,
- Number of safe vehicles in the convoy,
b. Performance Measures:
The Performance Measures of the model are:
- Maximum time-in-system (MTIS) measure of the last vehicle reaching the
releasing point,
- Number of destroyed vehicles (NODV),
- Total number of damaged vehicles,
- Average waiting time of vehicles in each random event,
- Average time in system measures of vehicles,
- Average waiting time of vehicles in the artillery assault repairing queue,
- Average waiting time of vehicles in the air attack repairing queue,
- Average waiting time of vehicles in the minefield repairing queue,
- Average waiting time of vehicles in the ambush repairing queue,
- Average time in system measure of last vehicle reaching the releasing point
(Mobilization task area),
- Number of damaged armored vehicles due to artillery assault,
- Number of damaged armored vehicles due to air attack,
- Number of damaged armored vehicles due to minefield,
- Number of damaged armored vehicles due to ambush,
- Number of damaged wheeled vehicles due to artillery assault,
- Number of damaged wheeled vehicles due to air attack,
- Number of damaged wheeled vehicles due to minefield,
- Number of damaged wheeled vehicles due to breakdown,
- Number of destroyed armored vehicles due to artillery assault,
-
Number of destroyed armored vehicles due to air attack,- Number of destroyed armored vehicles due to mine field,
- Number of destroyed wheeled vehicles due to artillery assault,
- Number of destroyed wheeled vehicles due to air attack,
- Number of destroyed wheeled vehicles due to minefield,
- Number of destroyed wheeled vehicles due to ambush,
- Number of destroyed wheeled vehicles due to breakdown,
- Total number of destroyed vehicles,
- Total number of damaged vehicles.
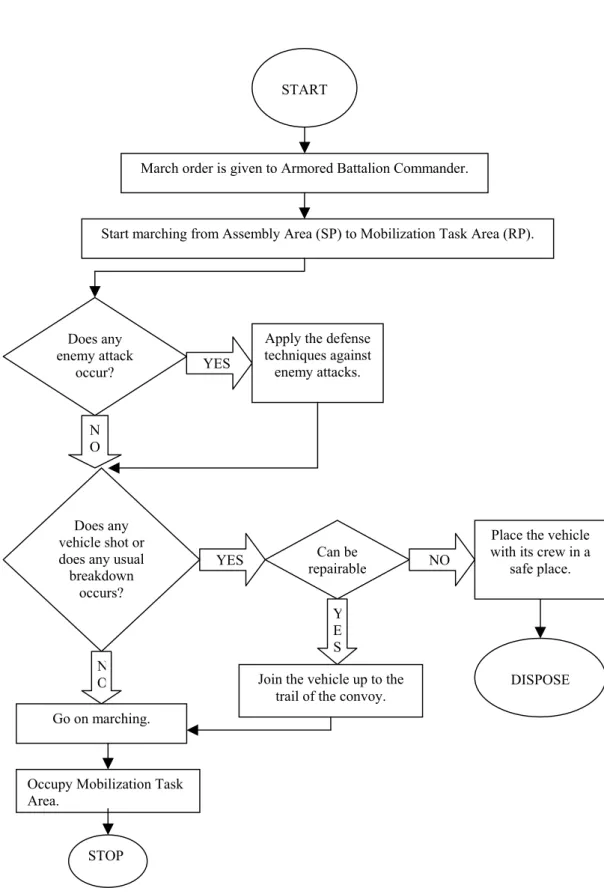
3.2.3. Logical Model (Flowchart of the System)
Logical model (flowchart of the system) shows the relationships among the elements of the model. The summary flowchart of the model is illustrated in Figure 3.3. The detailed flowchart is given in Appendix C.
The Starting Event: The announcement of movement order to battalion commander. The Ending Event: The occupation of the Mobilization Task Area.
The Main Events:
• The movement from Assembly Area to Mobilization Task Area, • The natural breakdowns of vehicles,
By Enemy: • Air attacks, • Artillery assaults, • Mines and Booby Traps, • Ambush and/or sniper fire.
By Terrain:
•
Natural breakdowns of vehicles.3.2.4. Simulation Model (Computer Code)
In this thesis we model the movement by using ARENA 3.0 Simulation Software Package. Arena Simulation Software Package allows users to create graphical models with animation and also helps its user in input and output data analysis with the output and input analyzer.
We model the movement operation in Arena 3.0 by using a Model Frame, in which we describe the components of our system and their interactions, and an Experimental Frame in which we define experimental conditions to generate specific output data that we need.
We model our system by using a process orientation in which we study the entities (vehicles of the armored battalion) that move through this system. Each entity has some attributes such as, company identification number, vehicle type, priority, etc. Firstly, we develop a description for the movement operation’s process. In developing description of
our system we define the movement operation entities. Then we describe the process through which the entities move.
We model the random events by using a block diagram, which is a flow graph that shows the process through which the entities move in the movement system. We combine standards blocks of Arena into a block diagram, which describes the random events being modeled.
The block diagram we use for modeling the random events during the movement is the static component of our model whereas the entities (vehicles of the armored battalion) are the dynamic component, that moves through the block diagram activating the random events.
We develop station sub-models, which represent each random event and then combined them to represent the overall movement operation. We use transfer blocks for transferring the entities between these station sub-models to model all the movement between stations (random events) and we use free-path transporters to model the entity transfer between station sub-models. Each entity is transported with a free-path transporter.
We define a transporter’s system map by specifying travel distances between all stations that free-path transporter may visit. Besides, we specify the movement velocity (32 km/h. or 45 km/h.) as the velocity of the free-path transporters.
We model the breakdowns caused by random events by using conditional and probabilistic branches in station sub-models. We define the maintenance and repair team as
resources that are allocated to vehicles waiting to be repaired. Finally, we collect the statistics that we need by collecting the observational and time-dependent data from our model.
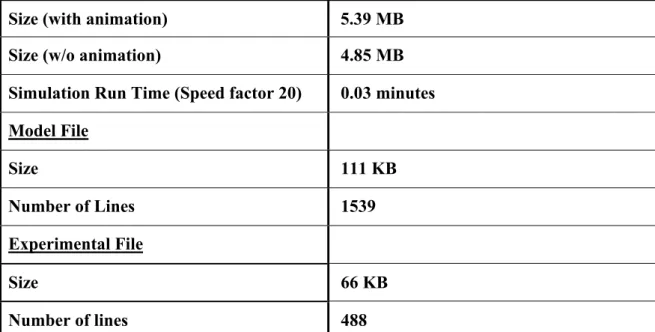
The details about the computer code are given in Table 3.1. Some part of the computer code is given in Appendix B.
Table 3.1 Technical Information About Simulation Model.
Size (with animation) 5.39 MB
Size (w/o animation) 4.85 MB
Simulation Run Time (Speed factor 20) 0.03 minutes Model File Size 111 KB Number of Lines 1539 Experimental File Size 66 KB Number of lines 488
Figure 3.3 General Flowchart of the System.
March order is given to Armored Battalion Commander.
Start marching from Assembly Area (SP) to Mobilization Task Area (RP).
YES Does any
vehicle shot or does any usual breakdown occurs? START Does any enemy attack occur? YES
Apply the defense techniques against enemy attacks.
Can be
repairable NO
Place the vehicle with its crew in a
safe place.
Y E S
Join the vehicle up to the trail of the convoy. N
O DISPOSE
Go on marching. N
O
Occupy Mobilization Task Area.
3.3. Input Data Analysis
The input data we collected in our simulation model are from the following sources:
1. KKT 190-1 (A) Manevra ve Tatbikatların Sevk ve İdaresi (July 1998), 2. KKYY 315-1 Kara Harp Silah Araç ve Gereçleri (July 2000),
3. Database of JANUS Software,
4. Staff Officers and Armored Battalion Commanders, Tank Company Commanders: Since these personnel are the planners and the executors of this type of an operation, they are experts on this subject. We are lack of some of real life data due to the reason that there is no opportunity to collect the wartime data. So we interview with these experts and collect data of some activities.
Since we are lack of some real life data, we convert the data, which we collected by interviewing the experts, into triangular distribution as recommended by Banks (1998), and Smith (1998).
There are totally 69 variables in our model. 49 of these variables are random variables. The list of the input data we use in our model is given in Appendix D.
3.4. Model Verification And Validation
3.4.1. Verification of the Model
We use the following techniques:
• ARENA Run Controller: ARENA Simulation Software Package has a run controller function, which allows users to monitor and control model execution. The run controller is designed for searching for errors in the model and performing walkthroughs during verification. We use ARENA run controller to verify our model.
• Model and Experiment Walkthroughs: We conduct model and experimental walkthrough with the officers from our department who are familiar with the system and ARENA programming language.
• Test Runs: We perform test runs to exercise the model under different and extreme conditions by using extreme parameter settings, such as increasing the number of vehicles in the system, increasing the rate of occurrence of breakdowns, reducing the service rate of maintenance and repairing team, etc.
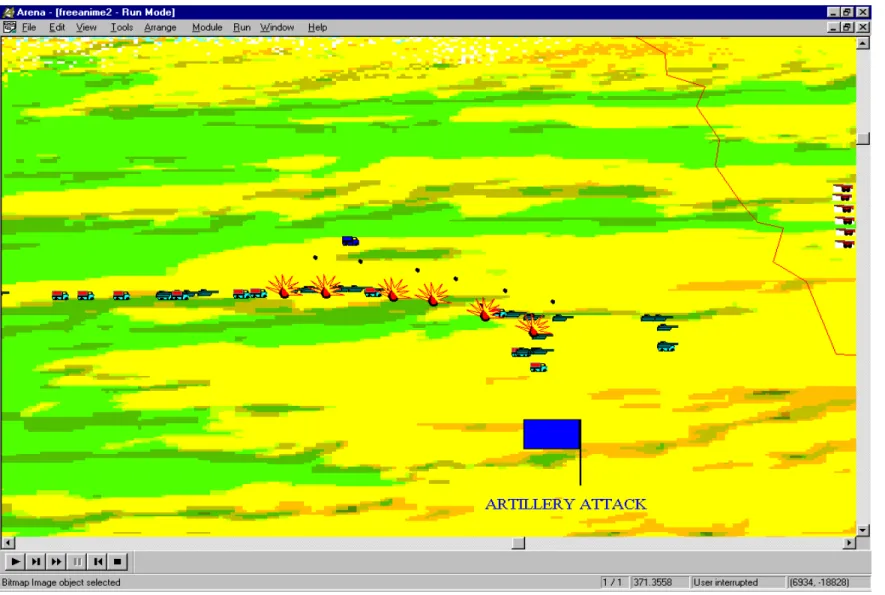
• Animation: Animation is a more powerful verification aid than the other techniques since it has the capability to show the moving pictures of the many events during the simulation process. We use animation to see all the interactions simultaneously and to correct the errors. A screenshot from our model is given in Figure 3.4.
•
Statistical Data: ARENA Simulation Software Package enables us to build modeland conduct statistical analysis to make some inferences about the system we modeled. We use this feature of ARENA, which collects statistics automatically.
3.4.2. Validation of the Model
3.4.2.1. Tests for Reasonableness
• Continuity: We make some small changes in our model to test whether these changes in the input variables cause small changes in the outputs or not, not in the magnitude but in the direction. For instance, we increase the number of vehicles of the armored battalion, and we see that the average waiting time of the vehicles in the repair queue increases.
• Consistency: We change the random-number seeds and take some runs to test whether our model yields similar results by making similar runs or not. We reach the almost the same results after changing the random-number seed. • Degeneracy: We test our model by decreasing the number of technicians in the
maintenance and repairing team, namely by removing some features of the model, and observe if our model respond to removals. We observe that by decreasing the capacity of technicians (removing a few technicians) from the system, time-in-system performance measure increases.
3.4.2.2. Model Structure and Data Tests
•
Face Validity: This technique is used to validate the correctness of the logic inthe model and performed by asking persons familiar with the system. We perform face validity by interviewing with armored battalion and tank company commanders who are the executors of this operation. Also, we consult the conceptual model, logical model and assumptions with the training officers and NCO technicians in Armored Units School and Training Division Commandant, Ankara, Turkey, who are the experts on the movement operation of armored units, from the beginning of building the model to the end of interpreting the outputs.
•
Sensitivity Analysis: This technique is achieved by observing the behavior ofthe model caused by small changes in the model’s parameters. We make some changes in our model’s parameters and see how these changes affect the behavior of the model. We see that slight changes in the parameters do not conflict with our expectations of the movement operation due to the reason that these changes do not produce different decisions.
CHAPTER 4
Design and Analysis of Experiments
The design of experiments is a powerful tool to design and evaluate experiments for the purpose of estimating how changes in input variables affect the output variables (response). This tool helps us to understand the reasons of changes in the response caused by changing input variables, to have more information on system behavior and to improve the system performance. Since our aim is to understand the behavior of the movement operation, we can use experimental design to characterize our system.
4.1. Comparative Experiments
The main idea in comparative experiments is to compare two systems, scenarios or conditions. As we mentioned in Chapter 1, there is not enough number of semi-trailers to transport armored vehicles of all battalions next to any border at once. Armored vehicles of some battalions are transported while armored vehicles of remaining battalions march to their mobilization task areas on foot. Thus, we have two scenarios:
Scenario 1. All vehicles of the armored battalion march on foot,
Scenario 2: Semi-trailers transport armored vehicles of the armored battalion while wheeled vehicles of the armored battalion march on foot with semi-trailers.
We have also three cases for these scenarios. These cases are the following:
• Best Case (Case 1): There is no retarding event of enemy (air attack, artillery attack, ambush and mine). There is only breakdown of vehicles with certain probability as a stochastic event.
• Most Possible Case (Case 2): All retarding events of enemy forces and breakdown of vehicles are involved with certain probabilities.
• Worst Case (Case 3): All retarding events of enemy forces are involved with probability 1 and breakdown of vehicles is with certain probability. The critical point is probability of occurrence 1 does not mean that all these events damage or destroy vehicles. For example, enemy artillery attack occurs with probability one; but if the artillery concentration is ahead or behind the convoy none of the vehicles is damaged or if the mine is noticed there will be no loss.
We can now make comparative experiments with these scenarios. But, first of all we should start with determining the sample size to achieve the desired accuracy to make correct estimations on true unknown parameters that we want to estimate and to compare these scenarios with a sufficiently small experimental error.
4.1.1. Determination of Sample Size
Determining the sample size is an important part of experimental design to achieve the desired accuracy on the estimates and to have a sufficiently small experimental error.
We perform the Sequential Procedure (Law and Kelton), with the absolute precision criterion to determine the sample size as follows:
Sequential Procedure:
1st Step: Make no replications n= no
2nd Step: Compute X(n)and δ(n,α)
Where
∑
= = n i i X n n X 1 1 ) ( and δ(n,α) = tn-1, 1-α/2 s2(n)/n.3rd Step: If δ(n,α) < β, stop; else, n=n+1 and go to 2nd Step.
We have two performance measures:
1. Maximum time-in-system (MTIS) measure of last vehicle reaching the releasing point (mobilization task area).
2. Total number of destroyed vehicles (NODV) during the movement.
We consulted with the staff officers and armored battalion commanders and specify that for the first performance measure β=15 minutes and for the second performance measure β=5 vehicles of absolute precision is normal with %95 accuracy.
We computed the sample sizes for two performance measures according to these scenarios and under these cases. The results are given in Appendix E.
4.1.2 Building Confidence Intervals
After determining the sample size we need, now we build confidence intervals on the means of our performance measures. Table 4.1 and Table 4.2 show the summary results of confidence intervals for MTIS and NODV respectively.
Assuming that µ is the true unknown parameter that we want to estimate; to build a confidence interval we need to find the upper limit (U) and the lower limit (L) statistics such that P (L ≤ θ ≤ U) = 1-α is true. In our case α = 0.05.
• 100(1-α) % Confidence Interval for the Mean of MTIS
Table 4.1 Summary Table of 100(1-α) % Confidence Interval for MTIS.
# of REP. MEAN VARIANCE LENGTH HALF- L U
CASE 1 5 193.58 66.344 10.126 183.454 203.706 CASE2 7 261.943 229.633 14.032 247.911 275.975 SCENARIO 1 CASE3 13 303.284 614.867 14.99 288.294 318.274 CASE1 5 149.138 42.717 8.12 141.018 157.258 CASE2 5 201.506 63.701 9.922 191.584 211.428 SCENARIO 2 CASE3 5 241.372 50.156 8.804 232.568 250.176
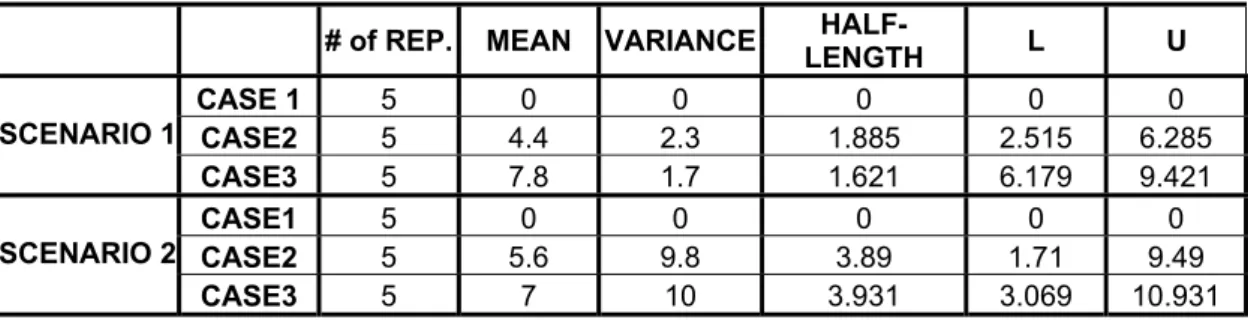
• 100(1-α) % Confidence Interval for the Mean of NODV
Table 4.2 Summary Table of 100(1-α) % Confidence Interval for NODV.
# of REP. MEAN VARIANCE LENGTH HALF- L U
CASE 1 5 0 0 0 0 0 CASE2 5 4.4 2.3 1.885 2.515 6.285 SCENARIO 1 CASE3 5 7.8 1.7 1.621 6.179 9.421 CASE1 5 0 0 0 0 0 CASE2 5 5.6 9.8 3.89 1.71 9.49 SCENARIO 2 CASE3 5 7 10 3.931 3.069 10.931
4.1.3. Comparison of Alternative System Design
Comparison of alternative system designs is one of the important uses of simulation. We can compare two alternative scenarios, different operating policies, alternative production plans or different system designs by the help of simulation.
In our model, as we mention we have two scenarios (Scenario-1 and Scenario-2). In Scenario-1 armored battalion march on foot whereas in Scenario-2 all armored vehicles of the battalion are transported on semi-trailers. In Scenario-1 the velocity of the convoy is 32 km/h. and in Scenario-2 the velocity of the convoy is 45 km/h. It is intuitively expected that Scenario-2 is better than the Scenario-1 for the maximum time-in-system (MTIS) performance measure. Because the velocity of the convoy in Scenario-2 is higher than that of Scenario-1. But, there is a fact that the wheeled vehicles are more vulnerable to enemy attacks than the armored vehicles. Therefore, the probability of being damaged for wheeled vehicles is higher than that of armored vehicles. This means that, there may probably be more damaged vehicles when there are more wheeled vehicles in the convoy and this causes more repair time. In Scenario-1 there are 67 armored vehicles and 86 wheeled vehicles whereas in Scenario-2 all 153 vehicles are wheeled because all armored vehicles are transported on semi-trailers. Thus, this fact has an adverse effect for MTIS measure in Scenario-2.
We cannot intuitively decide whether Scenario-2 is better than Scenario-1 under these conditions unless we perform the movement under war conditions and observe behavior of the system. Therefore, we use simulation model of movement operation.
We run our simulation model and obtain the results of two scenarios under best, most possible and worst cases. Our aim is to decide whether there is a statistically significant difference between two scenarios. Since maximum number of replication needed to achieve desired accuracy is 13 we make our computations based on 15 replications. We compare the corresponding cases in these two scenarios, i.e. Scenario-1 best case vs. Scenario-2 best case. We use Paired-t Test for comparing these scenarios.
Let Xi and Yi be the results of the ith replication of Scenario-1 and Scenario-2
respectively. And let Zi be the difference of Xi - Yi and let n be the number of replications.
Average of differences is, Z (n) =
∑
=n
i
n 1
1
Zi and variance of differences V(Z(n)) = n Z V( i) where V(Zi)=
∑
= − − n i i Z Z n 1 2 ) ( 1 1 .100(1-α) % CI for the mean of differences is;
Z(n)±tn−1,1−α/2 V(Z(n)).
We can state our hypothesis testing as follows:
Ho: Z (n) = 0
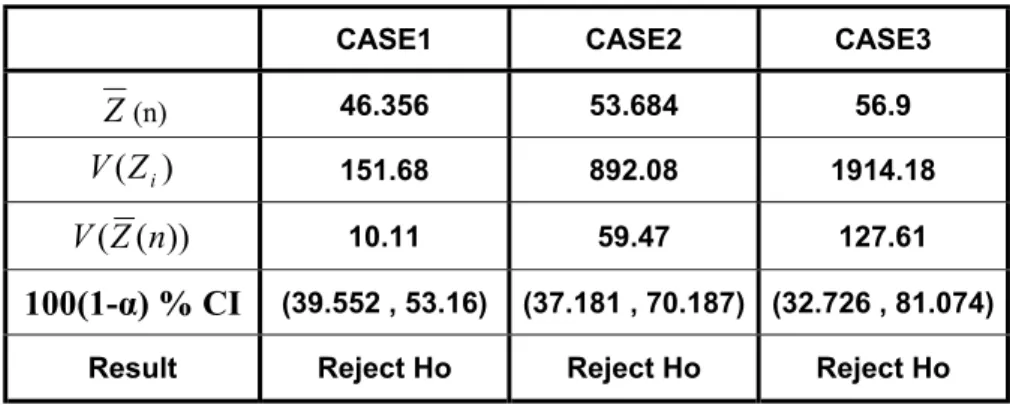
• Paired-t Test for MTIS
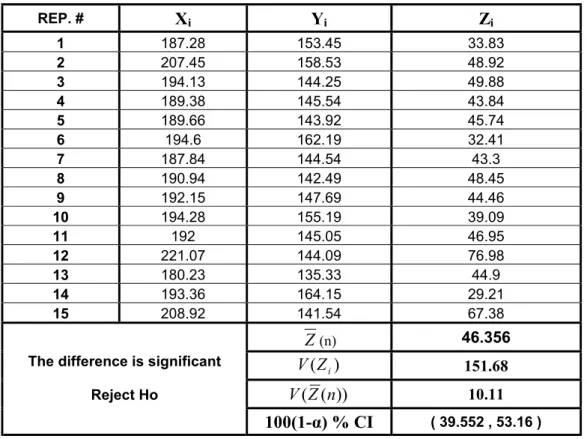
Case 1 (Best Case):
Table 4.3 Results of Paired-t Test for the Best Case.
REP. # Xi Yi Zi 1 187.28 153.45 33.83 2 207.45 158.53 48.92 3 194.13 144.25 49.88 4 189.38 145.54 43.84 5 189.66 143.92 45.74 6 194.6 162.19 32.41 7 187.84 144.54 43.3 8 190.94 142.49 48.45 9 192.15 147.69 44.46 10 194.28 155.19 39.09 11 192 145.05 46.95 12 221.07 144.09 76.98 13 180.23 135.33 44.9 14 193.36 164.15 29.21 15 208.92 141.54 67.38 Z(n) 46.356 ) (Zi V 151.68 )) ( (Z n V 10.11
The difference is significant Reject Ho
100(1-α) % CI ( 39.552 , 53.16 )
We give the results of Best Case in Table 4.3. We compute the results of remaining cases and give the summary table of our findings in Table 4.4 and the data lists we use in Paired-t Test are given in Appendix F.
The results we present in Table 4.4 show that the difference between two scenarios for MTIS performance measure is statistically significant. Consequently, we can say that Scenario-2 is better than Scenario-1 for MTIS performance measure since the purpose is to minimize the MTIS.
Table 4.4 Summary Table of Paired-t Test Results for MTIS.
•
Paired-t Test for Number of Destroyed VehiclesWe apply Paired-t test for our second performance measure to determine whether there is a statistically significant difference between two scenarios for each cases or not. The results are given in Table 4.5 and the data lists we use in our computations are given in Appendix E.
Table 4.5 Summary Table of Paired-t Test Results for NODV.
CASE1 CASE2 CASE3
Z(n) 0.07 0.903 0.867 ) (Zi V 0.07 11.209 7.267 )) ( (Z n V 0.004 0.747 0.484 100(1-α) % CI (-0.065 , 0.205) (-2.78 , 0.92) (-0.618 , 2.358) Result Do Not Reject Ho Do Not Reject Ho Do Not Reject Ho
When we observe the Table 4.5 we can easily state that there is not a statistically significant difference between two scenarios for number of destroyed vehicles. It is an
CASE1 CASE2 CASE3
Z(n) 46.356 53.684 56.9 ) (Zi V 151.68 892.08 1914.18 )) ( (Z n V 10.11 59.47 127.61 100(1-α) % CI (39.552 , 53.16) (37.181 , 70.187) (32.726 , 81.074)
expected result, because tank-carrying vehicles are not armored and have no feature to protect the vehicles, which they carry, they are used to transport the armored vehicles just to speed up the movement. Therefore, it is normal that there is not a significant difference between two scenarios for the second performance measure.
4.2. 2
kFactorial
Design
Factorial designs are widely used in experiments involving several factors where it is necessary to study the joint effect of the factors on a response (Montgomery, 1992). Factorial design is useful strategy, which allows each factor to assume only two levels i.e. high (+) and low (-). In factorial design 2k possible factor level combinations are investigated in each complete trial of experiment.
In our study we apply 2k factorial design to find main effects and interactions between factors according to our performance measures. Before conducting the 2k factorial design, we validate the following assumptions:
1. The designs are completely randomized.
To ensure the randomization of design points we used different seeds for each design point.
2. The factors are fixed.
In this study we have five different fixed factors with two levels i.e. high (1) and low (0). The factor descriptions, low and high levels of factors are given in Table 4.6.