A GIS-AIDED FREQUENCY PLANNING TOOL FOR TERRESTRIAL BROADCASTING AND LAND MOBILE SERVICES
SATILMI$ TOPCU, HAYRETTIN KOYMEN, AYHAN ALTINTA$, iR$ADI AKSUN
Communications and Spectrum Management Research Center riSYAM), Bilkent University, Bilkent, Ankara, Turkey
1. Introduction
Radio provides an important technology for emergency preparedness and emergency response. It not only offers rapid communication for emergency workers within the disaster area, but also affords the means of disseminating early warning of disasters and advice on how to respond to the public, and a means of monitoring of events and follow-up work in the wake of a disaster. Effective telecommunications are thus a vital part of emergency planning and response (Cate 1994, DHA 1995, Mulilis 1995, Zimmerman 1997). How well radio-based systems work, however, depends on a range of factors, including their geographic coverage, their population coverage, their field strength and their received power level. All these factors are highly dependent upon terrain. Moreover, due to the growing demands on the radio-frequency spectrum, there is a need to improve spectrum management techniques. The increase in the shared use of spectrum among administrations requires the use of more complex analysis methods. The efficient solution of spectrum management problems depends upon data storage and analysis capabilities, and consequently requires the application of computer-aided techniques for data
157
D.J. Briggs et al. (eds.), GISfor Emergency Preparedness and Health Risk Reduction, 157-171. ©2002 Kluwer Academic Publishers.
management and frequency assignment. For this purpose, advanced Automated Spectrum Management Systems need to be developed to meet effectively the requirements of spectrum management, to handle spectrum management data and to add the capability of using digital terrain data for specific engineering calculations (ITU-R Rec. SM.1370 1998). Geographic Information Systems (GIS) provide important and powerful tools in this context.
In this chapter, we present spectrum engineering tools used to assist in the frequency assignment and planning of digital and analogue broadcasting and land mobile services, with the help of GIS. These tools are implemented as a part of the National Frequency Management System that has been developed for the administration of Turkey. We focus on the analysis and planning of the terrestrial Digital Audio Broadcasting (T-DAB) and Digital Video Broadcadsting (DVB-T) services. In contrast to traditional analogue broadcasting, using a Single Frequency Network (SFN) of DAB or DVB systems, one can distribute a broadcast program over all transmitters in the network within the same frequency block. In such a SFN, all the multiple delayed versions of signals arriving at the receiver are effectively combined, yielding a network gain to obtain a received signal of significantly higher quality than in conventional single-transmitter systems. Interference may occur due to the signals coming from the transmitters in the same network but arriving later than the guard interval (self-interference) or due to the signals coming from other networks operating at the same frequency band (external interference).
2. Propagation prediction methods·
Propagation models are available for a wide range of complexity, accuracy, and input requirements. Comparisons between different prediction methods have been performed in a number of previous studies (e.g. Fontan 1995, Prasad 1997). In this study, various propagation models recommended by the International Telecommunication Union (ITU) and others, with proven accuracy, are implemented to estimate the field strength, received power level and transmission loss. The models employed here cover the frequency bands being currently used for both broadcasting services and land mobile services as well as other radio services, from VLF to UHF and higher frequencies. In order to allow predictions of the useful and interfering signals, calculations for different time and location percentages can be done. Empirically gained attenuation correction terms are also added to take account of the ground cover loss at the receiver site.
Propagation prediction schemes include ITU curves with change of height (6hl, clearance angle correction, mixed path calculations and other suggested modifications for VHF-UHF bands (ITU-R Rec. P.370 1995). In addition, multiple diffraction is accounted for by following the ITU Recommendation 526 (ITU-R Rec. P.526 1997) and by Epstein-Peterson (Epstein and Peterson 1955), Deygout (Deygout 1991) or Vogler (Vogler 1982) methods. For urban areas and higher frequencies, Okumura-Hata (Hata 1980) and ITU Recommendation 1146 models (ITU-R Rec. P.1146 1995) are implemented, respectively. For lower frequencies, standard programs developed and distributed by ITU are utilized.
1.5 .---~---;__---_______, 40.0 IU.O 20.0 30.U Distance (km) J.U ' - - - ' - - - ' o.U 104 1,1
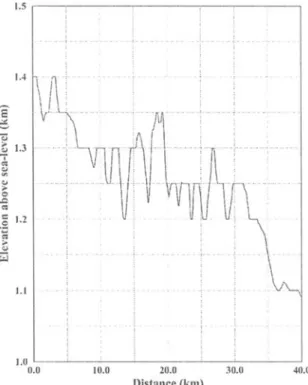
Figure 1. Terrain profile above sea-level from TX (N 39° 30' 30", E 32° 37' 45") in the 180° azimuthal direction
Because of the complicated mountainous landscape of Turkey, a special study has been performed to compare the predictions of different methods when applied to real terrain. Figure 1 shows a real terrain profile away from a transmitter which has an effective radiated power (ERP) of 1 kW at f
Elevation Data) Level 1 format, which has a resolution of 3 by 3 arcseconds. There also exist Level 2 format DTED with a resolution of 1 by 1 arcseconds. Whenever more detailed analysis is needed in a local area, the Level 2 format DTED can be utilized. However for a country-wide study, this elevation data requires extremely high computation time. In addition to elevation data, various vector and raster spatial data are also used in the system. These are vector data including administrative boundaries, roads, gazetteer data and raster data such as scanned map images. The demographic data, frequency assignment data and licence holder data are stored and retrieved from the integrated database. For the purposes of accuracy in the frequency assignment and planning process, the coordinate information of licensed radio stations must be completed correctly, for otherwise the results of propagation simulation and interference analysis will not be reliable.
140.0 120.0 100.0
e
....
>- 80.0 :::l ;:0 "Q W 60.0 40.0 20.0 0.0 0.0 - nR ... C(IR' Ilh 0.110 b- - - rCIRnl.h C.lrllnanc(' ..\1111("Co(r. - - CCLR with EpJU·jn-l"·1tr10n - ... r(;IR "llh\·.~I<r(,-0.61
... CCIR with DeYJ:oul
10.n 20.0 30.0 4(1.0
Disl'ance (kill)
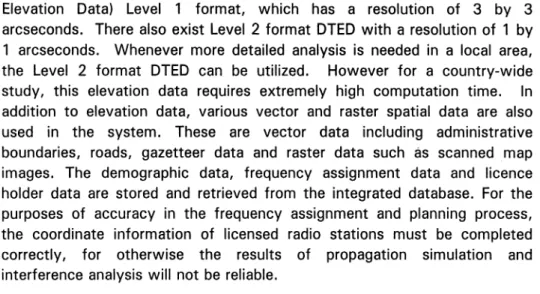
Figure2. Comparison of the field strengths predictedbydifferent corrections to lTV curves
Particular attention has been paid to various methods available for VHF and UHF bands. As seen in Figure 2, ITU curves yield generally higher field
strength predictions. Although inclusion of boh correction improves this, it is not to a satisfactory level due to neglect of shadowing in the immediate lee of hilltops. This can be accounted for by the inclusion of clearance angle correction. Multiple diffraction models such as Epstein-Peterson, Deygout or Vogler are intended for better prediction of diffraction loss. The shadowing effect is similarly predicted by all of the diffraction models, but they differ more in the average signal level, as shown in Figure 2. Note that Epstein-Peterson tends to over-predict while the Vogler method tends to under-predict the average signal level. However, simplicity in applying the Epstein-Peterson method may make it more favourable for some applications.
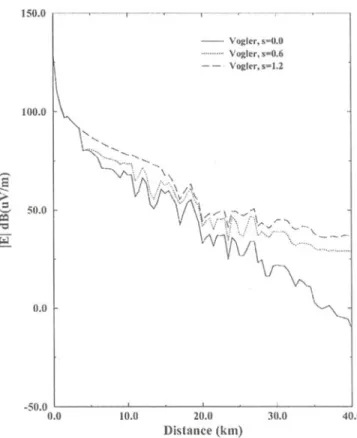
It is noted that the Vogler method does not specify how to chose significant knife-edges from the terrain elevation data. To solve this problem, an original selection procedure has been developed that accounts for both the distance and the depth of the valleys between local terrain maxima considered as potential knife-edges. Since accounting for too many maxima leads to gross overestimation of the losses, a flexible selection criterion has been introduced. The selection parameter
s
is the fraction of the Fresnel zone used for making the decision whether two adjacent local maxima should be accounted either as two different knife-edges or as a single dominating knife-edge. The decision is made by the rule that two maxima are distinguished if there is a point in the valley located outside the fractions
of the Fresnel zone connecting the maxima. Alternatively, the maxima are not distinguished if the whole valley is located inside the given fraction of the Fresnel zone. The comparison of the field strength values using differents
values is shown in Figure 3. Note that s = 0 is the case when all the local peaks are accounted for as different knife-edges. This yields lowest values of the field strength. For practical purposes,s
=
0.6 seems to be satisfactory.As seen from the above discussions, large-scale field strength prediction models may yield substantially different results. The factors affecting the decision of which model to choose depend on the type of landscape, services and frequency band, but may not be totally based on technical concerns. Some government regulatory bodies may prefer to impose one particular model.
150.0 ,---~--.----~--,---r - - ~ - Vo!:l.r,.aU.U _ VOJ:I.r••-0.6 - - VOJ:I.r.s-I.Z 100.0 .-. I:
;;
::l Qi' 50.0 "::l '-l 0.0 40.0 30.0 10.0 -50.0 '---~---'---~---'---~----~---' 0.0Figure3. Comparison of the field strengths predicted by the Vogler method with different selection parametersvalues
3. Analogue broadcasting and land mobile services
The propagation simulations can be performed with any of the models described in Section 2, above, and the type of simulation can be designed either as a coverage study or link study. Depending on the type of radio services, the study files generated by simulation of the propagation model are processed to find coverage or interference areas. to calculate link availability, to complete frequency planning and assignment procedures, or to guide international coordination with neighbouring countries. Any coverage or interference contour for a transmitter operating in broadcasting or land mobile service can be displayed on the map. One can directly determine the size of the coverage area or interference area and evaluate other useful data such as the population inside these regions. All these operations require the integration of various databases into the software.
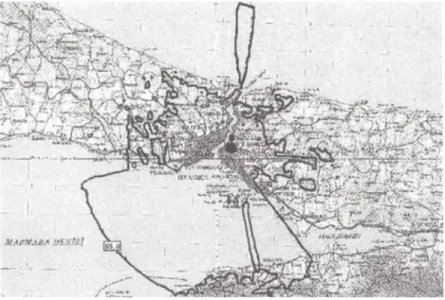
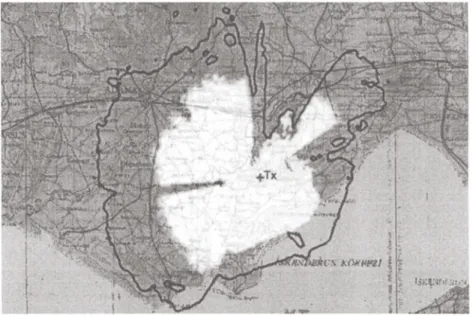
In addition, it is deemed to be necessary to integrate the software with a GIS in order to enable display of the simulation results together with the maps and any other spatial data such as roads, boundaries, etc. As an example, Figure 4 shows the coverage area of an analogue TV transmitter in Istanbul on the map background. The population covered by this TV station is calculated as 7125501 in a coverage area of 4037 square kilometre. This simulation is carried out by using ITU curves and the effect of terrain is accounted for by using the reflection and multiple diffraction technique in which Epstein-Peterson prediction model is exploited.
Figure 4. Coverage contour (65 dBuV/m) of 9amhca, istanbul (N 41° 01' 40", E 29° 04' 08") analogue TV station at UHF IV band with 37 dBW effective radiated
power
In the land mobile service, the coverage and interference areas are evaluated similarly as in the analogue broadcasting service except that the receiving antenna height above ground level should be taken as 1.5 or 2 metres in the land mobile, whereas it is taken as 10 metres in analogue broadcasting. A study result for a land mobile base station operating at 150 MHz with 25 Watt ERP in Adana is given in Figure 5. The coverage area is surrounded by -90 dBm contour defined by a dark line. Throughout this area, the mobile unit can receive the signals transmitted by the base
unit. However, the base unit may not receive the signals coming from the mobile. Therefore, in order to determine a more realistic service area of a land mobile circuit consisting of one base unit and several mobile units, one should evaluate the talk-back range of the mobile. In the talk-back region shown as highlighted in Figure 5, both the base and mobile units can communicate with each other.
Figure5. Coverage contour (-90 dBm) of Adana (N 36°49' 35",E 35°37' 53")
land mobile base station and the talk-back region of a mobile station operating in the same circuit
4. Digital broadcasting services
The software described here can calculate the useful (wanted) and interfering (unwanted) signal levels for a SFN as well as the network gain, protection ratio and coverage probability at all points in the study area defined by the user. It can also determine the coverage area or service area where the radio service with sufficient signal quality is provided while keeping the interference under a specified level. The service area is obtained by finding the regions where the coverage probability is higher than 95 %for DVB and 99 %for DAB.
[1J 4.1 COVERAGE PROBABILITY
The calculation of the coverage probability is split into three parts: calculation of the useful sum field strength, calculation of the interfering sum field strength and evaluation of the coverage probability. For the first two parts, to perform the summation of wanted and unwanted field strengths, several approaches have been reported in the literature (Beaulieu 1995). The location variation of a single field strength is modelled by a log-normal distribution with a standard deviation of 5.5 dB. For determining the power sums of log-normallly distributed stochastic variables, we use the k-LNM approach. The k-LNM approach is an approximation method for the statistical computation of the sum of distribution of several log-normally distributed variables (EBU Doc. BPN005 1997, EBU Doc. BPN003 1998). The method is based on the assumption that the resulting sum distributions of the wanted and unwanted fields are also log-normal, the mean values and standard deviations of which are taken to be identical with those of the true sum distribution. The k-LNM approach is a modified version of the standard LNM obtained by introducing a correction factor to improve the accuracy in the high probability region. This procedure can be performed analytically. Suppose that there are given
n
logarithmic fields Fi with Gaussian distribution, i.e., the corresponding powers are log-normally distributed. The task is to determine the approximate log-normal distribution of the power sum, or equivalently, to find the parameters of the Gaussian distribution of the corresponding logarithmic sum field as follows:1. Transform Fiand Oi,i= 1 ...
n,
from dB scale to Neper scale:1
F
Neper=
10*
F
dB log 10(e)2. Evaluate the mean values Miand the variancesSf of the
n
fields: 2 F;+~M.
=e
2 I - 2 (2 ) Sj2=
e2Fi+IYi*
\e IY ; -1i
= 1. ..
n
i=
1... n [2J [3J3. Determine the mean value M and variance Sf of the sum field
strength distribution:
"
S2
=L
S/
;=\
[5J 4. Determine the distribution parameters Fr. and
Ot
of the approximatelog-normal sum distribution:
5.
(72
F
k=
In(M
) __
k2
l7i
=
J+
~
22+
J)
where k is a correction factor in the range 0 ... 1. Transform Fr. and Or. from Neper scale to dB scale:
F
dB = 10 log 10(e)*
F
Neper[ 6J
[7J
[8J where Fr. and Or. are the mean value and the standard deviation of the Gaussian distribution of the logarithmic sum field, respectively. The k-LNM method suffers from the drawback that the correction factor
k depends on the number, the powers and the variances of the fields being summed. To obtain optimal results, an interpolation table would be necessary, which is not suitable for an heuristic approach such as k-LNM. For the sake of simplicity, we have chosen an average value of k=O. 7
since the standard deviations of the individual fields are small.
Evaluation of the coverage probability is performed by multiplying the probability that the useful sum exceeds a specific value by the probability that the difference between the useful and interfering sums exceeds a specific protection ratio. For determining the coverage probability, different approaches are presented in (Mokhtari 1997 and Ligeti 1999).
4.2 EXAMPLES
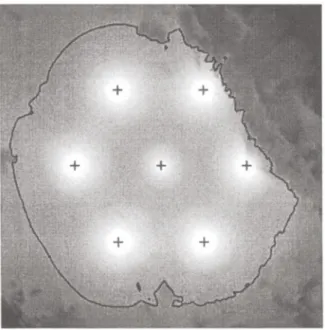
To illustrate this methodology, we have performed a case study of single frequency network (SFN) of digital video broadcasting (DVB-T) in Konya lowland of Turkey which has a relatively flat terrain. The SFN consist of six stations located at the corner positions of a hexagon. which has edges of 27 km long plus one station at the centre of the hexagon. The station at the
Figure 6. Useful sum-field strength levels in the service area of a 7-station SFN in DVB-T
Figure 8. The required minimum field strength contour (outer) and95 %coverage probability contour (inner) on the coverage probability levels for a 7-station D VB- T
cell structure
centre radiates 100 Wand the remaining six stations on the corners of the hexagon cell radiate 1 kW each. The stations are separated by 27 km and their operating frequency is 826 MHz.
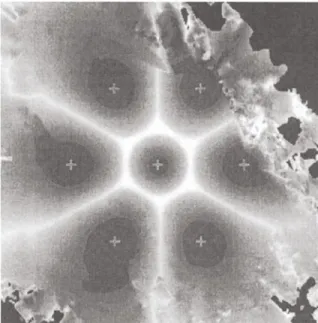
Figure 6 shows the useful signal levels and the 48 dB(uV/m) contour that corresponds to the minimum required field strength for the SFN. The locations of the seven DVB transmitters are marked with a plus sign in the plot. Figure 7 shows the network gain obtained by summing the wanted field strength values from individual transmitters. Note that the network gain becomes higher at the mid-points between two corner transmitters and it reaches the highest values at the points that are equi-distant to three transmitters. In Figure 8, the coverage probability levels with the 95 % coverage probability contour are shown. In addition, the minimum field strength contour is also drawn in Figure 8. It is noted that the 95% coverage probability contour is completely inside the minimum required field strength contour due to the fact that some transmitters behave as interferers in the region surrounded by these two contours.
5. Applications to emergency preparedness
Telecommunication is an essential and integral part of emergency preparedness. It is well-known that wireless communication can be much more effectively utilised in an emergency situation than the wired infrastructure to offer a way of improving co-ordination of emergency evacuation and humanitarian aid. Wireless communication can also be configured quickly following an emergency situation due to the possibility of transportable base stations or relays. In both wired and wireless communications, the selection of locations of relay stations is fundamental for obtaining the best coverage and maximum efficient use of resources. Therefore, it is important to have an efficient propagation simulation and frequency-planning tool. GIS clearly have an important role to play in this respect. GIS-based models help to analyse the situation and, through simulations, enable the coverage zones and most suitable relay station locations, if needed, to be mapped.
In addition, these analyses can be further enhanced if a database of human resources, road, electricity, medical facilities infrastructure and other mobile emergency facilities are available. These data can be coupled into the tool in order to optimise population coverage, and to optimise the network design in relation to the facilities that need to be used as part of the emergency response. An example of this has been outlined in Section 3, above, where the population living in the coverage zone of a transmitter is calculated through the census database. Many other possible scenarios can be envisaged for such database integration in emergency preparedness. In particular, one may be interested in keeping in touch with the emergency vehicles on main transportation routes during an emergency. These routes can be identified and best possible transmitter locations can be determined for emergency preparedness through propagation simulations. For such a problem, the goal is to illuminate the main transportation routes continuously by way of transmitters located along the route.
6. Conclusions
A propagation prediction and planning software tool for broadcasting and land mobile services has been developed. The tool is integrated with various databases within a Geographic Information System. Through tHe use of real terrain data for Turkey, various propagation loss models are implemented and comparative results are reported. In addition, analysis and
planning techniques for broadcasting, especially digital, and land mobile services are presented with some illustrative examples.
Since radio provides an important technology for emergency preparedness and emergency response, a versatile propagation simulation and frequency planning tool is a necessary ingredient. Possible scenarios for the application of a frequency planning tool in the emergency preparedness and emergency response is also presented. It is noted that the success of a frequency planning tool is also dependent on the availability of accurate and reliable spatial, demographic, administrative and technical data sources.
References
Beaulieu, N.C., Abu-Dayya, A.A., and MvLane, P.J. (1995) Estimating the distribution of a sum of independent log-normal random variables. IEEE Transactions
on Communications43(12),2869-2873.
Cate, F.H. (ed.( (1994) International Disaster Communications: Harnessing the
Power of Communications to Avert Disasters and Save Lives. The Annenberg
Washington Program in Communications Policy Studies of Northwestern University, Washington, D.C..
Deygout, J. (1991) Correction factor for multiple knife-edge diffraction. IEEE Transactions on Antennas and PropagationAP-39, 1256-1258.
DHA, United Nations Department of Humanitarian Affairs (1995) The vital role of emergency telecommunications in disaster relief and mitigation. DHA Issues in Focus Series, No.2, Geneva.
Eipstein, J. and Peterson, D.W. (1955) An experimental study of wave propagation at 850 MC. Proceedings of Institute of Radio Engineering 41, 595-611.
European Broadcasting Union (1997) Terrestrial digital television planning and implementation considerations. EBU Document, BPN005, Second Issue, July 1997. European Broadcasting Union (1998) Technical bases for T-DAB services network planning and compatibility with existing broadcasting services. EBU Document, BPN003, Rev.1, May 1998.
Fontan, F.P. and Hernando, J.M. (1995) Comparison of irregular terrain propagation models for use in digital terrain databased radiocommunication system planning tools. IEEE Transactions on Broadcasting41 (2), 63-68.
Hata, M. (1980) Empirical formula for propagation loss in land mobile radio services. IEEE Transactions on Vehicular TechnologyVT-29, 317-325.
ITU-R Recommendation P.370-7 (1995) VHF and UHF propagation curves for the frequency range from 30 MHz to 1000 MHz, Geneva, ITU.
ITU-R Recommendation P.1146 (1995) The prediction of field strength for land mobile and terrestrial broadcasting services in the frequency range from 1 to 3 GHz, Geneva, ITU.
ITU-R Recommendation SM.1370 (1998) Design guidelines for developing advanced automated spectrum management systems (ASMS), Geneva, ITU.
ITU-R Recommendation P.526-5 (1997) Propagation by diffraction, Geneva, ITU. Prasad. M.V.S.N. and Ahmad, I. (1997) Comparison of some path loss prediction methods with VHF/UHF measurements. IEEE Transactions on Broadcasting 43, 459-486.
Ligeti A. and Zander, J. (1999) Minimal cost coverage planning for single frequency networks. IEEE Transactions on Broadcasting. 45, 78-87.
Mokhtari, H. (1997) Theoretical computation of the coverage probability of a digital TV transmitter in an analog TV network using a stochastic approach. IEEE Transactions on Broadcasting43, 20-25.
Mulilis. J.-P. (1995) Telecommunications issues in Disaster Management: A Person-Relative-to-Event (PrE) Perspective. The Australian Journal of Emergency
Management 11 (3), 27-31.
Vogler, L.E. (1982) An attenuation function for multiple knife-edge diffraction. Radio
Science17, 1541-1546.
Zimmermann, H. (1997) Crisis response communications: telecommunications in the service of humanitarian assistance. In: Proceedings of the International