Custos e @gronegócio on line - v. 15, n. 4, Out/Dez - 2019. ISSN 1808-2882 www.custoseagronegocioonline.com.br
Unit milk cost and profitability of dairy cattle farms supported and
non-supported by IPARD program: a case study of Konya, Turkey
Recebimento dos originais: 28/08/2019 Aceitação para publicação: 13/02/2020
Aykut Örs
Ph.D. in Agricultural Economics
Institution: Agriculture and Rural Development Institute Address: Konya Provincial Coordination Unit.
P.O.Box:42060, Konya, Turkey E-mail: [email protected]
Cennet Oğuz
Prof. Dr. in Agricultural Economics Institution: Selçuk University
Address: Faculty of Agriculture, Department of Agricultural Economics. P.O.Box:42075, Konya, Turkey
E-mail: [email protected]
Abstract
The animal production value is 59% of total plant and animal production value in Turkey while the 35% of this production is the value obtained from animal products. The most important of these animal products is milk with 22 million tons of production. With the Pre-accession Assistance-Rural Development (IPARD) program supports implemented within the scope of EU compliance process, it was aimed to establish highly competitive dairy farms. The aim of this study was to compare the milk production cost and the profitability of dairy farms, supported and non-supported by the IPARD program in Konya which has an important place in milk production in Turkey. In the milk production cost and profitability calculations of the farms, according to the purpose of the study, the farms were not evaluated as a whole, they evaluated only by taking into account the dairy cattle production activity. The primary data of the study were obtained from dairy farms supported and non-supported by the IPARD program by using a questionnaire filled during the face-to-face interviews. Full count method was used to determine the 50 dairy farms supported by IPARD Program (SDF) while Neyman allocation sampling method was used to determine the 100 dairy farms non-supported by IPARD program (NSDF). As a result of the study; considering the average values of the NSDF, gross profit per LAU was $719.97, net profit per LAU was $18.64, unit milk cost was $0.37 per kg and milk sales price was $0.38 per kg while these values were $1,398.58, $566.27, $0.33 per kg and $0.40 per kg respectively for SDF . SDF had lower unit milk costs and higher profits than NSDF had. NSDF has failed in their dairy cattle production activities and they have been maintaining their sustainability as a result of their plant production activities.
Custos e @gronegócio on line - v. 15, n. 4, Out/Dez - 2019. ISSN 1808-2882 www.custoseagronegocioonline.com.br
1. Introduction
According to TurkStat data for the year 2018, the total plant and animal production value in Turkey was 384 billion Turkish Liras, while animal production value represent 59% of total production with 225 billion Turkish Liras. 35% of animal production value comes from animal products with 79 billion Turkish Liras. Total milk production increased by 6.9% in 2018 and reached 22 million 121 thousand tons. 90.6% of this amount is composed of cow milk, 6.5% of sheep milk, 2.5% of goat milk and 0.3% of buffalo milk (Anonymous, 2019).
The vast majority of dairy farms in Turkey are mixed production farms which produce both plant and animal products. During Turkey's EU membership process, it is necessary to ensure that these dairy farms comply to EU standarts in animal health, the farm scale, efficiency, technology usage, product quality and competitiveness issues. EU provides funding to Turkey with Instrument for Pre-Accession (IPA) to realize the production of standard to compete with dairy farms in the EU member countries. With the support provided by IPA's Rural Development Component (IPARD), it is aimed to improve the overall performance of dairy farms and increase their competitiveness, including their marketing capabilities (Anonymous, 2011; Kaya and Örs, 2019).
The aim of this study was to compare the milk production cost and the profitability of dairy farms, supported and non-supported by the IPARD program in Konya. In the milk production cost and profitability calculations of the farms, according to the purpose of the study, the farms were not evaluated as a whole, they evaluated only by taking into account the dairy cattle production activity. At the end of the study, the results of dairy cattle production activity were compared with the results of all activities done in farm.
2. Literature Review
While the main indicators used in evaluating the success of dairy farms and comparing them with other dairy farms are various, the most commonly used ones are; milk yield, gross production value, milk price, unit milk cost, gross profit and net profit (Açıl and Demirci, 1984; Kıral. et. al., 1999; Tranel and Gary, 2002; Güneş, 2004; Demircan et. al., 2006; Shoemaker et. al., 2008; Çetin, 2013; Geetha and Lavanya, 2013; Kumawat et. al., 2014; Oğuz and Bayramoğlu, 2015; Ramsbottom et. al., 2015; Aşkan and Dağdemir, 2016; Hanrahan et. al., 2017; Oğuz and Yener, 2018a; Oğuz and Yener, 2018b; Örs and Oğuz, 2019;
Custos e @gronegócio on line - v. 15, n. 4, Out/Dez - 2019. ISSN 1808-2882 www.custoseagronegocioonline.com.br
Tapki, 2019). Using the calculation methods in the literature, gross production value, production cost, unit milk cost, gross profit and net profit values of dairy farms were calculated within the scope of the study.
In order to interpret the results of the study, the values calculated within the scope of the study were compared with the results of similar literature studies (Dedeoğlu and Yıldırım, 2006; Demircan, 2006; Gündüz and Dağdeviren, 2011; Aşkan and Dağdemir, 2016; Oğuz and Yener, 2018a; Tapki, 2019). In this study, Örs and Oğuz's (2019) study was used in order to compare the calculations carried out for dairy cattle production activity of farms and the calculations of all activities done in farm.
In this study dairy farms supported and non-supported by IPARD program were compared. IPARD I program (Anonymous 2011), IPARD II program (Anonymous 2015) and the study of Kaya and Örs (2018) were used as a literature for IPARD. Innovative technology usage index and levels of dairy farms were taken from the study of Örs and Oğuz's (2018).
3. Material and Methods 3.1. Material
The main material of the study was dairy farm data’s which were obtained through interviews in Konya from 50 supported dairy farms by the IPARD program (SDF) and 100 non-supported dairy farms (NSDF). And also previous research findings and published data were used as a secondary source. For the study, the average exchange rate was taken as 1 dollar equals to 3.58 Turkish Liras that was the average exchange rate of the May and November 2017 when the field study was done.
3.2. Sampling method
During the sampling period, there were only 50 SDF that were operating in Konya. Because the population was small and it was easy to reach the desired information, the full count method was used to determine the SDF.
According to IPARD program, milking cow number criteria for dairy farms is minimum 10 milking cows and maximum 120 milking cows. In accordance with this criterion; the main frame of NSDF was determined as 4.209 establishments in 16 districts of Konya which had milking cows between 10 to120 head. Neyman method from the stratified
Custos e @gronegócio on line - v. 15, n. 4, Out/Dez - 2019. ISSN 1808-2882 www.custoseagronegocioonline.com.br
sampling method was used in the calculation of sample volume. According to the Neyman method, the equation that determines the sample volume was formulated as follows (Yamane, 1967).
In formula; n = sample volume, N = total unit number belonging to the sampling frame, D = d / t, d = derivation from the average, t = standard normal distribution value. The sample volume was determined by using the number of milking cows. The sample size was calculated as 100 for a confidence interval of 95% and an error margin of 5%.
As a result 150 dairy farms were determined as total sample volume.
3.3. The method used in the calculations
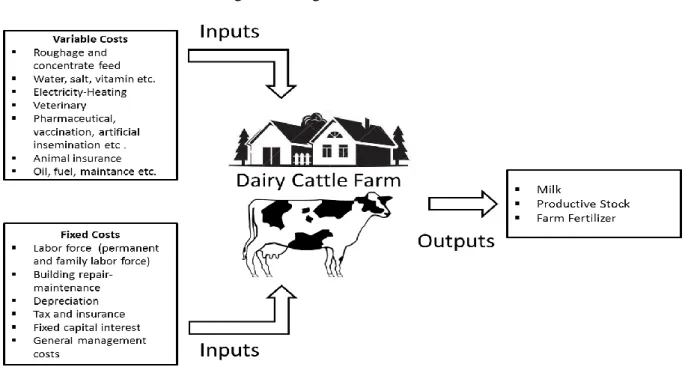
In the milk production cost and profitability calculations of the farms, according to the purpose of the study, the farms were not evaluated as a whole, they evaluated only by taking into account the dairy cattle production activity. The inputs and outputs of the dairy cattle farms used in calculations were given in Figure 1.
Custos e @gronegócio on line - v. 15, n. 4, Out/Dez - 2019. ISSN 1808-2882 www.custoseagronegocioonline.com.br
Total production costs of the dairy cattle farms were calculated separately as variable and fixed operating costs (Geetha and Lavanya, 2013; Oğuz and Bayramoğlu, 2015; Tapki, 2019). In the research, the costs which were increasing or decreasing depending on the production volume were evaluated as variable costs and the costs not related to production amount were considered as fixed costs (Güneş, 2004; Hanrahan et. al., 2017). The items used in the variable and fixed cost calculations were shown in Figure 1.
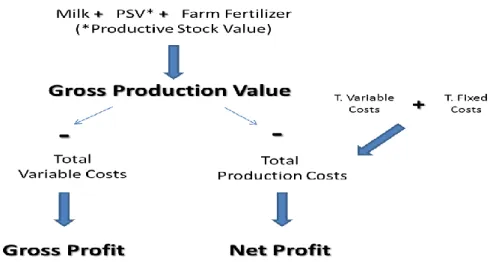
The gross production value for dairy cattle was calculated by adding up the value of total milk, which was the main product, the increase in productive stock value (PSV) and farm fertilizer which were by-products (Çetin, 2013; Kumawat et. al., 2014; Ramsbottom et. al., 2015; Aşkan and Dağdemir, 2016)..
The increase in productive stock value (PSV) was calculated by taking into account factors that cause animal movements such as birth, death, changing age, buying, selling and consumption of animals. For this purpose, the following formula was used (Kıral et. al., 1999; Oğuz and Bayramoğlu, 2015).
PSV = (year end stock value + value of the sold stock + value of the stock slaughtered) – (value of the stock at the beginning of year + value of the stock bought)
Gross profit was calculated by subtracting the variable costs from the gross production value while net profit was calculated by subtracting total production costs from gross production value (Açıl and Demirci, 1984; Demircan et. al., 2006; Shoemaker et. al., 2008; Ramsbottom et. al., 2015; Hanrahan et. al., 2017). For comparison, gross and net profit values were also given per large animal unit (LAU).
Custos e @gronegócio on line - v. 15, n. 4, Out/Dez - 2019. ISSN 1808-2882 www.custoseagronegocioonline.com.br
The relative sales value method was used to calculate the unit milk cost. In this method, the total production cost was distributed according to the contribution of each compound product to the gross production value and the cost of each product was divided by the amount of production and the unit costs are calculated (Kıral et. al., 1999). The following formula was used to calculate the unit milk cost:
Unit Milk Cost = Milk Production Cost ($) / Total Milk Production Amount (kg)
4. Results and Discussion
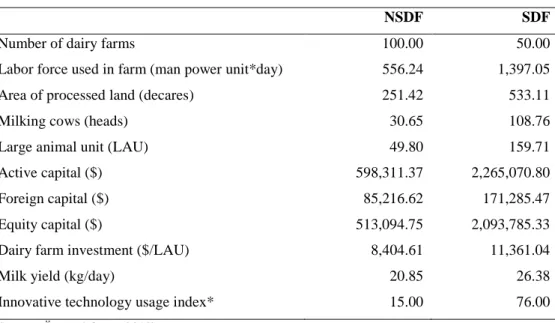
General information about the dairy cattle farms surveyed in the field study was presented in Table 1. NSDF had an average of 30.65 head milking cows, while SDF had an average of 108.76 head milking cows. The mean LAU value of NSDF was 49.80 and the mean milk yield was 20.85 kg/day per milking cow, whereas for SDF these values were 159.71 and 26.38 kg/day, respectively.
Table 1: General information of the dairy farms
NSDF SDF
Number of dairy farms 100.00 50.00
Labor force used in farm (man power unit*day) 556.24 1,397.05 Area of processed land (decares) 251.42 533.11
Milking cows (heads) 30.65 108.76
Large animal unit (LAU) 49.80 159.71
Active capital ($) 598,311.37 2,265,070.80
Foreign capital ($) 85,216.62 171,285.47
Equity capital ($) 513,094.75 2,093,785.33
Dairy farm investment ($/LAU) 8,404.61 11,361.04
Milk yield (kg/day) 20.85 26.38
Innovative technology usage index* 15.00 76.00 (*Source: Örs and Oğuz, 2018)
The calculations were presented in Table 2 according to dairy farm groups. The average of total variable costs was $76,363.74 in the NSDF, while it was $282,267.56 in the SDF. In the NSDF, the variable cost per LAU was $1,533.41, while in the SDF close to this value, the variable cost per LAU was $ 1,767.38. While 90.74% of the variable costs were concentrated feed and roughage in NSDF, this ratio was 84.91% in SDF. When the studies in
Custos e @gronegócio on line - v. 15, n. 4, Out/Dez - 2019. ISSN 1808-2882 www.custoseagronegocioonline.com.br
the literature were examined, the percentage of concentrated feed and rough feed costs in the variable costs of animal production: In the study of Dedeoğlu and Yıldırım (2006), 83.98%; in the study of Gündüz and Dağdeviren (2011), 93.61%; in the study of Aşkan and Dağdemir (2016), 85.06%; in the study of Oğuz and Yener (2018a), 83.25%.
The average of total fixed costs in NSDF was $34,926.06 per farm and $701.33 per LAU while it was $132,928.47 and $832.31 in SDF, respectively. The highest three fixed cost items of NSDF were; depreciation, family labor force and fixed capital interest costs. In the SDF, the three highest fixed costs were depreciation, fixed capital interest and permanent labor force costs. While the highest labor cost item in the NSDF was family labor force, it was permanent labor force in the SDF. This was due to the fact that almost all of the NSDF were family-owned enterprises, while the SDF were professional enterprises.
The fixed and variable cost ratios in total production costs appear to be similar for NSDF and SDF. In the NSDF, 69% of the total production costs were variable costs and 31% were fixed costs, whereas in the SDF these rates were 68% and 32%. In the study of Dedeoğlu and Yıldırım (2006), these rates were 57.55% and 42.45%, respectively; in the study of Gündüz and Dağdeviren (2011), 74.58% and 25.42%; in the study of Aşkan and Dağdemir (2016), 79.58% and 20.42%; in the study of Oğuz and Yener (2018a), 70.69% and 29.31%.
When the percentage distribution of the product constituting the gross production value (GPV) in Table 2 was examined; The NSDF’s GPV consists of 78.10% milk production value, 18.63% PSV and 3.27% farm fertilizer value. On the other hand, in SDF, it consist of 82.57% milk production value, 15.02% PSV and 2.42% farm fertilizer value. Since milk yield in SDF was higher than in NSDF, the ratio of milk production value in GPV was higher. In the study of Gündüz and Dağdeviren (2011), 81.40% milk production value, 18.20% PSV and 0.40% farm fertilizer value; in the study of Oğuz and Yener (2018a), these values were %85.20, %9.80 ve %5.00 respectively.
Table 2: Gross profit, net profit and unit milk cost calculations
NSDF SDF $/year % $/year % Costs Variable Costs Concentrate Feed 37,153.30 33.38 130,965.63 31.54 Roughage 32,142.74 28.88 108,698.05 26.18 Water-Salt-Vitamin 703.21 0.63 6,304.02 1.52
Custos e @gronegócio on line - v. 15, n. 4, Out/Dez - 2019. ISSN 1808-2882 www.custoseagronegocioonline.com.br Electricity-Heating 603.21 0.54 8,662.01 2.09 Veterinary-Pharmaceutical-Vaccination 1,805.99 1.62 8,412.85 2.03 Artificial Insemination 1,209.41 1.09 5,928.49 1.43 Animal Insurance 174.72 0.16 4,725.12 1.14 Oil-Fuel-Maintance 2,571.15 2.31 8,571.40 2.06
Total Variable Costs (A) 76,363.74 68.62 282,267.56 67.98 Total Variable Costs / LAU 1,533.41 1,767.38
Fixed Costs
Depreciation Expenses 12,403.77 11.15 53,520.03 12.89
Building Repair-Maintenance Expenses 2,327.22 2.09 14,916.18 3.59
Permanent Labor Force 2,416.87 2.17 23,711.06 5.71
Family Labor Force 8,083.24 7.26 1,764.66 0.43
Tax and Insurance - - 822.48 0.20
Fixed Capital Interest 6,880.79 6.18 28,996.72 6.98
General Management Costs (%3) 2,814.17 2.53 9,197.33 2.22
Total Fixed Costs (B) 34,926.06 31.38 132,928.47 32.02
Total Fixed Costs / LAU 701.33 832.31
Total Production Costs (C) = (A+B) 111,289.80 100.00 415,196.02 100.00 Total Production Costs / LAU 2,234.73 2,599.69
Incomes
Milk Value (D) 87,639.63 78.10 417,488.45 82.57
Productive Stock Value (E) 20,906.42 18.63 75,924.58 15.02
Farm Fertilizer Value (F) 3,672.07 3.27 12,221.23 2.42
Livestock Supports (G) 11,524.44 54,198.72
Total Incomes (H) = (D + E + F + G) 123,742.57 100.00 559,832.98 100.00 Gross Production Value (I) = (D + E + F) 112,218.12 505,634.26 Gross Profit (J) = (I - A) 35,854.38 223,366.70
Gross Profit / LAU 719.97 1,398.58
Net Profit (K) = (I - C) 928.32 90,438.23
Net Profit / LAU 18.64 566.27
Milk Production Amount (kg) (L) 236,009.87 1,038,548.37
Milk Production Costs (M) =(C x %D/100) 86,914.63 342,816.06
Milk Sales Price ($/kg) 0.38 0.40
Unit Milk Cost (N) = (M / L) 0.37 0.33
Unit Milk Cost by Livestock Supports
(P) = (M - G) / (L) 0.32 0.28
The average of gross profit in NSDF was $35,854.38 per farm and $719.97 per LAU while it was $223,366.70 and $1,398.58 in SDF, respectively. The SDF had a higher gross profit per LAU. The fact that the gross profit of the SDF was higher than that of the NSDF was an indication that they were more competitive and more successful in terms of business
Custos e @gronegócio on line - v. 15, n. 4, Out/Dez - 2019. ISSN 1808-2882 www.custoseagronegocioonline.com.br
organization. Demircan (2006) calculated that the gross profit per LAU was $615.85; Oğuz and Yener (2018a) calculated $1,087.21 in their study in the Konya region.
When the net profit values were examined; The NSDF’s average net profit was $928.32 per farm and $18.64 per LAU, while it was $90,438.23 per farm and $566.27 per LAU in SDF. In the study of Demircan (2006), net profit per LAU was $142.19.
When Table 2 was examined in terms of unit milk costs; the average unit milk cost in NSDF was $ 0.37 per kg and the average milk sales price was $ 0.38 per kg. In the SDF, the average unit milk cost was $ 0.33 per kg and the average milk sales price was $ 0.40 per kg. In NSDF, there was a $ 0.01 per kg difference between the average unit milk cost and the selling price, while in SDF it was $ 0.07 per kg. When the livestock supports were taken into account, the NSDF's unit milk cost decreases to $ 0.32 per kg and the SDF’s to $ 0.28 per kg. After the livestock supports, there was a difference of $ 0.06 per kg between the average unit milk cost and the selling price in the NSDF, whereas this difference was $ 0.12 per kg in the SDF. When the studies in the literature were examined: In the study of Demircan (2006), unit milk cost was $0.32; in the study of Oğuz and Yener (2018a), $0.31; in the study of Tapki (2019), $0.28.
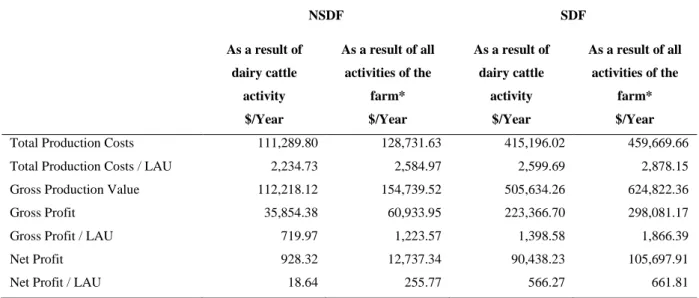
In order to interpret the status of the dairy farms within the scope of the study, gross and net profit values as a result of dairy cattle activity were compared with the values resulting from all activities of the farms in Table 3.
Table 3: Comparison of the results of dairy cattle production activity with all activity results done in farm.
NSDF SDF As a result of dairy cattle activity As a result of all activities of the farm* As a result of dairy cattle activity As a result of all activities of the farm*
$/Year $/Year $/Year $/Year
Total Production Costs 111,289.80 128,731.63 415,196.02 459,669.66
Total Production Costs / LAU 2,234.73 2,584.97 2,599.69 2,878.15
Gross Production Value 112,218.12 154,739.52 505,634.26 624,822.36
Gross Profit 35,854.38 60,933.95 223,366.70 298,081.17
Gross Profit / LAU 719.97 1,223.57 1,398.58 1,866.39
Net Profit 928.32 12,737.34 90,438.23 105,697.91
Net Profit / LAU 18.64 255.77 566.27 661.81
Custos e @gronegócio on line - v. 15, n. 4, Out/Dez - 2019. ISSN 1808-2882 www.custoseagronegocioonline.com.br
When Table 3 was analyzed, the gross profit per LAU as a result of dairy cattle activity in NSDF was $ 719.97, and when results of all activities of farm were evaluated, this value increased to $ 1,223.57. In the SDF, this value increased from $ 1,398.58 to $ 1,866.39. In the SDF, the gross profit per LAU as a result of all activities of farm was 1.34 times higher than the result of the dairy cattle activity while it was 1.70 times higher in NSDF. Likewise, when the net profit per LAU was evaluated, as a result of the dairy cattle activity in the NSDF was $ 18.64, while results of all activities of farm were evaluated, this value increased to $ 255.77. In the SDF, this value increased from $ 566.27 to $ 661.81. In the SDF, the net profit per LAU as a result of all activities of farm was 1.17 times higher than the result of the dairy cattle activity while it was 13.36 times higher in NSDF. The fact that the gap was so high in the NSDF shows that the failure of their dairy cattle activities and the sustainability of their enterprises as a result of crop production activities.
5. Conclusions and Recommendations
As a result of the survey, when the general information about the enterprises was examined; SDF's average land sizes, number of milking cows, labor force usage, active capital and equity capital were much higher than NSDF.
The percentage distribution of the total production costs to the variable and fixed costs was similar in both SDF and NSDF. In both groups, more than 85% of the variable costs consisted of roughage and concentrate feed costs. When the three highest fixed expense items were considered in fixed costs, two of them were the same in both groups and these were depreciation and fixed interest expenses. The third cost item was family labor fource in the NSDF, while it was permanent labor force in the SDF. This was due to the fact that almost all of the NSDF were family-owned enterprises, while the SDF were professional enterprises.
When the percentage distribution of the product constituting the gross production value was examined; since milk yield in SDF was higher than in NSDF, the ratio of milk production value in GPV was higher.
The NSDF's gross profit per LAU was $ 719.97, compared to $ 1,398.58 in the SDF. This means that the SDF makes twice as much profit as a unit of animals. The fact that the gross profit of the SDF was higher than that of the NSDF was an indication that they were more competitive and more successful in terms of business organization.
Custos e @gronegócio on line - v. 15, n. 4, Out/Dez - 2019. ISSN 1808-2882 www.custoseagronegocioonline.com.br
When the net profit values were analyzed, the net profit value per LAU in NSDF was $ 18.64 and it was $ 566.27 in SDF. While the net profits of the SDF as a result of dairy cattle activity were reasonable, the net profits of the NSDF were very low. When the net profit value as a result of the all farm activity was compared with the net profit value as a result of the dairy cattle activity, the difference in the SDF was very small, while the NSDF had 13 times the difference. The fact that the diffrence was so high in the NSDF shows the failure of their dairy cattle activities and they are providing the sustainability of their farms as a result of crop production activities.
In terms of unit milk costs, there was a difference of $ 0.01 per kg between the average unit milk cost and the selling price in the NSDF, while this difference was $ 0.07 per kg in the SDF. After the livestock supports, this difference increases to $ 0.06 per kg in the NSDF, while it increases to $ 0.12 per kg in SDF. In both cases before and after the livestock supports, the gain from one unit of milk in SDF was much higher than NSDF.
While all of the NSDF were low level innovative technology users, 90 percent of SDF were high level innovative technology users (Örs and Oğuz, 2018). The SDF, which was established in EU standards for dairy cattle, uses highly innovative technology and has 4 times more active capital, was expected to have lower unit milk cost and much higher profit compared to NSDF. However, the profitability levels of NSDF as a result of dairy cattle activity were much lower than expected. Low profitability may result from insufficient number of milking cow in the farm, low yield per cow, high amount of debt per cow and high production costs. In order for these enterprises to become competitive, they should increase the number of milking cows, develop studies on animal welfare and feed ration in order to increase milk yield, and reduce costs by analyzing the production costs in detail. However, if these measures are implemented, their profitability will increase, while unit milk finances will decrease and become sustainable dairy enterprises. Only if these measures are taken, their profitability will increase and unit milk costs will decrease and they will become sustainable dairy enterprises.
6 References
Custos e @gronegócio on line - v. 15, n. 4, Out/Dez - 2019. ISSN 1808-2882 www.custoseagronegocioonline.com.br
ANONYMOUS The Instrument for Pre-accession Assistance-Rural Development (IPARD) program (2007-2013), Republic of Turkey Ministry of Agriculture and Forestry Publications, Ankara, 2011.
ANONYMOUS The Instrument for Pre-accession Assistance-Rural Development (IPARD) program (2014-2020), Republic of Turkey Ministry of Agriculture and Forestry Publications, Ankara, 2015.
ANONYMOUS Turkstat, Agricultural structure (production, price, value) publication, Turkish Statistical Institute (Turkstat), Ankara, 2019.
(Access date: 15.08.2019; available at: http://www.turkstat.gov.tr/Start.do)
AŞKAN, E., DAĞDEMIR, V. TRA1 Düzey 2 bölgesinde destek ve teşvik alan süt sığırcılığı işletmelerinde süt üretim maliyeti ve karlılık durumu, The Journal of Agricultural Economics Researches, v. 1, p. 1-12, ISSN 2149-3928, 2016.
ÇETIN, B. Uygulamalı tarim ekonomisi, Nobel Akademik Yayıncılık, Ankara, ISBN: 9786051335476, 2013.
DEDEOĞLU, M., YILDIRIM, İ. Emek tarımsal kalkınma kooperatifine ortak işletmelerin ekonomik analizi, Yüzüncü Yıl Üniversitesi Tarım Bilimleri Dergisi, v. 16, n. 1, p. 39-48, 2006.
DEMIRCAN, V., BINICI, T., KOKNAROGLU, H., AKTAS, A.R. Economic analysis of different dairy farm sizes in Burdur province in Turkey, Czech J. Anim. Sci., 51, 2006 v. 1, p. 8–17, 2006.
GEETHA, K. T., LAVANYA, V. L. Economics analysis of dairy farming in vellalore village in coimbatore district, Journal of Economic & Social Development, Vol - IX, No. 1, ISSN 0973 - 886X, 2013.
GÜNDÜZ, O., DAĞDEVIREN, M. Bafra ilçesinde süt maliyetinin belirlenmesi ve üretimi etkileyen faktörlerin fonksiyonel analizi. Yüzüncü Yıl Üniversitesi Tarım Bilimleri Dergisi, v. 21, n. 2, p. 104-111, 2011.
Custos e @gronegócio on line - v. 15, n. 4, Out/Dez - 2019. ISSN 1808-2882 www.custoseagronegocioonline.com.br
GÜNEŞ, E. Tarım İşletmelerinde Kredi Taleplerinin Doğrusal Programlama Yöntemiyle Belirlenmesi “Kırşehir İli Merkez İlçesi Tarım İşletmeleri Araştırması”, Tarımsal Ekonomi Araştırma Enstitüsü Yayınları, Ankara, 2004.
HANRAHAN, L., MCHUGH, N., HENNESSY, T., MORAN, B., KEARNEY, R., WALLACE, M., SHALLOO, L. Factors associated with profitability in pasture-based systems of milk production. Journal of dairy science, v. 101, n. 6, p. 5474-5485, 2018.
KAYA, E., ÖRS, A. Comparison of IPARD I and IPARD II Programmes as a Source of Rural Development Financing in Turkey, Turkish Journal of Agriculture-Food Science and Technology, v. 7, n. 1, p. 92-98, ISSN: 2148-127X., 2019
KIRAL, T., KASNAKOĞLU, H., TATLIDİL, F., FİDAN, H., GÜNDOĞMUŞ, E. Tarımsal ürünler için maliyet hesaplama metodolojisi ve veri tabanı rehberi, Tarımsal Ekonomi Araştırma Enstitüsü Yayın, v. 37, p. 1-143, Ankara, 1999.
KUMAWAT, R., SINGH, N. K., MEENA, C. L. Economic analysis of cost and returns of milk production, extent of adoption of recommended management practices on sample dairy farms in bikaner district of Rajasthan. Global Journal of Science Frontier Research: D Agriculture and Veterinary, v. 14, n. 5, 2014.
OGUZ, C., YENER, A. Productivity analysis of dairy cattle farms in Turkey: case study of Konya Province, Custos e @gronegócio on line, v. 14, n. 1, p. 298-319, 2018a.
OĞUZ, C., YENER, A. Analysis of Financial Performance in Dairy Enterprises; The Case Study of Konya, Turkey, Turkish Journal of Agriculture - Food Science and Technology, v. 6, n. 9, p. 1148-1153, 2018b.
OĞUZ, C., BAYRAMOĞLU, Z. Tarım Ekonomisi, Atlas Kitapevi, Second Edition, 2015. ÖRS, A., OĞUZ, C. Comparison of economic Analysis of dairy farms supported and non-supported by IPARD program: a case study of Konya Province, Turkey. Custos e@ gronegócio on line, 15(2), 192-212, 2019.
ÖRS, A., OĞUZ, C. The Comparison of Innovative Technology Usage Levels of Dairy Farms Supported and Non-Supported By IPARD Program; A Case Study of Konya, Turkish Journal
Custos e @gronegócio on line - v. 15, n. 4, Out/Dez - 2019. ISSN 1808-2882 www.custoseagronegocioonline.com.br
of Agriculture - Food Science and Technology, v. 6, n. 12, p. 1809-1813, ISSN: 2148-127X, 2018.
RAMSBOTTOM, G., HORAN, B., BERRY, D. P., ROCHE, J. R. Factors associated with the financial performance of spring-calving, pasture-based dairy farms. Journal of Dairy Science, v. 98, n. 5, p. 3526-3540, 2015.
SHOEMAKER, D., EASTRIDGE, M., BREECE, D., WOODRUFF, J., RADER, D., MARRISON, D. Measures of Dairy Farm Competitiveness, The Ohio State University, U.S.A., 2008.
TAPKI, N. The comparison of dairy farms in different scales regarding milk production cost and profitability in Turkey: A case study from Hatay province, Custos e @gronegócio on line, v. 15, n. 2, p. 48-62, 2019.
TRANEL, L. F., GARY, F. Managing dairy farm finances, Iowa State University Extension Publication, 2002.
YAMANE, T. Elementary sampling theory prentice inc, Englewood Cliffs, NS, USA, p. 371-390, 1967.
Acknowledgement
This article has been prepared by using the PhD dissertation entitled "Impact of IPARD Program on Competitiveness of Dairy Farms in Konya". This study was supported by the The Scientific and Technological Research Council of Turkey (TUBİTAK) project numbered 116K697 and by the Selcuk University’s Scientific Research Fund (BAP) Project No: 17401049. We would like to thank TUBİTAK and Selcuk University Scientific Research and Projects Coordination Unit for their financial support to this project.