AN ANALYSIS FOR THE RELATIONSHIP BETWEEN TRADE OPENNESS AND
ECONOMIC GROWTH: EVIDENCE FOR TEN AFRICAN COUNTRIES1
Assoc. Prof.Fatih MANGIR2 Asst. Prof. Esra KABAKLARLI Asst. Prof. Fatih AYHAN
ABSTRACT
The empirical results for the relationship between trade openness and economic growth have long been a debatable matter in international economics literature. To re-investigate the relationship; firstly, we analyzed the homogeneity and cross-sectional dependency tests of the variables to determine appropriate unit roots and cointegration tests. We use data set includes 10 Africa countries for the period of 1990-2015. We employ pool mean group estimator (PMG) under the panel Autoregressive distributed lag (ARDL) model framework. This study complements existing literature by examining the relation between economic growth and trade openness using a panel ARDL approach for Africa countries. The results of PMG model suggest that an increase in trade openness has positive impact on economic growth in the long run. The evidence of a long-run relationship between the variables implies the validity of the long-run openness-led growth hypothesis in selected countries.
Key Words: Trade Openness, Economic Growth, Panel Cointegration, Panel ARDL, PMG Estimator JEL Classification: F14, F43, C23,
TİCARİ AÇIKLIK VE İKTİSADİ BÜYÜME İLİŞKİSİ: ON AFRİKA ÜLKESİ ÖRNEĞİ
ÖZ
Ticaret açıklığı ve ekonomik büyüme arasındaki ilişkinin ampirik sonuçları uzun süredir uluslararası iktisat yazınında tartışmalı bir konu halindedir. İlişkiyi yeniden araştırmak için; öncelikle
1The first draft of this paper is presented ICOAEF 2017 conferance on 06-07 December 2017 2 Corresponding Author.
University of Selçuk, Faculty of Business Adminstration and Economics, Konya-Turkey, [email protected] University of Selçuk, Faculty of Business Adminstration and Economics, Konya-Turkey, [email protected] University of Bandirma Onyedi Eylül, Gönen Vocational High School, Balikesir-Turkey, [email protected]
değişkenlerin birim kök ve eşbütünleşme testlerinin uygunluğunun belirlenmesi amacıyla homojenlik ve kesitsel bağımlılık test sonuçları analiz edilmiştir. Çalışmamızın veri seti olarak 10 farklı Afrika ülkesinin 1990-2015 yılları arasında verileri kullanılmıştır. Panel otoregresif dağıtılmış gecikme (ARDL) modeli çerçevesinde havuz ortalamalı grup tahmincisi (PMG) kullanılmıştır. Bu çalışma, Afrika ülkeleri için bir panel ARDL yaklaşımı kullanılarak ekonomik büyüme ve ticaret açıklığı arasındaki ilişkiyi inceleyerek mevcut literatürü tamamlamaktadır. PMG modeli sonuçları, ticaretin açıklıktaki artışın uzun vadede ekonomik büyüme üzerinde olumlu etkide bulunacağını göstermektedir. Çalışma ile elde edilen değişkenler arasındaki uzun dönemli ilişkinin kanıtı, seçilen ülkelerde uzun dönemli ticari açıklık odaklı büyüme hipotezinin geçerli olduğunu ima etmektedir.
Anahtar Kelimeler: Ticari Açıklık, İktisadi Büyüme, Panel Eşbütünleşme, Panel ARDL, PMG
Tahmincisi.
Jel Sınıflandırması: F14, F43, C23
1. INTRODUCTION
From Mercantilists doctrine to contemporary trade theories, growing role of foreign trade has always played an important role in economic debates. Moreover, many countries have accepted trade liberalization policies to benefit opportunities from increasing global growth. The standard open trade models assert that emerging economies’ gains if they removed their own barriers on foreign trade would be greater than developed countries’ gains from reaching the new markets (Weisbrot and Baker, 2002:1). Trade openness enables domestic firms to find new markets and to increase productivity, innovation through competition. Consumers also benefit from trade openness via low prices with increased quality and variety of good. Two different dimensions of economic growth are highlighted in the openness-led economic growth hypothesis. First, the flow of international knowledge and innovation should be encouraged. In addition, it is emphasized that allowing for specialization in economies through the creation of new products and the introduction of new knowledge and production inputs is another important dimension for economic growth goals (Ravinthirakumaran, 2014).
Trade openness has some benefits, but there are some arguments against free trade focusing on the cost of trade liberalization. The aims of protectionism can be summarized as follows:
- To protect domestic employment - To support infant industry - To prevent dumping
- To raise government revenue.
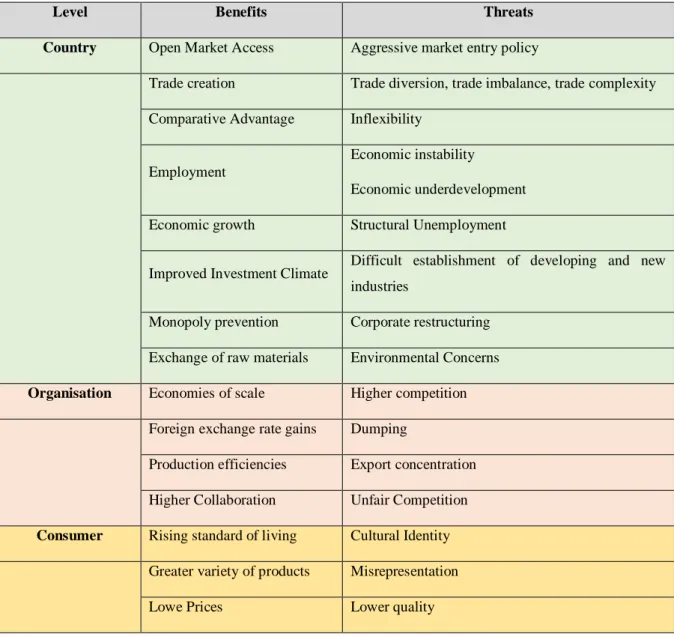
Table 1. Free Trade Benefits in Contrast with Threats
Level Benefits Threats
Country Open Market Access Aggressive market entry policy
Trade creation Trade diversion, trade imbalance, trade complexity Comparative Advantage Inflexibility
Employment
Economic instability
Economic underdevelopment Economic growth Structural Unemployment
Improved Investment Climate Difficult establishment of developing and new industries
Monopoly prevention Corporate restructuring Exchange of raw materials Environmental Concerns
Organisation Economies of scale Higher competition Foreign exchange rate gains Dumping
Production efficiencies Export concentration Higher Collaboration Unfair Competition
Consumer Rising standard of living Cultural Identity Greater variety of products Misrepresentation
Lowe Prices Lower quality
Source: Drozdz and Miškinis, 2011:46.
Although trade openness has some benefits and costs, Knetter (1993) Wade (1990) and Singh (1994) have found evidence that benefits from trade openness are higher than loses from protectionist policies. And also, the benefits and costs of trade openness are highly related to macroeconomic performance of country. The countries with low fiscal deficit, stable inflation, stable exchange rate, good governance, strong rule of law and high infrastructure have also experienced greater benefits from trade openness. For this reason, the theoretical expectations about the nexus between trade openness and economic growth should be supported by econometric analysis.
The purpose of this study is to empirically test the nexus between trade openness and growth of 10 Africa countries for the time period 1990-2015 by using a panel data econometric approach. In this article, first we will present an overview of the history of trade policy in Africa. Secondly, the literature on the relationship between trade openness and economic growth is summarized. Section III defines and reports data, methodology and empirical evidence of the study. Finally, section IV reports conclusion with discussion.
2. THE HISTORY OF TRADE POLICY IN AFRICA
The process of trade liberalization in African countries started in the mid-1980s, and especially in the 1990s. This period coincided with the failure of the import-substitution trade strategy adopted by African countries from 1960s to 1980. Initial effects of import substitution trade strategy on Africa in terms of manufacturing output and employment were positive. African region annually kept an 5.5% ratio of industrial growth in these years. However import substitution trade policy couldn’t sustainable during the 1970s because of the successive oil crises and rising debt problem (UNIDO, 2011:2). This strategy had affected productivity of domestic firms negatively and increased rent seeking behavior. The improvement of final goods production caused to an important increase in imports of intermediate and capital goods and worsened trade imbalances and balance of payments deficit (Babatunte, 2012:153).
The liberalization period in many countries in Africa started with Structural Adjustment Programme (SAP) in 1986. And after they have free market, African countries have been able to escape protectionist policies and have been deprived of more borrowing than their financing capacities (Williams, 2007: 214).
The countries in Africa attempted to develop trade liberalization reforms by decreasing tariffs and non-tariff barriers, eliminating export taxes and supporting domestic firms with export incentives. Africa`s average tariff rates dropped from %30 in the end of 1970s to %21 in early 1990s. Tariff rates continued to decrease and reached to the level of %13 in 2006.
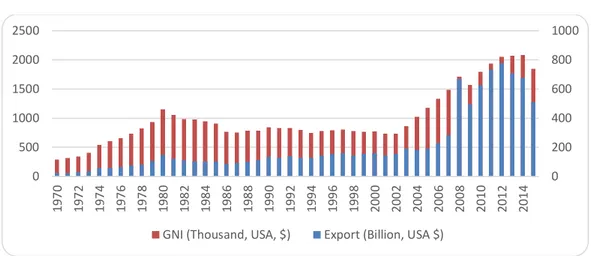
Graphic 1. Evolution of African GNI and Export from 1960 to 2011
Source: World Bank, World Development Indicators, 2017.
In 1995, the WTO3 was established. As all the members of the organization, African countries committed to practice open trade policies and to declare their bound tariffs. Trade openness is now one of the most outstanding policies in African countries. But the joining of the African countries to the WTO did not provide an immediate important effect. As shown by the graphic, from 1995 to 2002 the increase was modest. But from 2003 until 2011 the increase was exponential.
This increase is probably due to China’s integration to the WTO in 2001. In this period of time, China became the first trade partner of African countries. The nature of the trade between China and African countries reminded the same like between western and African countries. African countries export primary goods (oil, minerals, etc.) and import manufactured goods (phones, textiles etc.). The African external balance did not deteriorate because natural resources’ prices were at their highest level which is to due world high demand of natural resources.
The expected impact of trade liberalization is to increase trade flows. Thus, this increased trade should increase competitiveness so that resources are going to be used in a more efficient way. All this process is anticipated to provide significant benefit to economic growth. However, in African countries, the applying of trade liberalization may have negatively affected economies. Actually, the implementing of trade liberalization had boosted imports more than exports. This is understandable because African countries’ exports are mostly consisted of primary goods. These goods’ prices determined by the international economic conditions are also affected by weather or natural phenomena. Moreover, they have a little benefit so that their contribution in the GDP is modest.
3WTO : World Trade Organisation
0 200 400 600 800 1000 0 500 1000 1500 2000 2500 19 70 19 72 19 74 19 76 19 78 19 80 19 82 19 84 19 86 19 88 19 90 19 92 19 94 19 96 19 98 20 00 20 02 20 04 20 06 20 08 20 10 20 12 20 14
Africa’s trade is generally oriented towards EU (European Union) and the USA. However, the emergence of some countries like the BRICs countries (Brazil, Russia, India and China), Korea, Turkey and others combining with the weakness of growth in the EU countries are changing African countries trade flows orientation. However, Africa’s exports to these emerging economies are mainly comprised oil, metals and other primary products.
3. LITERATURE REVIEW
The nexus between economic growth and trade openness is one of the classic debates in international trade literature. According to the traditional neoclassical and new trade theories, trade openness promotes economic growth among developing countries. Trade openness affects economic growth in only short-term due to the exogenous role of technology within a framework of the Solow (1957) model. On the other hand, endogenous growth theory assumes that the positive influences of trade openness on economic growth depend on economic stability and investment capacity of R&D and innovation activity. The implementation of more open trade policies will only increase the profitability of R & D in a country or region if firms can compete with foreign firms (Grossman and Helpman, 1994:40). Therefore, it is difficult to say that trade openness would lead to faster growth without technology transfer.
Empirically, several prior studies examined the relationship between trade openness and economic growth by applying different econometric methods and the data set. Edward (1992) studied the relation between trade openness and growth for 30 different emerging countries for the period between 1970 and 1982. The result of his study showed trade openness has positive relationship with real per capita GDP growth by using OSL method.
Harrison (1996) employed panel data analysis on the relationship between trade openness and economic growth for emerging countries for the periods 1960-1987 and 1978-1988 and found mostly positive relations between trade openness and economic growth.
Frankel and Romer (1999) estimated the effects of trade openness on economic growth for the year of 1985 and found beneficial influences the openness of trade on economic growth.
Wacziarg (2001) reviewed the association between openness of the trade and economic growth for 57 different countries for the 1970-1989. His estimation indicates that contribution to openness of the trade on economic growth is positive.
Gries and Redlin (2012) examined the short and long-term dynamics relationship between GDP growth and openness for 158 different countries for 1970-2009-time period. The panel cointegration tests and panel error-correction models (ECM) used within GMM estimation in order to analyze the
nexus between openness of trade and economic growth in their research. A positive and significant causality from openness to growth and also from growth to openness relationship found in the long run. It shows that trade openness is a beneficial policy for growth in the long term. Nevertheless, the short-run coefficient displays a negative short-short-run adjustment, which suggests that openness can have a negative effect for an economy in the short-run.
Zeren and Ari, (2013) reinvestigated the G7 countries’ trade openness and economic growth causality relationship from 1970 to 2011. They confirmed that the increase of trade openness increases the G7 countries’ growth which in turn increases openness.
On the other hand, Brueckner and Lederman (2015), find different empirical results. By using instrumental variables, they estimated the causal nexus between openness degree of trade and economic growth in Sub-Saharan African countries. The study results show that economic growth negatively and significantly affects trade openness. However, trade openness showed a statistically significant and positive effect on economic growth.
Asfaw (2015) used a panel data by employing Generalized Least Square Estimator (GLS) for 47 different Sub-Saharan Africa countries for the periods 2000 – 2008. He found positive relations between trade openness and economic growth.
On the contrary, there are also some empirical studying’s finding different results about the relationship between trade openness, growth. Vamvakidis (2002) analyzed the relationship and found no positive relationship before 1970. Yanikkaya (2003) found negative relationship for developing countries. Dowrick and Golley (2004), Kim and Lin (2009), and Kim (2011) have shown that the benefits from trade openness in developing countries were more than in developed countries.
4. DATA, METHODOLOGY AND EMPIRICAL EVIDENCE
In this study, we empirically analyzed the relationship between trade openness (TO) and economic growth (GDP) in 10 selected African Countries4 for the period 1990–2015. These African countries are
Algeria, Angola, Egypt, Ghana, Kenya, Morocco, Nigeria, South Africa, Sudan, Tunisia. Data for these countries compiled from World Bank World Development Indicator (2016) database. The analysis of econometric models was done with Stata 14 and Gauss 10 software programs.
4 Since trade openness is highly associated with economic growth, we focus Top 10 Richest Countries in Africa of 2016 by GDP per capita.
Table 2. Descriptive statistics for Africa countries
Variable Mean Std.Dev. Min. Max. Observations
GDP 4.21 1.05 2.43 5.64 260
TO 65.98 26.09 27.07 121.46 260
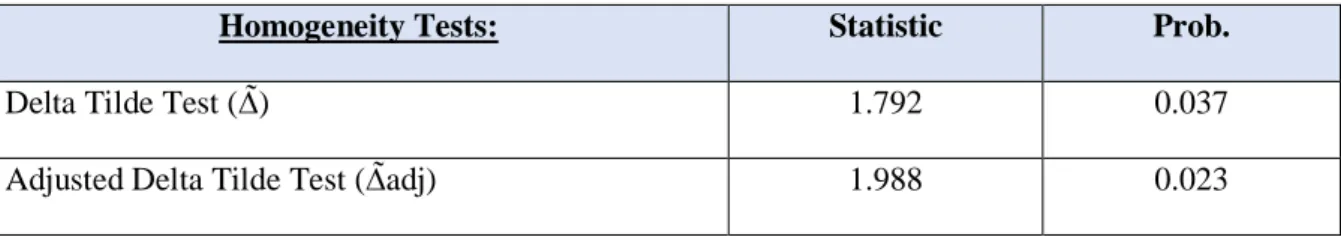
First of all, we analyzed the cross sectional dependency for our model and the homogeneity test of the variables by running the Delta test developed by Pesaran and Yamagata (2008). Identifying the Homogeneity Test of variables is an important process to determine the type of unit roots and causality tests. In our panel analysis, the Homogeneity Test of the variables is performed with two different ways by introducing Delta Tilde (∆̃) and Adjusted Delta Tilde (∆̃adj) tests developed of Pesaran and Yamagata (2008) as indicated in the equation 1 and 2.
∆̃= √𝑁 (𝑁−1 𝑆̃ − 𝑘 √2𝑘 ) (1) ∆𝑎𝑑𝑗= √𝑁 (𝑁−1 𝑆̃ − 𝐸(𝑧̃𝑖𝑇) √𝑉𝑎𝑟(𝑧̃𝑖𝑇) ) (2)
The Delta test defines null and alternative hypotheses as follows:
H0: β1= β2= …….= β2= β (3)
H1: β1= β2= …….≠ βn (4)
If one fails to reject null hypothesis, then we can conclude that series are homogeneous. Results of the Delta test are shown in Table 3. Null hypothesis has rejected, because p value is smaller than significance level of 0.05. Therefore, we can conclude that the series are heterogeneous.
If one fails to reject null hypothesis, then we can conclude that series are homogeneous. Results of the Delta test are shown in Table 3. Null hypothesis has rejected, because p value is smaller than significance level of 0.05. Therefore, we can conclude that the series are heterogeneous.
Table 3. Results of Homogeneity Test
Homogeneity Tests: Statistic Prob.
Delta Tilde Test (∆̃) 1.792 0.037
Later, we will analyze the Cross Section Dependency (CSD) by using adjusted CDLMadj test which is improved by Pesaran et al. (2008). The first test to determine the existence of cross-sectional dependency was Berusch and Pagan’s (1980) CDLM test. However, it failed to consider differences between group and individual average which may cause significantly biased results. Pesaran et al. (2008) adjusted this deviation problem by introducing the exact mean and variance of the LM statistic.
This bias-adjusted LM test is:
(5)
where μTij is exact mean and v2Tij is variance.
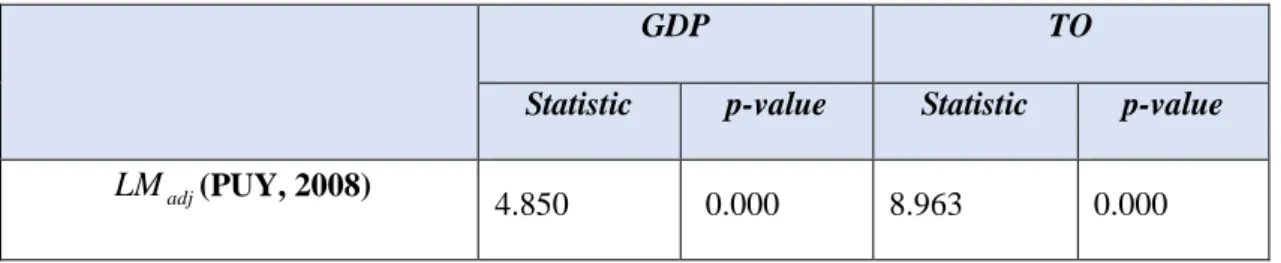
The LMadj test was employed in this study and obtained results are presented in Table 4. We concluded that there was cross-sectional dependency among the variables; because estimated probability values were lower than 0.05.
Table 4. Results of CD test for variables
GDP TO
Statistic p-value Statistic p-value
adj
LM (PUY, 2008)
4.850 0.000 8.963 0.000 H0: No cross-section dependency
For the presence of such cross-sectional dependence in our data, stationary property of series will be estimated by Cross-Sectionally Augmented Dickey Fuller (CADF) which is one of second-generation panel unit root estimators and developed by Pesaran (2007). CADF test hypothesing that every country is influenced with different degree from time effects and considering the spatial autocorrelation is used in T>N and N>T situations (Mercan et al., 2015:143).
The null hypothesis of this test assumes that all series in the panel are non-stationary and if the absolute value of calculated statistic is greater than the critical value, and then we accept that series are stationary.
The CADF regression can be written as follows (Baltagi, 2012: 286):
∆𝑦
𝑖𝑡= 𝑎
𝑖+ ∅𝑦
𝑖,𝑡−1+ 𝑏
𝑖𝑦̅
𝑡−1+ 𝑐
𝑖𝑦̅
𝑡+ 𝑒
𝑖𝑡(6) where yt is the average at time t of all N observations.
Table 5. CADF Test Results
Variable Lags
Constant
Lags
Constant and Trend
CADF-stat CADF-stat
GDP 1 1
Panel -3.131 -3.854
TO 1 1
Panel -1.627* -2.685*
The critical values for the CADF test were obtained from Pesaran (2006), Case II critical values for the CADF test are -2.22 at %10***, -2.37 at %5**, -2.66 at %1*, and Case III critical values at 10, 5 and 1% significance levels are -2.76, -2.93 and -3.24.
On the basis of these results, GDP series are stationary at the level of I (0) but TO series have include unit root and non-stationary.
Since the variables are stationary at different levels, we can explore analysis of short-run dynamic and long run relationship with panel data estimators that are based on the Auto Regressive Distributed Lag (ARDL) approach. The ARDL method can be applied to test cointegration relation among the series that are not integrated of the same order. The pooled mean group (PMG) and mean group (MG) are two estimators of ARDL model developed by Paseran et al. (1999).
The main benefits of PMG and MG estimators can be summarized as follows: Two estimators can estimate the cointegrating relationships among variables with different order of stationary. They are both available with respect to short panel and long panel. Moreover, they can estimate dynamic relation between variables. In this article, the suitable estimator is determined by the Hausman test. If calculated p-values greater than 0.05 means that the PMG estimator is preferred over MG estimator for ARDL procedure.
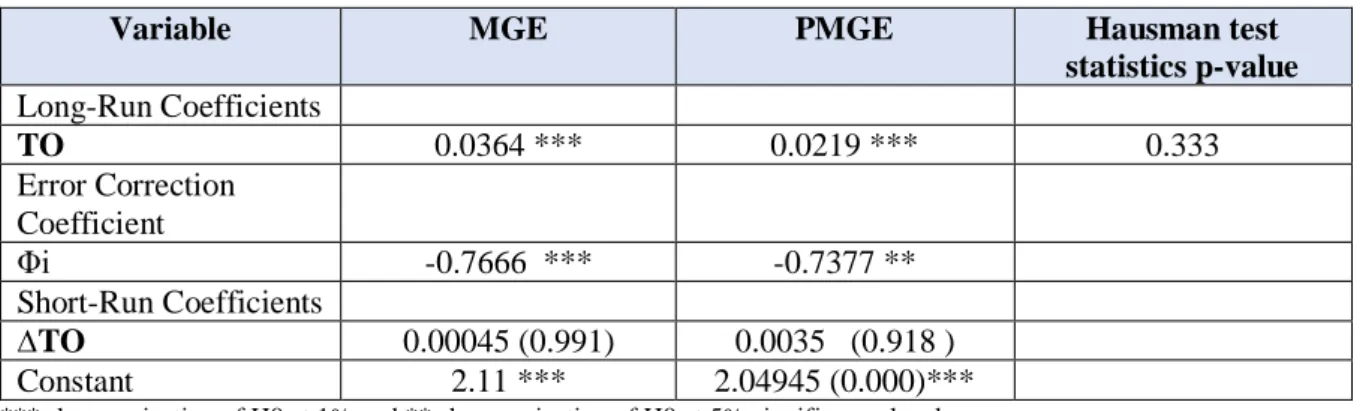
Table 6. Pool Mean Group And Mean Group Estimations of ARDL (1,1,1)
Variable MGE PMGE Hausman test
statistics p-value Long-Run Coefficients TO 0.0364 *** 0.0219 *** 0.333 Error Correction Coefficient Φi -0.7666 *** -0.7377 ** Short-Run Coefficients ∆TO 0.00045 (0.991) 0.0035 (0.918 ) Constant 2.11 *** 2.04945 (0.000)*** *** shows rejection of H0 at 1% and ** shows rejection of H0 at 5% significance level
Note: Table shows the coefficients and p-values of MG estimator and PMG estimator. Null hypothesis of Hausman test is estimators of PMG are efficient & consistent and estimators of MG are consistent but inefficient.
Table 6 shows the results of MG, PMG and Hausman test. Since calculated p-value of Hausman test are bigger than 0.005, we cannot reject the null hypothesis of Hausman test. Hausman test results prove that PMG is a better estimator than MG.
The empirical results indicate that the error-correction coefficient statistically significant and negative relationships between trade openness and economic growth indicating the presence of a long-and short-run causality in the data. The error correction coefficient is estimated to be –0.73. This means that approximately 73 % of disequilibrium from the previous year's shock was eliminated in the current year. The long-run elasticity to trade openness are both significant and have the expected sign. The sizes of the coefficients suggest positive effects for GDP, with a 1 per cent increase leading to about a 0.02 per cent increase in per capita GDP in the long-term. The short-run elasticities, however, turn out to be not significant. The result indicates that the effects of trade openness are persistent and accumulate over time.
5. CONCLUSION
The relation between trade openness and economic growth is a controversial debate in the economics literature. It is generally admitted that trade openness is a positive factor of economic growth. Nevertheless, studies pursuing empirical evidence on the subject gave different and controversial conclusions. In our study, we examined the causality between trade openness and economic growth in 10 Richest Countries in Africa of 2016 by GDP per capita for the period 1990-2015. The study has applied CDLMadj test which developed by Pesaran et al. (2008) to check the cross section dependence among the variables. The Pesaran (2007) cross section augmented Dickey Fuller (CADF) test proved a different order of integration of the variables. We have employed the panel ARDL model (PMG, MG) to verify the short-run and long-run effects between trade openness and economic growth. Our findings confirmed that there exists a significant long-run relationship between trade openness and growth. Empirical result shows the support for openness-led growth hypothesis for the Africa countries studied. The governments in these countries has to initiate open trade policies by creating more incentives for firms to trade, removing barriers to trade and investment, growing the process of multilateral trade agreement.
REFERENCES
Asfaw A.H.(2015) “Trade Policy and Economic Growth in Sub-Saharan Africa: A Panel Data Approach”, American Journal of Trade and Policy, 2 (4):7-14.
Babatunte, M.A. (2012) “Africa’s Growth and Development Strategies: A Critical Review”, Africa Development, 37(4), 141-178.
Baltagi, B. (2012), Econometric Analysis of Panel Data, 4th edition, Chichester, Wiley.
Bangake, C. and Eggoh, J. C. (2011) “Further Evidence on Finance-Growth Causality: A panel Data Analysis”, Economic Systems, 35(2),176–188.
Breusch, T.S and Pagan A.R. (1980). “The Lagrange Multiplier Test and Its Applications to Model Specification Tests in Econometrics”, Review of Economic Studies, 47: 239-253.
Brueckner, M. and Lederman, D. (2015) “Trade Openness and Economic Growth: Panel Data Evidence from Sub-Saharan Africa” Economica, 82, 1302-1323.
Dowrick S. and Golley J. (2004) “Trade Openness and Growth: Who Benefits?”, Oxford Review of Economic Policy, 20(1), 38-56.
Drozdz J. and Miškinis A. (2011) “Benefits and Threats of Free Trade”, Ekonomia Economics, 2(14), 40- 48.
Edwards, S. (1992). Trade Orientation, Distortions, And Growth İn Developing Countries”, Journal of Development Economics, 39(1), 31–57.
Frankel, J.A. and Romer, D. (1999). Does Trade Cause Growth? American Economic Review, 89(3), 379–399.
Gries, T. and Redlin, M. (2012) “Trade Openness and Economic Growth: A Panel Causality Analysis”, Center for International Economics Working Paper Series, No. 2011-06, June 2012.
Grossman, G.M. and Helpman, E. (1994) “Endogenous Innovation in the Theory of Growth.” Journal of Economic Perspectives 8 (1): 23–44.
Harrison, A. (1996). Openness And Growth: A Time Series, Cross-Country Analysis For Developing Countries”, Journal Development Economics, 48(2), 419–447.
Kim, D.H. (2011) “Trade, Growth And Income”, The Journal of International Trade and Economic Development, 20(5), 677-709.
Kim D.H. and Lin S.C. (2009) “Trade and Growth at Different Stages of Economic Development”, The Journal of Development Studies, 45(8), 1211-1224.
Knetter, M. M. (1993) “International Comparisons Of Pricing-To Market Behaviour”, American Economic Review, 83 (3), 473-487.
Mercan, M., Kızılkaya O. and Okde, B. (2015) “Are The Kaldor’s Laws Valid? Panel Data Analysis under Cross Section Dependency for NIC Countries”, Procedia Economics and Finance, 23, 140-145.
Pesaran, M. H. (2007) “A Simple Panel Unit Root Test in The Presence Of Cross-Section Dependence”, J ournal of Applied Econometrics, 22: 265–312.
Pesaran, M. and Shin, Y. (1999). “An Autoregressive Distributed Lag Modeling Approach To Cointegration Analysis”. In S. Strom (Ed.), Econometrics and Economic Theory İn The 20th Century: The Ragnar Frisch centennial symposium (pp. 371–413). Cambridge: Cambridge University Press.
Pesaran, M. H., Shin, Y. and Smith, R.(1999). Pooled Mean Group Estimator Of Dynamic Heterogeneous Panels” Journal of the American Statistical Association, 94, 621-634.
Pesaran, M, Ullah, A. and Yamagata, T.(2008) “A Bias-Adjusted LM Test Of Error Cross-Section Independence”, Econometrics Journal, 11(1), 105-127.
Ravinthirakumaran, N. (2014) “Applicability of Openness-led Growth Hypothesis in Sri Lanka An ARDL Bounds Test”, South Asia Economic Journal, 15(2), 241-263.
Singh, A. (1994) “Openness and the Market Friendly Approach to Development: Learning the Rights Lessons from Development Experience', World Development 22, 1811-1823.
Solow, R. (1997) “Is There a Core of Usable Macroeconomics We Should All Believe In?”, American Economic Review, 87(2), 230-232.
UNIDO (2011), Economic Development in Africa: Report 2011-Fostering Industrial Development in Africa in the New Global Environment, Special Issue, United Nations Industrial Organization, United Nations, New York and Geneva, 2011.
Vamvakidis, A., 2002. How Robust is The Growth-Openness Connection? Historical Evidence”, Journal of Economic Growth,7, 57–80.
Wacziarg, R. (2001) “Measuring the Dynamic Gains From Trade”, World Bank Economic Review, 15(3), 393-429.
Wade, R. (1990) “Governing the Market: Economic Theory and the Role of Government in East Asian Industrialization”, Princeton, NJ: Princeton University Press.
Weisbrot, M. and Baker D. (2001) “The Relative Impact of Trade Liberalization on Developing Countries”, http://cepr.net/documents/publications/trade_2002_06_12.pdf[,.
Williams, G. (2007) “Why Structural Adjustment Is Necessary and Why It Doesn’t Work”, Review of African Political Economy, 21 (60), 214-225.
World Bank(2017), World Development Indicators,
Yanikkaya, H. (2003). “Trade Openness And Economic Growth: A Cross Country Empirical İnvestigation”, Journal of Development Economics, 72(1), 57–89.
Zeren, F. and Ari, A. (2013) “Trade Openness and Economic Growth: A panel Causality Test”, International of Business and Social Science, 4(9),317-324.