T.C.
YILDIZ TECHNICAL UNIVERSITY
GRADUATE SCHOOL OF NATURAL AND APPLIED SCIENCES
ADVANCED ELECTRODE/ELECTROLYTE MATERIALS FOR
LOW AND INTERMEDIATE TEMPERATURE SOLID OXIDE
FUEL CELLS
DİDEM BERCESTE BEYRİBEY
A DISSERTATION
CHEMICAL ENGINEERING DEPARTMENT
CHEMICAL ENGINEERING PROGRAM
SUPERVISOR
PROF. DR. SEYFETTİN ERTURAN
T.C.
YILDIZ TECHNICAL UNIVERSITY
GRADUATE SCHOOL OF NATURAL AND APPLIED SCIENCES
ADVANCED ELECTRODE/ELECTROLYTE MATERIALS FOR
LOW AND INTERMEDIATE TEMPERATURE SOLID OXIDE
FUEL CELLS
This thesis was presented by Didem Berceste Beyribey as partial fulfillment of the requirements for the degree, Doctor of Philosophy in Chemical Engineering at the Graduate School of Natural and Applied Science, Yıldız Technical University, 18th September 2012. The thesis was accepted by the committee members given below.
Advisor
Prof. Dr. Seyfettin ERTURAN Yıldız Technical University
Committee members
Prof. Dr. Seyfettin ERTURAN
Yıldız Technical University _____________________ Prof. Dr. Hüseyin AFŞAR
Yıldız Technical University _____________________ Prof. Dr. Güldem ÜSTÜN
İstanbul Technical University _____________________
Prof. Dr. Hanifi SARAÇ
Yıldız Technical University _____________________
Prof. Dr. H. Ayşe AKSOY
This study is supported by Scientific Research Foundation of Yıldız Technical University Project No: 27-07-01-05.
ACKNOWLEDGEMENTS
This thesis is the culmination of an exciting and challenging graduate education in Chemical Engineering at the Graduate School of Natural and Applied Science, Yıldız Technical University. Its completion was only possible with the help of many individuals, to whom I would like to express my utmost respect and gratitude. First, special thanks to my advisor and mentor Prof. Dr. Seyfettin Erturan, for his support, everlasting guidance and encouragement. I could never have found my way to science without him. Similarly, to all members of Yıldız Technical University, in particular Assist. Prof. Dr. Burcu D. Çorbacıoğlu, Assist. Prof. Dr. Osman İsmail, Dr. Zehra Altın and Dr. M. Bora Akın for their time and valuable contributions in all stages of my career.
I would also like to thank my thesis committee members, Prof. Dr. Hüseyin Afşar and Prof. Dr. Güldem Üstün for their valuable advice and inputs.
I wish to thank Head of Chemical Engineering Department, Prof. Dr. Hanifi Saraç for his kindly consideration and support through writing of this thesis.
I would like to express my great appreciation to Prof. Dr. Mahmut D. Mat, who always accepted me as a member of his research group at Mechanical Engineering Department in Niğde University and spent a lot of time on my study. My thanks also go to all members of his research group, especially Çiğdem Timurkutluk, Tuğrul Y. Ertuğrul, Ali Çelen, Selahattin Çelik, Bora Timurkutluk, Adem Çiçek, Abdullah Mat, Fatma Aydın for sharing experimental set-up and helping on many tests.
I owe, of course, a great part of my success to Prof. Dr. Mogens Bjerg Mogensen, without whose care and guidance I might never have had a wonderful experience at Department of Energy Conversion and Storage in Technical University of Denmark. I also would like to thank all colleagues at Department of Energy Conversion and Storage for their assistance and discussions, especially Finn Willy Poulsen, Nikolaos Bonanos, Peter Holtappels, Jens F.S. Borchsenius, Jonathan Hallinder, Sandrine Ricote, Alberto Lapina.
Needless to say but I certainly must, I thank my best friends Izzy and Boğoçlu, with whom I have shared this entire experience. You make me a better person who looks to the future while still enjoying the present. To Palle, without whose support, care and help, I might never overcome the hard work in Denmark.
Last but not least, I thank my mother, Esincik, who lights up my life with her presence and smile. Without her love, I could not have begun or finished that study. To my father, Alp, I am ever grateful to him for being my hero. I am very proud to inherit the career in chemistry from my father. I have been missing you too much, Dad.
To my brother, Mengütay, is another part of me, my role model and superhero. I can not imagine a life without you.
September 2012
vii
TABLE OF CONTENTS
page LIST OF SYMBOLS... ix LIST OF ABBREVIATIONS ...x LIST OF FIGURES ... xiLIST OF TABLES ...xiv
ABSTRACT ... xv ÖZET ... xvii CHAPTER 1 INTRODUCTION ...1 1.1 Literature Review ...1 1.2 Aim of Thesis ... 12 1.3 Objectives ... 13 CHAPTER 2 VANADIUM MOLYBDENUM OXIDE ... 14
2.1 Introduction... 14
2.2 Experimental ... 16
2.2.1 Synthesis and Characterization ... 16
2.2.2 Electrolyte Fabrication ... 17
2.2.3 Cell Preparation ... 17
2.2.4 Cell Testing... 18
2.2.4.1 The Cell A ... 18
2.2.4.2 The Cell B ... 20
2.3 Results and Discussions ... 22
2.3.1 Structural and Thermal Analysis ... 22
2.3.2 Cell Testing... 26
2.3.2.1 The Cell A ... 26
Performance Tests ... 26
viii
2.3.2.2 The Cell B ... 31
Performance Tests ... 31
Electrochemical Impedance Spectroscopy ... 35
Surface Analysis ... 40
2.4 Conclusions... 45
CHAPTER 3 NOVEL RUBIDIUM PHOSPHITE TELLURATE COMPOUND ... 46
3.1 Introduction... 47
3.2 Experimental ... 48
3.3 Results and Discussions ... 51
3.3.1 Structural and Thermal Analysis ... 51
3.3.2 Electrochemical Impedance Spectroscopy ... 58
3.3.3 Calculations of the Equivalent Capacity ... 63
3.4 Conclusions... 65
CHAPTER 4 RUBIDIUM SELENATE with a SECONDARY PHASE of RbOH ... 67
4.1 Introduction... 67
4.2 Experimental ... 68
4.3 Results and Discussions ... 70
4.3.1 Structural and Thermal Analysis ... 70
4.3.2 Electrochemical Impedance Spectroscopy ... 78
4.4 Conclusions... 82
CHAPTER 5 CESIUM DIHYDROGEN PHOSPHATE TELLURITE GLASS... 84
5.1 Introduction... 84
5.2 Experimental ... 86
5.3 Results and Discussions ... 87
5.4.1 Structral and Thermal Analysis ... 87
5.3.2 Electrochemical Impedance Spectroscopy ... 94
5.4 Conclusions... 98
CHAPTER 6 RESULTS and DISCUSSIONS ... 99
REFERENCES... 101
ix
LIST OF SYMBOLS
pKa Acid Strength
H Enthalpy Change
Tc Calcination Temperature
Tg Glass Transition Temperature
i-V Current-Voltage i-P Current-Power pH2O Water Pressure T(H2O) Water Temperature R Resistance Rs Serial Resistance C Capacitance
Q Constant Phase Element
Cw Equivalent Capacitance
n Frequency Power
x
LIST OF ABBREVIATIONS
AFC Alkaline Fuel Cell
PEMFC Proton Exchange Fuel Cell
PAFC Phosphoric Acid Fuel Cell MCFC Molten Carbonate Fuel Cell SOFC Solid Oxide Fuel Cell
IT-SOFC Intermediate Temperature Solid Acid Fuel Cell
SAFC Solid Acid Fuel Cell (SAFC)
MIEC Mixed Ionic and Electronic Conductor
SEM Scanning Electron Microscopy
XRD X-ray Diffraction
RT-XRD Room Temperature X-ray Diffraction HT-XRD High Temperature X-ray Diffraction
EDS Energy Dispersive X-ray Spectroscopy
TG Thermogravimetry
DTA Differential Thermal Analysis
DSC Differential Scanning Calorimetry
EIS Electrochemical Impedance Spectroscopy
OCV Open Circuit Voltage
VMO VxMo1-xOy
CPE Constant Phase Element
xi
LIST OF FIGURES
page Figure 1.1 A typical fuel cell system ...2 Figure 1.2 The stability phase diagram of CsH2PO4. ... 11
Figure 1.3 Grotthuss conduction mechanism... 12 Figure 2.1 The (a) anode and (b) cathode surface of the produced Cell A
(VMO/YSZ/LSCF) with 1 cm2 active area ... 19 Figure 2.2 The stainless stell interconnectors used in the tests of the Cell A ... 19 Figure 2.3 The fuel cell test station ... 20 Figure 2.4 The (a) anode and (b) cathode surface of the produced Cell B
(VMO/ScSZ/LSCF) with 16 cm2 active area ... 21 Figure 2.5 The stainless stell interconnectors used in the tests of the Cell B ... 21 Figure 2.6 The SEM image of synthesized V0.13Mo0.87O2.935 powder; (a) 1000 X,
(b) 20000 X ... 22 Figure 2.7 (a) TG and (b) DTA analysis of synthesized V0.13Mo0.87O2.935 powder
up to 700 ºC ... 23 Figure 2.8 Thermal analysis (TG and DTA) of the synthesized V0.13Mo0.87O2.935
powder up to 1100 ºC ... 25 Figure 2.9 XRD pattern of synthesized V0.13Mo0.87O2.935 powder ... 26
Figure 2.10 The OCV values of the cell versus the operating temperature... 27 Figure 2.11 SEM images of the (a) pre-tested and (b) post-tested anode surface
(10000X) ... 29 Figure 2.12 SEM images of the cross section of the (a) pre-tested and (b) post-tested
cell (5000X) ... 30 Figure 2.13 The voltage and power density output versus the current density under
various flow rates of dry H2; T= 650 ºC ... 32
Figure 2.14 The voltage and power density output versus the current density under various flow rates of dry H2; T= 700 ºC ... 33
Figure 2.15 The voltage and power density output versus the current density under various flow rates of dry H2; T= 750 ºC ... 34
Figure 2.16 The voltage and power density output versus the current density under flowing dry H2 and 50 ppm H2S-containing dry H2. T= 750ºC ... 35
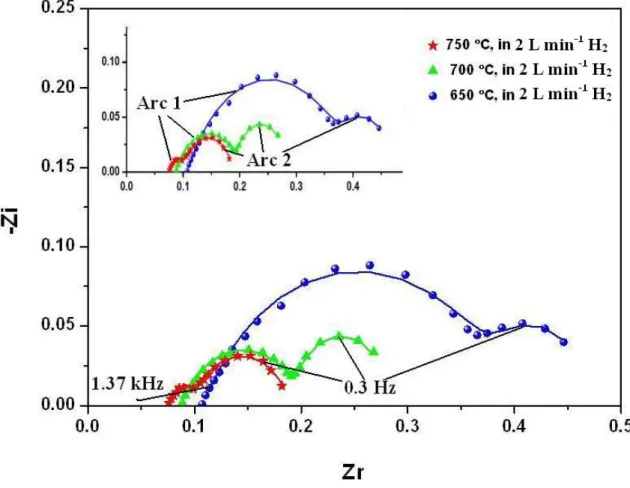
Figure 2.17 Equivalent circuit model used fit the impedance spectra ... 36 Figure 2.18 Impedance spectra of the cell in dry H2 at 650, 700 and 750 ºC; symbols
and lines respectively shows the measured values and the fittings by the model ... 37
xii
Figure 2.19 The comparison of the impedance spectra of the cell in dry H2 and
50 ppm H2S-containing dry H2 at 750 ºC; symbols and lines respectively
shows the measured values and fittings by the model ... 38 Figure 2.20 The open circuit voltage (OCV) versus time in flowing pure and 50 ppm
H2S-containing H2. T= 750ºC... 40
Figure 2.21 SEM images of the anode surface; (a) pre-test and (b) post- test ... 42 Figure 2.22 SEM images of the cross section of the (a) pre-tested and (b) post-tested
cell (5000X) ... 43 Figure 2.23 Stainless steel interconnectors after the measurement under sulfur
containing H2; (a) anode side, (b) cathode side ... 44
Figure 3.1 The rig used in the EIS experiments ... 49 Figure 3.2 The heating procedures applied to (a) the pellets A and B,
(b) the pellet C and (c) the pellet D. ... 50 Figure 3.3 SEM image taken from RbH(PO3H)·Te(OH)6 powder which was
synthesized by slow evaporation of the aqueous solution, X500 ... 51 Figure 3.4 EDS spectrum showing typical composition of the synthesized
RbH(PO3H)·Te(OH)6 powder (Hydrogen is not detectable by EDS
analysis) ... 52 Figure 3.5 Point analysis showing distribution of detectable elements at five
different points on the surface of the synthesized RbH(PO3H)·Te(OH)6
(Hydrogen is not detectable by EDS analysis) ... 53 Figure 3.6 TG/DTA analysis of the synthesized RbH(PO3H)·Te(OH)6 at a scan rate
of 5 °C min-1
... 54 Figure 3.7 DSC analysis of the synthesized RbH(PO3H)·Te(OH)6 at a scan rate of
5 °C min-1
(a) first heating/cooling cycle, (b) second heating/cooling cycle ... 55 Figure 3.8 XRD diagrams of (a) the synthesized RbH(PO3H).Te(OH)6 powder,
(b) the tested pellet A, (c) the tested pellet B, (d) the tested pellet C and (e) the tested pellet D.. ... 57 Figure 3.9 Plot of conductivity (log(σ) versus time) for the pellet A,
the pellet B at various temperatures and atmospheres.. ... 59 Figure 3.10 Plot of conductivity (log(σ) versus time) for the pellet C,
the pellet D at various temperatures and atmospheres ... 60 Figure 3.11 Impedance spectra of the pellet A, the pellet B at 240 °C ... 61 Figure 3.12 Plot of conductivity (log(σ) versus 1/T) for the pellet A, the pellet
B, the pellet C and the pellet D.. ... 63 Figure 3.13 Plot of equivalent capacitances versus 1/T for the pellet A, the
pellet B, the pellet C and the pellet D.. ... 64 Figure 3.14 Plot of conductivity log(σ) and thermal behavior TG% versus
temperature for RbH(PO3H)·Te(OH)6 ( pellet A, pellet B) ... 65
Figure 4.1 (a) SEM image of the synthesized Rb2SeO4 powder, X1250; (b) cross
section SEM image of Rb2SeO4 pellet, X500 ... 71
Figure 4.2 EDS spectrum showing typical composition of the synthesized Rb2SeO4
powder ... 72 Figure 4.3 Point analysis showing distribution of detectable elements at five
different points on the surface of the synthesized Rb2SeO4... 72
Figure 4.4 TG/DTA analysis of the synthesized Rb2SeO4 under (a,b) air and
xiii
Figure 4.5 DSC analysis of the synthesized Rb2SeO4 under air at a scan rate of
5 ˚C min-1; (a) first and (b) second heating/cooling cycles up to 500 ˚C,
(c) first and (d) second heating/cooling cycles up to 650 ˚C ... 75 Figure 4.6 XRD diagrams of (a) Rb2SeO4 pattern (# 24-966 in the JCPDS database),
(b) the synthesizedpowder, (c) the powder heated up to 600 °C and then
cooled down to room temperature, (d) the tested pellet with gold
electrodes for 135 hours between 113 to 317°C ... 76 Figure 4.7 HT-XRD diagrams of the synthesized Rb2SeO4 powder ... 78
Figure 4.8 Plot of conductivity log(σ) versus time for the first and ▲ the second pellets at various temperatures and atmospheres ... 79 Figure 4.9 The rig used in the experiments; (a) pre-test, (b) post-test ... 80 Figure 4.10 Plot of conductivity log(σ) versus 1/T for two pellets of Rb2SeO4, tested
with gold electrodes under the humidified gas mixture of 9%H2 in N2 .. 81
Figure 4.11 Impedance spectra of the Rb2SeO4 pellet at (a) 176 ˚C in air, (b) 176 ˚C
in gas mixture of 9% H2 in N2, (c) 240, 282 and 317 ˚C in gas mixture
of 9% H2 in N2 ... 82
Figure 5.1 A cross section SEM image of the CsH2PO4/TeO2 pellet; (a) X100,
(b) X500 ... 88 Figure 5.2 EDS spectrum showing typical composition of the synthesized
compound (Hydrogen is not detectable by EDS analysis, carbon was detected due to carbon coating of the pellet prior to EDS
measurement) ... 89 Figure 5.3 Point analysis showing distribution of detectable elements at five
different points on the surface of the synthesized CsH2PO4/TeO2 ... 89
Figure 5.4 TG/DTA analysis of the synthesized compound under air at a scan rate of 5 ˚C min-1
... 90 Figure 5.5 DSC analysis of the synthesized powder under air at a scan rate of
5 ˚C min-1
; (a) first and (b) second heating/cooling cycles ... 91 Figure 5.6 HT-XRD diagrams of the synthesized powder ... 92 Figure 5.7 The room temperature XRD of the synthesized powder, the last scan at
450 ˚C and that at 30 ˚C after cooling ... 93 Figure 5.8 The XRD of the synthesized compound and the tested pellet under
humidified reducing atmosphere up to 457 ˚C ... 94 Figure 5.9 Plot of conductivity log(σ) versus temperatures. The pellet was tested
with gold electrodes. ... 95 Figure 5.10 Equivalent circuit model used fit the impedance spectra ... 95 Figure 5.11 Impedance spectrum of CsH2PO4/TeO2 pellet at (a) 100 ºC,
(b) 110, 136, 146 and 166 ºC in dry air. ... 96 Figure 5.12 Impedance spectrum of CsH2PO4/TeO2 pellet at 166 ºC in (a) dry air,
(b) humidified air and (c) humidified gas mixture of 9% H2 in N2. ... 97
Figure 5.13 Impedance spectrum of CsH2PO4/TeO2 pellet at 205 ºC, 225 ºC and
xiv
LIST OF TABLES
page
Table 1.1 Types of fuel cells and their characteristics...3
Table 1.2 Typical composition and H2S concentration of some fuel sources ...6
Table 1.3 The main inorganic acids used in the solid acid electrolytes ...9
Table 1.4 Conductivity and phase transition temperature of various solid acids ... 10
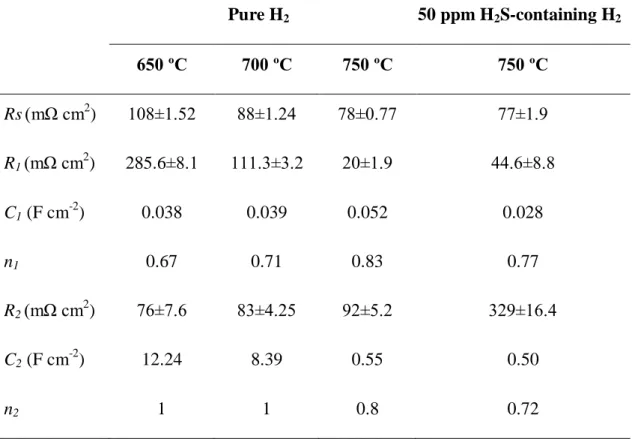
Table 2.1 The effect of temperature on the current density and the power of the cell . 27 Table 2.2 Fitted parameters from the impedance measurements of the cell with VxMo(1-x)Oy anode in pure H2 and 50 ppm H2S-containing H2 at various temperatures ... 39
xv
ABSTRACT
ADVANCED ELECTRODE/ELECTROLYTE MATERIALS FOR
LOW AND INTERMEDIATE TEMPERATURE SOLID OXIDE
FUEL CELLS
D. Berceste BEYRİBEY Department of Chemical Engineering
A Dissertation
Supervisor: Prof. Dr. Seyfettin ERTURAN
In this thesis study, various advanced materials were synthesized and investigated as electrode and electrolyte for low and intermediate temperature solid oxide fuel cells (SOFCs). Molybdenum vanadium oxide (V0.13Mo0.87O2.935)powder was obtained by a
new method of reducing acidified vanadate and molybdate solution at 60 °C by passing hydrogen sulfide gas through the solution. The obtained mixed oxide was characterized by Scanning Electron Microscopy (SEM), X-ray Diffraction (XRD), Thermogravimetry (TG) and Differantial Thermal Analysis (DTA) and used as anode in a fuel cell for the first time in literature. Its electrochemical behaviour and performance in the solid oxide fuel cell were carried out using Electrochemical Impedance Spectroscopy (EIS) and Fuel Cell Test Station.
Three types of solid acids, rubidium phosphate tellurate, rubidium selenate with a secondary phase of rubidium hydroxide and cesium dihydrogen phosphate tellurite, were prepared and characterized by SEM, XRD, High Temperature X-ray Diffraction (HT-XRD), TG, DTA, Differential Scanning Calorimetry (DSC) and Energy Dispersive X-ray Spectroscopy (EDS) techniques. All solid acids were tested as electrolyte under various temperatures and atmospheres. Conductivity measurements were performed by EIS.
The results from the study showed that molybdenum vanadium oxide is a good candidate to be used as a mixed ionic and electronic conducting anode in intermediate temperature SOFCs. In addition, it is revealed that advanced solid acid materials have a potential to be used as electrolytes for low and intermediate temperature SOFCs.
xvi
Key words: Mixed ionic and electronic conductor, solid acid, electrolyte, electrode, low
and intermediate temperature solid oxide fuel cells.
YILDIZ TECHNICAL UNIVERSITY GRADUATE SCHOOL OF NATURAL AND APPLIED SCIENCES
xvii
ÖZET
DÜŞÜK VE ORTA SICAKLIK KATI OKSİT YAKIT PİLLERİ İÇİN
YENİ ELEKTROT VE ELEKTROLİT MALZEMELERİ
D. Berceste BEYRİBEY Kimya Mühendisliği Anabilim Dalı
Doktora Tezi
Danışman: Prof. Dr. Seyfettin ERTURAN
Bu tez çalışmasında, çeşitli gelişmiş malzemeler sentezlenmiş, düşük ve orta sıcaklık katı oksit yakıt pilleri için elektrot ve elektrolit malzemesi olarak incelenmişlerdir. Molibden vanadium oksit (V0.13Mo0.87O2.935), yeni bir yöntem ile 60 °C’deki
asitlendirilmiş vanadat-molibdat çözeltisinden hidrojen sülfür gazı geçirilmesi ile elde edilmiştir. Elde edilen karma oksit Taramalı Elektron Mikroskobu (SEM), X-ray Difraksiyonu (XRD), Termogravimetri (TG) ve Diferansiyel Termal Analiz (DTA) yöntemleri ile karakterize edilmiş ve literatürde ilk defa bir yakıt pilinde anot olarak kullanılmıştır. Katı oksit yakıt pillerindeki elektrokimyasal davranışı ve performansı Elektrokimyasal Empedans Spektroskopisi (EIS) ve Yakıt Pili Test Ünitesi kullanılarak belirlenmiştir.
Üç farklı katı asit (kuvvetli asitlerin alkali tuzları); rubidyum fosfat tellurat, rubidyum hidroksit safsızlığı içeren rubidyum selenate ve sezyum dihidrojen fosfat tellurit, hazırlanmış ve SEM, XRD, Yüksek Sıcaklık X-ray Difraksiyonu (HT-XRD), TG, DTA, Diferansiyel Taramalı Kalorimetri (DSC) ve Enerji Dağılımlı X-ray Spektoroskopi (EDS) yöntemleri ile karakterize edilmişlerdir. Tüm katı asitler elektrolit olarak farklı sıcaklık ve atmosferlerde test edilmişlerdir. İletkenlikleri, EIS kullanılarak belirlenmiştir.
Bu çalışmadaki sonuçlar, molibden vanadyum oksidin karma iyonik-elektronik iletken anot olarak orta sıcaklık kati oksit yakıt pillerinde kullanılmak için iyi bir aday olduğunu göstermektedir. Ayrıca, gelişmiş katı asit malzemelerin, düşük ve orta sıcaklık
xviii
katı oksit yakıt pillerinde elektrolit olarak kullanılabileceğini de ortaya koymaktadır.
Anahtar Kelimeler: Karma iyonik-elektronik iletken, katı asit, elektrolit, elektrot,
düşük ve orta sıcaklık katı oksit yakıt pilleri.
1
CHAPTER 1
INTRODUCTION
1.1 Literature Review
Fuel cells are electrochemical devices that convert chemical energy into electrical energy and some heat. Sir William Grove is known as the pioneer of the fuel cell technology and he discovered the basic operating principle of fuel cells by reversing water electrolysis to generate electricity from hydrogen and oxygen in 1839. However, fuel cells were forgotten until the middle of the 20th century and the first commercial use of fuel cells was in NASA space programs to generate power for space capsules. Since then, fuel cells have been used in many other applications such as transportation, stationary power and portable power systems.
Figure 1.1 illustrates a typical fuel cell system. In a typical fuel cell, gaseous fuel and an oxidant are fed continuously to the anode and cathode, respectively. An electric current is produced by the electrochemical reactions take place at the electrodes. Although the components and characteristics of a fuel cell are similar to those of a typical battery, the battery is an energy storage device and its maximum energy capacity is limited by the amount of the reactant stored within the battery itself. On the other hand, the fuel cell is an energy conversion device that theoretically has the capability of producing electrical energy for as long as the fuel and oxidant are supplied to the electrodes. In addition, on contrary to the conventional power generation methods, the fuel cells are not limited by thermodynamic limitations of heat engines such as the Carnot efficiency [1, 2].
2
Figure 1.1 A typical fuel cell system
There are many types of fuel cells and the most common classification of fuel cells is by the type of electrolytes used in the cells:
Alkaline fuel cell (AFC)
Proton exchange fuel cell (PEMFC) Phosphoric acid fuel cell (PAFC) Molten carbonate fuel cell (MCFC) Solid oxide fuel cell (SOFC) Solid acid fuel cell (SAFC)
The choice of electrolyte dictates the operating temperature of the fuel cell. The physicochemical and thermo mechanical properties of materials used in the cell components depend on the operating temperature and useful life of a fuel cell. Table 1.1 lists types of fuel cells and their characteristics.
3
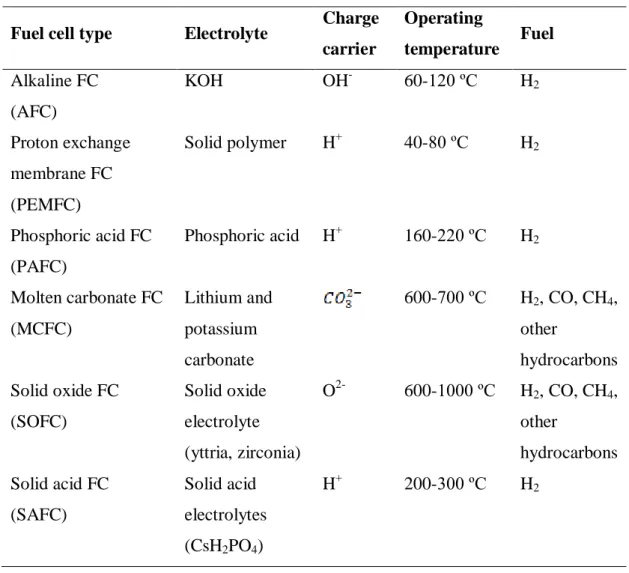
Table 1.1 Types of fuel cells and their characteristics Fuel cell type Electrolyte Charge
carrier Operating temperature Fuel Alkaline FC (AFC) KOH OH- 60-120 ºC H2 Proton exchange membrane FC (PEMFC) Solid polymer H+ 40-80 ºC H2 Phosphoric acid FC (PAFC) Phosphoric acid H+ 160-220 ºC H2 Molten carbonate FC (MCFC) Lithium and potassium carbonate 600-700 ºC H2, CO, CH4, other hydrocarbons Solid oxide FC (SOFC) Solid oxide electrolyte (yttria, zirconia) O2- 600-1000 ºC H2, CO, CH4, other hydrocarbons Solid acid FC (SAFC) Solid acid electrolytes (CsH2PO4) H+ 200-300 ºC H2
Aqueous electrolytes are limited to temperatures of about 200 ºC or lower because of their high vapor pressure and rapid degradation at higher temperatures. In low temperature fuel cells (AFCs, PEMFCs, PAFCs and SAFCs), only pure hydrogen can be used as fuel and all other fuels must be converted to hydrogen prior to entering to the fuel cell. The anode catalyst in low temperature fuel cells is strongly poisoned by unfavorable reactions of catalytic anode materials with sulfur and/or carbon species present in readily available hydrocarbon fuels resulting in performance loss and degradation of the anode. In addition to that, low operating temperatures provide an opportunity to low temperature fuel cells to be used for transport and portable power systems. In high temperature fuel cells (MCFCs and SOFCs), CO, CH4 and other
hydrocarbons can be internally converted to hydrogen or even directly oxidized. Due to their high operating temperatures, high temperature fuel cells have mainly been
4
considered for large-scale stationary power generations. Their high electric efficiencies and fuel flexibilities are two major advantages of high temperature fuel cells over low temperature types [1, 2].
Alkaline Fuel Cell (AFC)
The electrodes are separated by a porous matrix saturated with an aqueous alkaline solution, such as potassium hydroxide (KOH). For low temperature application, concentrated KOH (35-50 wt. %) is used as the electrolyte [1]. Carbon dioxide (CO2)
poisons the AFCs through the conversion of KOH to potassium carbonate (K2CO3),
which irreversibly blocks of the pores in the cathode and reduce the ionic conductivity of the electrolyte. Because of this fact, the main disadvantage of AFCs is the requirement to be operated under pure oxygen or at least purified air.
Proton Exchange Fuel Cell (PEMFC)
The electrolyte in PEMFCs is a proton conductor membrane, commonly fluorinated sulfonic acid polymer. Corrosion problems are minimal in this fuel cell due to the water is only liquid phase formed. However, the membrane needs to be hydrated for efficient performance and this problem restricts the operating temperature (≤ 100 ºC) of PEMFCs.
Phosphoric Acid Fuel Cell (PAFC)
The phosphoric acid fuel cell is the first fuel cell technology to be commercialized [2]. The electrolyte in PAFCs is concentrated phosphoric acid and this fuel cell operates at 160-220 ºC due to poor ionic conductivity of the electrolyte at lower temperatures. The electrocatalyst in both the anode and cathode is platinum and it can be easily poisoned by adsorption of CO and/or sulfur impurities on the active sites.
Molten Carbonate Fuel Cell (MCFC)
In MCFCs, a combination of alkali (generally K, Li) carbonates is used as the electrolyte. The alkali carbonates form a highly conductive molten salt at 600-700 ºC and carbonate ions provide ionic conductivity. Although MCFCs do not require an external fuel reformer due to their high operating temperature, the corrosive electrolyte
5
causes breakdown and corrosion of the components. At high operating temperatures in MCFCs, nickel anode and nickel oxide cathode are adequate to promote reactions [2].
Solid Oxide Fuel Cell (SOFC)
A solid oxide fuel cell consists of an anode and cathode, separated by an electrolyte layer, which allows the transfer of oxygen anions (O2-), formed at the cathode, and prevents the exchange of electrons. Ionically (O2-) conducting solid oxides, such as yttria stabilized zirconia (YSZ), is used as the electrolyte. Air is fed to cathode as the oxidant and oxygen from air is reduced at the cathode, when fuel is oxidized at the anode. Advantages of SOFCs are high efficiency, long-term stability, fuel flexibility, low emission and relatively low cost. The main disadvantage is long start-up times and mechanical and chemical compatibility issues due to their high operating temperatures. More economical component materials can be applied to SOFC systems operating at intermediate temperatures (typically 700-850 ºC), which are known as intermediate temperature solid oxide fuel cells (IT-SOFCs) [3]. The lower operating temperature would solve various problems associated with the high temperature operation, such as densification of electrodes, formation of an insulating layer at the electrode/electrolyte interface by inter diffusion, and crack formation from stress caused by large differences in the thermal expansion coefficients of the cell components [4]. However, one of the major challenges for IT-SOFCs is anode poisoning by unfavorable reaction of anode material with impurities in hydrocarbon fuels, such as sulfur and carbon species.
Sulfur Poisoning of SOFC Anodes
Many economically available fuel sources (syngas, natural gas, diesel etc.) include impurities such as sulfur species. Table 1.2 shows the typical composition and H2S
concentrations of some fuel sources [3]. Hydrogen sulfide (H2S) is the most common
impurity in these fuels [5] and recognized as a problem in operating IT-SOFCs with the conventional anodes such as Ni/Y2O3ZrO2 (Ni/YSZ), which is poisoned byH2S rapidly
and loss its activity for the electrochemical oxidation of hydrogen [6]. Even low H2S
concentrations cause irreversible sulfur poisoning for IT-SOFC, whereas the performance degradation can be reversible for SOFCs operating at high temperatures (>900 ºC). The possible reactions for sulfur-poisoning degradation mechanism of
6 Ni-based SOFC anode can be summarized as [3]:
H2S(g) ↔ HSads + H(g/ads) ↔ Sads +H2(g/ads) (1.1)
Ni + H2S ↔ NiS + H2 (1.2)
3Ni + x H2S ↔ Ni3Sx + x H2 (1.3)
As given above, Ni can react with H2S include chemisorptions (1.1) and sulfidation (1.2
and 1.3) according to different concentration. Another possible reaction is physical adsorption of H2S on nickel.
Although, desulfurization pretreatment of fuel is available for SOFCs, overall system cost can be reduced by developing sulfur tolerant anode materials and cell integrity can be ensured in case of desulfurization system fault. Therefore, the major technical challenge in IT-SOFCs for H2S-containing fuels is to develop alternative anode
materials that are both chemically and electrochemically stable, and catalytically active in H2S-rich environments for low operating temperatures [6, 7].
Table 1.2 Typical composition and H2S concentration of some fuel sources [3]
Fuel type Typical composition H2S concentration
Coal syngas H2, CO, CO2, H2O, N2 100-300 ppm
Biogas H2, CO, CO2, CH4, H2O, N2 50-200 ppm
Natural gas H2, CO2, N2, C2H6, CH4 > 1%
Sulfur Tolerant Anode Materials for SOFCs
Sulfur tolerant anode materials can be summarized in three main groups: Thiospinels and metal sulfides
Metal cermets
Mixed ionic and electronic conductors (MIECs)
Thiospinels are sulfide minerals with a general formula AB2X4 where A is a nominally
7
Thiospinels and metal sulfides have good conductivity and show both catalytic activity toward H2S oxidation and stability in H2S-rich environments. However, their potential
stability and catalytic activity under conventional fuels limit composite sulfide applications in SOFC systems.
Sulfur tolerant metal cermets with a sulfidation resistance up to a thousand ppm of H2S
can be achieved by modification of traditional Ni-YSZ in two ways: a partial or total substitution of Ni with more sulfur tolerant materials in Ni-YSZ and/or a replacement of YSZ by electrolyte material with higher ionic conductivity and stability during H2
S-containing fuels [3].
Mixed ionic and electronic conductors are good candidates for fuel cell anodes due to their both ionic and electronic conductivity. These materials are usually chemically stable in SOFCs at the elevated operating temperatures and their electronic and ionic conductivities can be easily modified by changing their stoichiometry or addition of dopants. Compared with metal-based anodes, transition metal oxide with mixed ionic and electronic conductivity are less likely to suffer from sulfur poisoning. All these desirable properties make MIECs attractive anode materials to be used in IT-SOFCs under sulfur-containing fuels.
Various MIECs have been tested for SOFCs as alternative sulfur-tolerant anodes, such as La0.4Sr0.6TiO3±δ-Y0.2Ce0.8O2-δ (LST-YDC) [8], La0.75Sr0.25Cr0.5Mn0.5O3±δ (LSCM55)
[9], Ce0.9Sr0.1Cr0.5Fe0.5O3±δ (CSCrF) [10], Ce0.9Sr0.1VOx (CSV) [11] and
Co0.5Fe0.5+Sm0.2Ce0.8O1.9 (SDC) [12]. Kurokawa et al. [13] investigated Y-doped
SrTiO3 (SYTO)-YSZ infiltrated with ceria and Ru for 10-40 ppm H2S fuel streams.
They achieved a constant maximum power density of 470 mW cm-2 in 10 ppm H2
S-containing H2 and a sulfur tolerance much higher than that of traditional Ni-YSZ
anodes. On the other hand, Li et al. [14] obtained only 135 mW cm-2 stable power density with undoped BaTiO3 anode in 0.5% H2S-CH4 at 900 ºC. Lu et al. [15] and Zhu
et al. [16] achieved good sulfur tolerant using Pd-impregnated SYT/LDC (Sr0.88Y0.08TiO3-δ/La0.4Ce0.6O1.8) and Y-doped La0.7Sr0.3CrO3-δ anodes, respectively. No
decay in performance was seen for Pd-impregnated SYT/LDC anode in H2 containing
up to 50 ppm H2S. Lohsoontorn et al. [17] showed that the gas composition and
temperature have a significant impact on the interaction of sulfur with nickel-gadolinium-doped ceria (Ni-CGO).
8
Solid Acid Fuel Cell (SAFC)
Solid acid fuel cells utilize an anhydrous, nonpolymeric proton-conducting (solid acid) electrolyte that can operate at slightly elevated temperatures. Solid acids are chemical intermediates between normal salts and normal acids. Physically, the materials are similar to salts. At low temperatures, they have ordered structures. At higher temperatures, however, some solid acids undergo transitions to highly disordered structures that can exhibit anhydrous proton transport. Unlike the polymers in PEMFCs, proton conduction in oxyanion solid acids does not rely on the migration of hydronium ions. Haile and co-workers have showed solid acid proton conductors can be used in both H2/O2 and direct methanol fuel cells [18, 19]. Using supported thin CsH2PO4
electrolyte membranes on porous stainless steel gas-diffusion electrodes, peak power densities as high as 415 mW cm−2 were obtained [20].
Comparing with the traditional PEMFCs, SAFCs can reduce or eliminate the precious metal loadings due to their relatively high operating temperatures. These temperatures additionally imply a high tolerance of the catalysts to poisons, particularly CO, in the fuel stream. Unlike hydrated sulphonated polymers such as Nafion, no water molecules are required to facilitate proton transport in the solid acids, eliminating the need for continuous humidification of reactant gases. Furthermore, anhydrous proton transport eliminates the need for auxiliary humidification equipment and impermeability of the solid acid materials provides measurably higher open circuit voltages. While these many features render solid acids very attractive as fuel cell electrolytes several challenges must be overcame before solid acid based fuel cells can be commercially viable. Prominent amongst these is the water solubility of all known solid acids with high conductivity, which requires the implementation of engineering designs to prevent condensed water from contacting the electrolyte, particularly during fuel cell shutdown [21–23].
Solid Acid Electrolytes
Proton conductivity in the solid acid compounds (e.g., sulphates, selenates and phosphates) arises upon a structural phase transformation at elevated temperature. These transitions create dynamical disorder in the H-bonded XO4 network (where X= S, Se,
9
tetrahedra (Grotthuss mechanism). The main inorganic acids used in the solid acids are given in Table 1.3.
Table 1.3 The main inorganic acids used in the solid acid electrolytes Inorganic acids Molecular
Formula
Molecular structure
pKa values
Sulfuric acid H2SO4 Tetrahedral pKa1 = -3.0
pKa2 = 1.92
Selenic acid H2SeO4 Tetrahedral Similar values
with H2SO4
Phosphoric acid H3PO4 Tetrahedral pKa1 = 2.15
pKa2 = 7.20
pKa3 = 12.37
Arsenic acid H3AsO4 Tetrahedral pKa1 = 2.19
pKa2 = 6.94
pKa3 = 11.5
The dynamic disordering of the hydrogen bond network leads to a dramatic increase in proton conductivity by several orders of magnitude. The transition is called superprotonic phase transition. The proton conductivity at the superprotonic phase transition increases abruptly by several orders of magnitudes and may reach the values
10
up to 10−3–10−2 S cm−1[21, 23]. Table 1.4 represents conductivity and phase transition temperature of various solid acids.
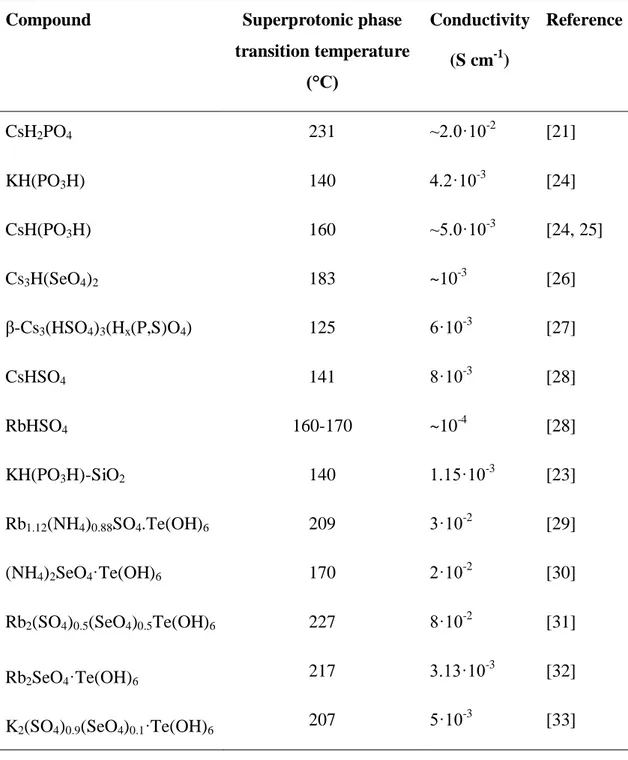
Table 1.4 Conductivity and phase transition temperature of various solid acids
Compound Superprotonic phase
transition temperature (°C) Conductivity (S cm-1) Reference CsH2PO4 231 ~2.0·10-2 [21] KH(PO3H) 140 4.2·10-3 [24] CsH(PO3H) 160 ~5.0·10-3 [24, 25] Cs3H(SeO4)2 183 ~10-3 [26] β-Cs3(HSO4)3(Hx(P,S)O4) 125 6·10-3 [27] CsHSO4 141 8·10-3 [28] RbHSO4 160-170 ~10-4 [28] KH(PO3H)-SiO2 140 1.15·10-3 [23] Rb1.12(NH4)0.88SO4.Te(OH)6 209 3·10-2 [29] (NH4)2SeO4·Te(OH)6 170 2·10-2 [30]
Rb2(SO4)0.5(SeO4)0.5Te(OH)6 227 8·10-2 [31]
Rb2SeO4·Te(OH)6 217 3.13·10
-3
[32]
K2(SO4)0.9(SeO4)0.1·Te(OH)6 207 5·10
-3
[33]
The solid acids with stoichiometry MHXO4, M3H(XO4)2, M2HYO4, or some variation
thereof, are used as superprotonic solid acid electrolytes, where M = alkali metal or NH4; X = S, Se; and Y = P, As. However, implementation of superprotonic solid acids
11
in fuel cells is hindered by a poor chemical and mechanical stability. The alkali–metal hydrogen sulphates and selenates decompose in hydrogen containing atmospheres, whereas their dihydrogen phosphate counterparts need significant levels of humidification; for example, up to water vapour pressure of 0.30 atm for CsH2PO4, to
keep their superprotonic properties.
Cesium dihydrogen phosphate (CsH2PO4) has been the best superprotonic solid acids
known to date. Figure 1.2 illustrates the CsH2PO4 stability phase diagram [34].
Figure 1.2 The stability phase diagram of CsH2PO4 [34]
The increase in the conductivity in solid acid electrolytes is still a dispute. Some researchers attributed the increase in the conductivity to water loss in the material caused by a thermal decomposition reaction where the generated water is responsible for the mobility of protons through the electrolyte material [22, 35]. The solid acid electrolytes decompose by the thermal dehydration through the following chemical reaction (1.4):
12
where n is the number of molecules present in stoichiometric equation, the letter ‘s’ and ‘v’ enclosed in parenthesis denotes that the corresponding compound is in the solid or vapor state.
The other researchers attribute this increase in the conductivity to a phase transition to a high temperature stable superprotonic phase [22]. In that case, the oxyanions acquire higher rotational freedom in the crystal lattice. This leads to a disorder in the hydrogen bonding between the oxyanion groups and allows more combinations of possible hydrogen bond due to the lattice rearrangement. A fraction of the possible hydrogen bonds is occupied enabling the protons to move among the proton vacancies of the lattice (hopping). This conduction mechanism is known as ‘Grotthuss mechanism’. Grotthuss mechanism is separated from the vehicle mechanism due to proton hopping provides the conduction between oxyanions rather than a proton solvent [35]. Figure 1.3 shows the Grotthuss conduction mechanism.
Figure 1.3 Grotthuss conduction mechanism [36] 1.2 Aim of Thesis
Solid oxide fuel cells are promising candidate for future energy conversion systems because they have higher energy conversion efficiency than conventional heat engine systems and other types of fuel cells. Capability of SOFC to use conventional fosil fuels with multiple compositions is essential for commercialization of SOFCs.
Low and intermediate temperature SOFCs have received more attention recently due to the less severe requirements for materials compatibilities at higher temperature. As a result, reducing the SOFC operating temperature may greatly lower fabrication and material cost. Since sulfur tolerance of traditional Ni-YSZ anodes drown drastically at lower temperatures, alternative sulfur tolerant anodes are need to allow the direct use of
13
practical fuels, without the need for extensive reforming and fuel conditioning.
Another issue to be overcome in the field of low temperature SOFCs is the necessity of proton solid electrolytes operating at 160-500 ºC. Recently, solid acid electrolytes such as CsH2PO4 has been gained attention for applications at elevated temperatures up to
300 ºC due to their high conductivity and being not affected by humid atmospheres compared with polymer electrolytes require humid conditions.
The aim of this thesis study is to develop and examine the properties of some advanced materials as electrode and electrolyte for low temperature SOFCs.
1.3 Objectives
The specific thesis objectives are:
1. To prepare and characterize molybdenum vanadium oxide and study its anodic properties in solid oxide fuel cells.
2. To examine effects of the operation parameters, such as temperature, flow rate of fuel and sulfur contamination, on the cell performance.
3. To prepare and characterize solid acid materials (rubidium dihydrogen phosphate tellurate, rubidium selenate with a second phase of rubidium hydroxide and cesium dihydrogen phosphate tellurite) as electrolytes for low temperature SOFCs.
4. To investigate the effects of various parameters (temperature, humidification and test atmospheres) on the protonic conductivity of the synthesized solid acid electrolytes.
14
CHAPTER 2
VANADIUM MOLYBDENUM OXIDE
In this chapter, V0.1Mo0.87O2.935 powder was obtained by reducing acidified vanadate
and molybdate solution at 60 ºC by passing hydrogen sulfide gas through the solution. The obtained mixed ionic-electronic conductor oxide was used as an anode material in SOFCs for the first time in literature and its electrochemical performance was tested at various operation temperatures for intermediate temperature solid oxide fuel cell (IT-SOFC) under pure and 50 ppm H2S containing hydrogen fuel. The highest cell
performance of 0.18 W cm-2 peak power was reached at an operation temperature of 750 ºC for dry H2. It was found that the addition of 50 ppm H2S to the anode gas caused a 22
% decrease in the cell peak power. The loss in the cell performance was attributed to both gas conversion and diffusion. Short-term regeneration tests indicated that 1 hour-exposure to sulfur free gas was insufficient for the reactivation of the cell performance.
2.1 Introduction
Intermediate temperature solid oxide fuel cells (IT-SOFCs) are promising energy conversion and generating system due to their comparative advantages such as high efficiency, low pollution, system compactness and flexibility of fuel selection. Unfortunately, anodes in IT-SOFCs are easily poisoned by the impurities in the gas streams, such as sulfur commonly present in natural gas [5, 9]. Hydrogen sulfide (H2S)
is the most common impurity in these fuels [5] and recognized as a problem in operating IT-SOFCs with the conventional anodes such as Ni/Y2O3ZrO2 (Ni/YSZ),
which is poisoned byH2S rapidly and loss its activity for the electrochemical oxidation
S-15
containing fuels is to develop alternative anode materials that are both chemically and electrochemically stable, and catalytically active in H2S-rich environments [6, 7].
Various Ni-free materials have been tested for SOFCS as alternative sulfur-tolerant anodes [6, 8-12]. However, the most of these materials were found deactivated in H2
S-containing fuels and the contents of various S species on the surface. Eventually, none of them provides all criteria that are required for a successful and effective anode with low polarization resistance and acceptable long-term stability [7].
On the other hand, mixed ionic and electronic conductors are of great interest for their high catalytic and electrochemical properties. These metastable structures often demonstrate new or enhanced properties compared to their thermodynamically stable forms [36-38]. The requirement of multiple preparation steps for synthesis is one of the most important challenges of mixed oxide catalysts [39]. These materials can often be prepared at low temperatures by electrochemical intercalation, inorganic ion exchange, or organic precursor methods [40]. The composition of the oxide elements affects the catalytic performance of mixed oxide materials. Schur et al. [41] reported that the structure and performance of mixed metal oxide catalysts depends on each step of the preparation method. It is rather difficult and demanding to isolate the effects of each preparation parameter upon the structural and performance changes of the resulting catalysts [39]. The preferred preparation method for an effective mixed metal oxide catalyst includes the intimate mixing of all starting chemicals to form a precursor solution [42]. Many researchers in catalysis field have still studied on characterization the active phases or structures of the catalysts and correlation of these active phases or structures with the catalytic performance.
Vanadium-molybdenum oxides have been frequently used in heterogeneous oxidation catalysis due to their high surface acidity. These catalysts have found a wide application in selective partial oxidation, such as benzene to maleic anhydride [43, 44], acrolein to acrylic acid [45], crotonaldehyde to maleic anhydride [43]. The similarity of ionic radius and the structures in the highest oxidation state of V2O5 and MoO3 provides a
unique interaction between these materials. These similarities enable the formation of substitutional solid solutions with structures, which may be interpreted as a shear structure of ReO3 lattice with different oxidation states of cations [46]. As compared to
16
V0.13Mo0.87O2.935 has attracted attention due to its potential applications as a catalyst or
molecular sieve. The ternary oxide of V0.13Mo0.87O2.935 possesses a complex tunnel
structure along the crystallographic c direction. In this structure, the molybdate and vanadate framework consists of zigzag chains of edge-shared octahedral parallel to the c axis; these chains share octahedral corners to create one-dimensional channels [47]. Previously, V0.13Mo0.87O2.935 was obtained by complete dehydration from the protonic
form H0.13V0.13Mo0.87O3·nH2O [40, 48]. This protonic form was synthesized using two
different approaches. The first approach consists of the synthesis of an intermediary brannerite-type phase LiVMoO6 by LiVO3 and MoO3 solid-state reaction. In a second
approach, lithiated mixed vanadium-molybdenum oxide hydrates isotypic with hexagonal MoO3 structure are synthesized by dissolution of V2O5 and MoO3 in LiOH
aqueous solution or by dissolution of LiVO3 and Li2Mo2O7 in water. Afterwards,
Dupont et al. [49] reported a new way of obtaining not only the pure protonic hexagonal MoO3 type oxide hydrate with the ratio V/Mo=0.13/0.87 but also HxVxMo1-xO3·nH2O
phases family with 0.06≤x≤0.18. The synthesis method consists of the dissolution of metallic molybdenum and V2O5 in hydrogen peroxide solution. Then, the solution is
heated until a yellow precipitate (the precursor) appears.
In this part of the study, a new synthesis method of the pure hexagonal V0.13Mo0.87O2.935
is reported. This method is based on reducing acidified vanadate and molybdate solution at 60 ºC by passing hydrogen sulfide gas through the solution. Then, the performance and sulfur tolerance of VxMo(1-x)Oy in IT-SOFCs as an alternative anode material are
reported.
2.2 Experimental
2.2.1 Synthesis and Characterization
0.009 mol ammonium heptamolybdate tetrahydrate ((NH4)6Mo7O24 * 4 H2O) (Merck)
and 0.001 mol ammonium monovanadate (NH4VO3) (Merck) were dissolved in
deionized water (1 liter). Concentrated hydrochloric acid (37%, Sigma-Aldrich) was added to the solution for adjusting the pH to the value of ≤ 1. The solution was then transferred to the two-necked bottle and heated to 60 °C with stirring (Yellowline, MSC basic C) for two hours. VxMo1-xOy particles (VMO) were synthesized by passing
17
hydrogen sulfide (H2S) gas through the solution into the reaction bottle during four
hours. The resultant solids were collected by centrifugation (Nüve, NF615), washed several times with deionized water and acetone and then dried in air at 50 overnight. Scanning electron microscopy (SEM) was carried out by Zeiss Evo 60. X-ray diffraction (XRD) data were recorded at room temperature using Stoe Theta-Theta XRD (40 kV, 30 mA, Cu Kα1) and analyzed using the STOE Win XPOW 2.20 program.
Termogravimetry (TG) and differential thermal analysis (DTA) were carried out using Perkin Elmer TG/DTA-6300 and Netzsch STA 409 CD instruments. Thermal analysis experiment was performed in air (50 ml min-1) with a heating rate of 5 ºC min-1. The measurements were done in the temperature range of room temperature to 700 an 1100 ºC. Samples were grounded with an agate mortar prior the measurements.
2.2.2 Electrolyte Fabrication
YSZ ((Y2O3)0.08(ZrO2)0.92) and ScSZ ((ZrO2)0.90(Sc2O3)0.10) electrolytes were produced
by tape casting. Commercial electrolyte powders (YSZ and ScSZ) (Nextech Materials) was mixed with an organic dispersant and solvent, respectively. After ball milling around 24 h, certain amount of plasticizer and binder were added. The mixture was ball milled again for another 24 h. Then the slurry was tape cast with a blade gap of 170 μm. Six tapes of electrolyte were stacked together and laminated isostatically under 40 MPa pressure for 10 minutes. The laminates were then cut into circle (38 mm in diameter) for YSZ electrolyte and square (79 mm x 79 mm) for ScSZ electrolyte using a laser cutter. The sintering of the electrolyte was performed at two stages. In the first stage, the electrolyte was heated to 1000 °C and held for 2 h. In the second stage, the electrolyte was sintered at 1400 ºC for 4 h. The thickness of the electrolytes was measured as 150 µm after sintering whereas the outer dimensions were reduced to 30 mm in diameter for YSZ and 60 mm x 60 mm for ScSZ.
2.2.3 Cell Preparation
LSCF ((La0.60Sr0.40)(Co0.20Fe0.80)O3−δ) (Nextech Materials) powder was used as the
cathode material. LSCF powders were initially mixed with ethyl cellulose and terpineol at proper ratios (50 wt.% solid loading) to prepare a cathode screen printing paste. After ball milling about 12 h, the cathode paste was screen-printed on the both YSZ and ScSZ
18
electrolytes. The sintering of the cathode was achieved at 1050 ºC for 2 hours. The anode screen printing paste was prepared similarly and screen-printed on the other side of the electrolytes symmetric to the cathode. The anode layers printed on YSZ and ScSZ electrolytes were sintered at 850 ºC for 2 h and 650 ºC for 2.5 h, respectively. Then, two cells were ready for testing. The active area of the cells was 1 cm2 with YSZ electrolyte (Cell A) and 16 cm2 (4 cm x 4 cm) with ScSZ electrolyte (Cell B).
2.2.4 Cell Testing
The single cells was placed between two stainless steel interconnectors with nickel foam and stainless steel mesh which were respectively used as anode and cathode current collectors. The details of the short stack configuration can be found elsewhere [50-52].
2.2.4.1 The Cell A
Figure 2.1 illustrates the anode and cathode surfaces of the produced single cell (VMO/YSZ/LSCF) with 1 cm2 active area. Ag paste was applied as a current collector and the single cell was placed between two stainless steel interconnectors (Figure 2.2) for the performance tests. The experiments were conducted in the temperature range of 700-800 ºC for the Cell A. After the temperature was stable, dry hydrogen (pH2O<0.001
bar) with the rate of 1.0 L min-1 were introduced to anode side of the single cell while ambient air was used as oxidant at the cathode side. Current and power densities of the Cell A were obtained using a fuel cell test station (Arbin Instruments FCTS, TX, USA) (Figure 2.3) which has a temperature controlled furnace with a push rod pressing capability to improve the contact between the cell and interconnectors. Scanning electron microscopy, on the other hand, was through Carl Zeiss Evo 40.
19
(a) (b)
Figure 2.1 The (a) anode and (b) cathode surface of the produced Cell A
(VMO/YSZ/LSCF) with 1 cm2 active area
20
Figure 2.3 The fuel cell test station 2.2.4.2 The Cell B
Figure 2.4 shows the anode and cathode surfaces of the produced single cell (VMO/ScSZ/LSCF) with 16 cm2 active area. No paste was applied as a current collector and the single cell was placed between two stainless steel interconnectors for the performance tests (Figure 2.5). All experiments were conducted in the temperature range of 650-750 ºC for the Cell B. After temperature was stable, various flow rates of hydrogen between 0.5-2.0 L min-1 were introduced to anode side of the single cell while ambient air was used as oxidant at the cathode side. The measurements were performed under dry hydrogen (pH2O<0.001 bar) and dry hydrogen containing 50 ppm hydrogen
sulfide. Performance curves were obtained using a fuel cell test station (Arbin Instruments FCTS, TX, USA) (Figure 2.3).
Electrochemical impedance spectra were recorded under fuel cell test environment using a Parstat 2273 frequency response analyzer. Impedance measurements were carried out over the frequency range of 100 kHz to 0.01 Hz under open circuit voltage (OCV). Data analysis was done using the software ZSimpWin 3.21, supplied by Princeton Applied Research. Scanning electron microscopy was through Carl Zeiss Evo 40.
21
(a) (b)
Figure 2.4 The (a) anode and (b) cathode surface of the produced Cell B
(VMO/ScSZ/LSCF) with 16 cm2 active area
22
2.3 Results and Discussions
2.3.1 Structural and Thermal Analysis
SEM micrograph was taken in order to determine the crystalline size and morphology. The morphology of V0.13Mo0.87O2.935 powder is shown in Figure 2.6. Synthesis resulted
in V0.13Mo0.87O2.935 particles with diameters in the range of about 200 nm to 2-3 μm.
(a)
(b)
Figure 2.6. The SEM image of synthesized V0.13Mo0.87O2.935 powder; (a) 1000 X, (b)
23
In order to investigate the thermal stability of the V0.13Mo0.87O2.935 powder, thermal
analysis (TG and DTA) were conducted. Figure 2.7 shows the TG and DTA curves of V0.13Mo0.87O2.935 from room temperature to 700 ºC. As shown in Figure 2.7 (a),
approximately 9 wt.% weight loss was observed in the range of 30-420 °C due to the eliminating of adsorbed sulfur and remained ammonium groups as NH3 and/or NOx.
Some unreacted ammonium heptamolybdate and ammonium monovanadate are responsible of the remained volatiles.
100 200 300 400 500 600 700 -0.2 0.0 0.2 0.4 (b) D T A ( m V /mg ) T G% Temperature,oC 100 200 300 400 500 600 700 90 95 100 (a)
Figure 2.7 (a) TG and (b) DTA analysis of synthesized V0.13Mo0.87O2.935 powder up to
700 ºC
In the DTA measurement seen in Figure 2.7 (b), the main features of the DTA trace for the reaction in air were a large exotherm (peak maximum 150 °C) attributed to reaction of adsorbed sulfur with oxygen, a large endoterm (peak maximum 245 °C) due to the eliminating the volatile compounds and a sharp endotherm at 430 °C representing phase transformation. While cooling from a maximum temperature of 700 °C, no reverse is seen in Figure 2.4 (b). This phase transition temperature is lower than the previously reported values of 460 °C [48] and 480 °C [49]. Dupont et al. [49] showed that hexagonal V0.13Mo0.87O2.935 is stable up to 480 °C and above this temperature, this solid
24
is irreversibly transformed into a stable orthorhombic mixed oxide, isotypic to a-MoO3,
which retains the same V/Mo = 0.13/0.87 ratio. Therefore when calcined at Tc = 400 °C, these Mo, V mixed phases could be transformed into orthorhombic V0.13Mo0.87O2.925. Moreover, Dupont et al. [49] reported that the heating of the
orthorhombic V0.13Mo0.87O2.925 around 600 °C induces the formation of a liquid phase
and a solid phase chemical composition. In contrast to their results, no evidence was found for the formation of a liquid phase in our experiments.
Because of no decomposition was seen up to 700 °C, a second thermal analysis was done up to 1100 °C to determine the decomposition temperature of the mixed oxide, as given in Figure 2.8. Another mass loss with a value of 15 wt.% is attributed to the sublimation of MoO3 formed by segregation of V0.13Mo0.87O2.935 (between 750-795 °C).
As seen in Figure 2.8, DTA profile of the compound represents a large exothermic effect upon heating from room temperature to 750 °C. The reaction of adsorbed sulfur with oxygen and segregation of V0.13Mo0.87O2.935 might be responsible of that
exothermic effect. The segregation of V0.13Mo0.87O2.935 (above 600 °C) is given with the
following reaction [37, 49]:
V0.13Mo0.87O2.935 → V2MoO8- type phase + MoO3 (2.1)
At higher temperatures, sublimation of MoO3, which has a sublimation temperature of
795 °C [53], occurs and the mass loss reaches at 100 wt.% by the temperature of 830 °C.
25 100 200 300 400 500 600 700 800 900 1000 1100 0 10 20 30 40 50 60 70 80 90 100 0 5 10 15 20 25 30 DTA TG Exo D T A /( V ) Temperature (C) T G ( %)
Figure 2.8 Thermal analyses (TG and DTA) of the synthesized V0.13Mo0.87O2.935 powder
up to 1100 ºC
Figure 2.9 demonstrates the XRD pattern of synthesized powder, which are in good agreement with hexagonal V0.13Mo0.87O2.935 phase with lattice parameters of a= b= 10.59
Å and c= 3.69 Å (# 48-0766 in the JCPDS database, space group P63). The XRD pattern
26 10 20 30 40 50 60 70 0 2000 4000 6000 8000 2
Figure 2.9 XRD pattern of synthesized V0.13Mo0.87O2.935 powder
2.3.2 Cell Testing
2.3.2.1 The Cell A
Performance Tests
To determine the catalytic activity of V0.13Mo0.87O2.935 as anode material, it was tested in
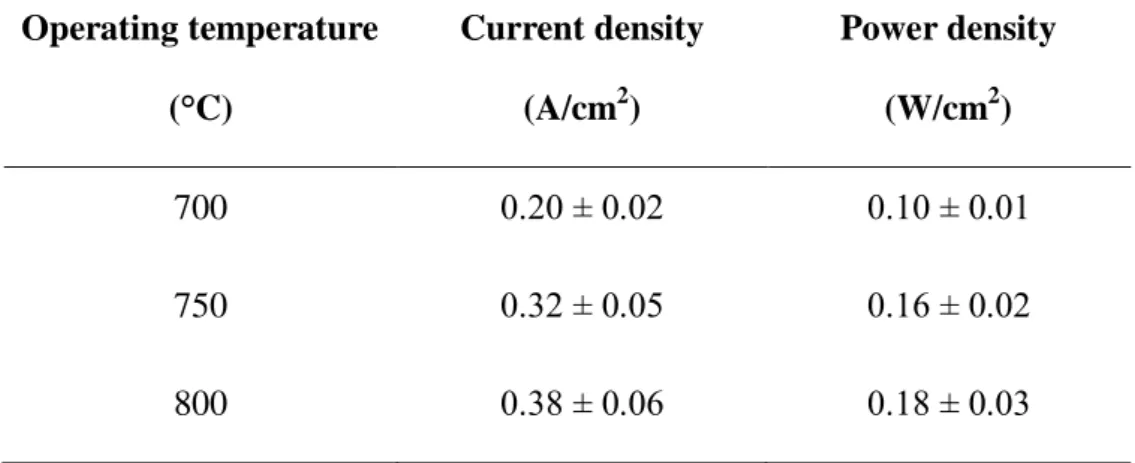
the cell for the temperatures of 700, 750 and 800 °C. The effect of temperature on the current density and the power is given in Table 2.1. As it is seen in Table 2.1, current density and power increases by increasing temperature. 0.38 ± 0.06 A cm2 current density and 0.18 ± 0.03 W power was obtained at 800 °C in the cell.
27
Table 2.1 The effect of temperature on the current density and the power of the cell Operating temperature (°C) Current density (A/cm2) Power density (W/cm2) 700 0.20 ± 0.02 0.10 ± 0.01 750 0.32 ± 0.05 0.16 ± 0.02 800 0.38 ± 0.06 0.18 ± 0.03
The effect of temperature on OCV is shown in Figure 2.10. The results showed that OCV values of the cell are close to the theoretical value.
700 750 800 0.9 1.0 1.1 1.2 1.3 O p e n c ir c u it v o lta g e (V) Temperature (C)
28
Surface Analysis
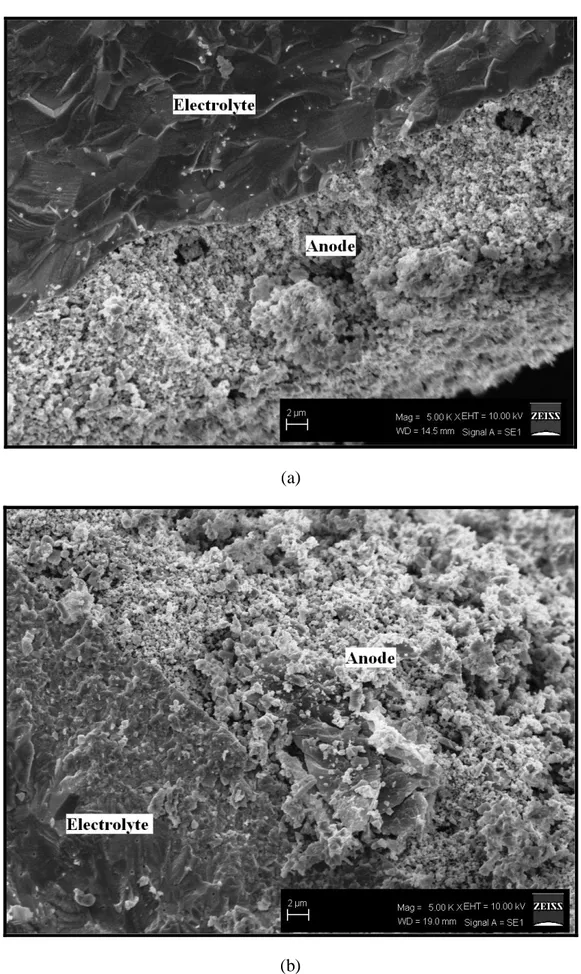
Figure 2.11 denotes the details of the pre-tested and post-tested anode surface, while Figure 2.12 shows the microstructure of the cross section of the pre-tested and post-tested cell. As seen in Figure 2.11, the anode possesses porous structure (Figure 2.11 (a)) whereas the YSZ electrolyte is seen to be uniform, continuous and dense (Figure 2.12 (a)). It seems VMO anode is stable under dry hydrogen and no remarkable deformation is seen between the anode and the electrolyte (Figure 2.12 (b)). On the other hand, it is obvious that nano-sized VMO particles grow under reducing atmosphere (Figure 2.11 (b)) and reaches to micro-scale. Characteristic needle structure of V0.13Mo0.87O2.935 particles can be easily seen in Figure 2.11 (b).
29 (a)
(b)
Figure 2.11 SEM images of the (a) pre-tested and (b) post-tested anode surface
30 (a)
(b)
Figure 2.12 SEM images of the cross section of the (a) pre-tested and (b) post-tested
31
Several parameters influence the physicochemical as well as the catalytic properties of the mixed oxides. The nature and crystallinity of phases and the surface composition of the synthesized catalyst depend on the temperature of calcination (Tc). Therefore, even
though the cell showed relatively lower current density and power, it is possible to enhance the performance of the cell by changing the calcination medium of the metal oxide or firing temperature of the cell as it was presented in the literature [50, 51]. It is obvious that VxMo(1-x)Oy can be used as anode materials in solid oxide fuel cells.
2.3.2.2 The Cell B
Performance Tests
Figures 2.13-2.15 show the cell voltage and power density as a function of the current density at operation temperatures of 650, 700 and 750 °C for various dry hydrogen flow rates, respectively. It is seen that the cell performance tends to increase with increasing the hydrogen flow rate at all temperatures as expected. However, the effect of the hydrogen flow rate on the cell performance is extremely significant at 650 °C operation temperature (Figure 2.13), comparing with that at higher operation temperatures can be seen at 700 and 750 °C operation temperatures (Figure 2.14 and Figure 2.15). It seems concentration polarization is extremely effective limiting the cell performance at 650 °C operation temperature. Concentration polarization mainly dominates at low voltage regions (≤0.4 V) and as seen in Figure 2.13, it surprisingly limits the cell performance at about 0.8 V in 0.5 L min-1 H2 flow. By increasing the hydrogen flow rate, the cell
performance enhances due to the decrease in the ohmic polarization while the concentration polarization still limits the cell performance at high voltages.
32 0.00 0.02 0.04 0.06 0.08 0.10 0.12 0.0 0.2 0.4 0.6 0.8 1.0 1.2 1.4 1.6 0.00 0.01 0.02 0.03 0.04 0.05 0.06 2 L min-1 H2 1.5 L min-1 H2 1 L min-1 H2 0.5 L min-1 H2 Po w e r d e n s ity ( W cm -2 ) Current densitiy (A cm-2) Vo lta g e (V)
Figure 2.13 The voltage and power density output versus the current density under
various flow rates of dry H2; T= 650 ºC
The single cell exhibited almost 1 W (~0.06 W cm-2) maximum power output at 650 °C operation temperature when the hydrogen flow rate was set to the maximum (2 L min-1). Similar behaviour can be seen at 700 and 750 °C operation temperatures Figure 2.14 and Figure 2.15. The highest cell performance was obtained at maximum hydrogen flow rate at both operation temperatures. The cell provides 1.76 W (~0.11 W cm-2) and 2.88 W (0.18 W cm-2) peak power at 700 °C and 750 °C, respectively. Moreover, concentration polarization finally dominates to limit the cell performance at low voltage region (~0.4 V) at 750 °C operation temperature. Furthermore, at all operation temperatures considered, the open circuit potential was around 1.17 V which was very close to the theoretical one indicating that the electrolyte is fully dense.
33 0.00 0.05 0.10 0.15 0.20 0.25 0.00 0.02 0.04 0.06 0.08 0.10 0.12 Vo lta g e (V) Po w e r d e n s ity ( W cm -2 ) Current densitiy (A cm-2) 2 L min-1 H2 1.5 L min-1 H2 1 L min-1 H2 0.5 L min-1 H2 0.0 0.4 0.8 1.2 1.6 2.0
Figure 2.14 The voltage and power density output versus the current density under
34 0.0 0.1 0.2 0.3 0.4 0.5 0.00 0.05 0.10 0.15 0.20 Vo lta g e (V) Po w e r d e n s ity ( W cm -2 ) Current densitiy (A cm-2) 2 L min-1 H2 1.5 L min-1 H2 1 L min-1H2 0.5 L min-1 H2 0.0 0.2 0.4 0.6 0.8 1.0 1.2 1.4
Figure 2.15 The voltage and power density output versus the current density under
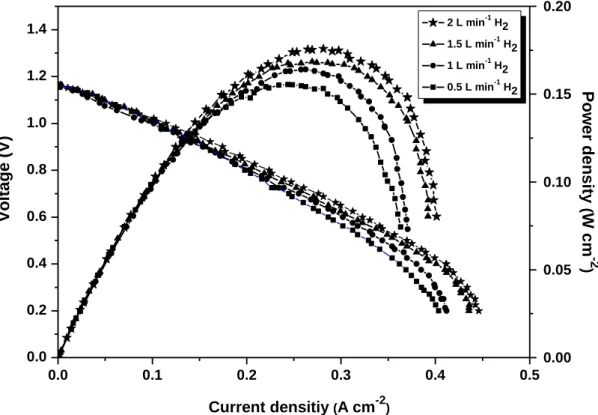
various flow rates of dry H2; T= 750 ºC
Figure 2.16 shows the cell voltage and power density as a function of the current density at an operation temperature of 750 ºC in dry H2 and 50 ppm H2S-containing dry
H2 with a flow rate of 2 L min-1. The cell was first stabilized in pure hydrogen gas until
a steady open circuit potential was observed. Then the current-voltage (i-V) and the current-power (i-P) curves were recorded under both dry H2 and 50 ppm H2S-containing
dry H2 to figure out the effect of H2S on the cell performance. The results show that
50 ppm H2S contamination causes a 22 % decrease in the peak power density from 0.18
W cm-2 to 0.14 W cm-2 at 750 ºC. Pillai et al. [54] tested a solid oxide fuel cell with Ni-YSZ anode supported on Sr0.8La0.2TiO3 in H2 containing 100 ppm H2S and observed a
20 % decrease in the peak power density at 800 ºC. In a similar study, Kurokawa et al. [13] found ca. a 10 % decrease in the power density at 800 ºC, testing a SOFC with a Y-doped SrTiO3 anode in 10 ppm H2S-containing H2. These results are comparable with
our observation on the cell performance under H2S-containing H2.
After switching to sulfur-free gas (pure H2) for 1 hour, no reactivation of the cell was