ASSESSMENT OF NUTRITIONAL STATUS USING
ANTHROPOMETRIC MEASUREMENTS IN TURKISH
ADULTS
Başak KOCA ÖZER
*, Timur GÜLTEKİN
** AbstractNutritional status is one of the most important indicators that help to elaborate public health, as well as socio-economic status. Based on this point to determine the nutritional status of the Turkish adult population (ages between 18-59 years), in accordance with the International Biological Program, height, weight, biceps circumference, and triceps skinfold thickness measurements were collected from 1215 healthy adults (703 males and 512 females). The upper arm muscle and fat areas, and body mass index were calculated. Protein and fat reserves of individuals were evaluated and, in accordance with the International Obesity Task Force (IOTF) criteria low weight, overweight and obesity status were determined. According to the study results male height was found to be 174 cm and weight 78 kg, and for females 159 cm and 67 kg, respectively. All variables were statistically significant in terms of sexes, and this result is expected due to the high sexual dimorphism in our country. Both male and female upper arm muscle areas (AMA) are consistent with age, whereas the upper arm fat area (AFA) values tend to increase with age. Low-weight ratio was very low among the sample however, overweight ratio were found 48% for males, and 36% for females. In terms of obesity, females (22%) showed higher values compared to the males (9%). In conclusion, the prevalence of high risk that have found in the present study for both sexes should be handled with care, and coronary heart disease, hypertension, some types of cancer and many chronic diseases like diabetes that known with the relationship of high body fatness should follow with comprehensive anthropometric studies.
Keywords: Nutritional level, Anthropometry, Body Mass Index, Arm
anthropometry, Adult population, Turkey.
*
Doç. Dr., Ankara Üniversitesi, Dil ve Tarih-Coğrafya Fakültesi, Antropoloji Bölümü, Fizik
Antropoloji Anabilim Dalı, [email protected]
** Prof. Dr., Ankara Üniversitesi, Dil ve Tarih-Coğrafya Fakültesi, Antropoloji Bölümü, Fizik
Öz
Türk Erişkinlerinde Beslenme Düzeyinin Antropometrik Veriler Yardımıyla Değerlendirilmesi
Beslenme durumu toplumların gerek sağlık, gerekse sosyo-ekonomik durumlarının irdelenmesinde yardımcı olan önemli biyolojik göstergelerden birini oluşturmaktadır. Bu noktadan yola çıkarak, Türk erişkin toplumunda beslenme durumunun belirlenmesi amacıyla 18-59 yaş aralığında bulunan 1215 sağlıklı erişkinden (703 erkek ve 512 kadın) International Biological Program doğrultusunda boy, ağırlık, gevşek biceps çevresi ve triceps deri kıvrım kalınlığı ölçümleri alınmıştır. Üst kol kas ve yağ alanları ile beden kitle endisleri hesaplanarak, bireylerin protein ve yağ rezervleri ile International Obesity Task Force (IOTF) kriterlerine göre düşük ağırlık, yüksek ağırlık ve şişmanlık durumları belirlenmiştir. Çalışma sonuçlarına göre erkeklerde boy 174 cm ve ağırlık 78 kg, kadınlarda ise sırasıyla 159 cm ve 67 kg olarak tespit edilmiştir. Cinsiyetler açısından değerlendirildiğinde tüm değişkenlerin istatistikî açıdan anlamlı farklılık gösterdiği görülmekte, özellikle seksüel dimorfizmin belirgin olduğu ülkemizde bu sonuç beklenilen düzeydedir. Hem erkek hem de kadınlarda üst kol kas (AMA) alanı yaşa bağlı tutarlı bir yapıda seyretmekte, buna karşın üst kol yağ (AFA) alan değerleri yaşla birlikte bir artış eğilimi göstermektedir. Düşük ağırlık oranının örneklemde çok düşük düzeyde olduğu buna karşın, yüksek ağırlık oranları erkeklerde % 48, kadınlarda ise % 36 düzeyinde bulunmuştur. Obezite açısından ise kadınlar (% 22) erkeklere (% 9) oranla oldukça yüksek değerler sergilemişlerdir. Sonuç olarak her iki cinsiyet açısından da tespit ettiğimiz yüksek risk prevelansı dikkatle ele alınmalı ve koroner kalp hastalıkları, hipertansiyon, bazı kanser türleri ve diyabet gibi pek çok kronik hastalıkla olan ilişkisi bilinen yüksek vücut yağlılığının seyrinin kapsamlı antropometrik araştırmalarla takibi sağlanmalıdır.
Anahtar sözcükler: Beslenme durumu, Antropometri, Beden Kitle Endisi, Kol
antropometrisi, Erişkin, Türkiye.
Introduction
Public health is related to individuals’ adequate and balanced diet, their physical activity habits, their socio economic improvement, and living quality. In fact, protein-energy malnutrition (PEM), iron anaemia, iodine deficiency, rickets, dental diseases, obesity, coronary heart diseases, hypertension, certain types of cancer, diabetes and osteoporosis and many other diseases appear as a result of nutritional deficiencies (Pekcan, 7). Consequently, the state of nutrition is placed among the important criteria which show the situation of the society from many respects (Applegate, 150-262).
Being one of the methods used to determine the state of nutrition, the anthropometric method is widely in use among many scientists because of the fact that it provides an abundance of data and mainly because they are practical and economical in field usage. The body mass index (BMI, Quetelet Index) enables us to obtain important data concerning the determination of body fat mass and fat free mass as well as their ratios to each other and, their way of distribution throughout the body and the individuals’ state of nutrition (Applegate 164-167). Being a tool for the proportional evaluation of the individual’s height and weight in the evaluation of obesity that has recently been considered epidemic, BMI makes up the subject matter of numerous studies. Similarly, upper arm girth and triceps skinfold thickness measurements, which are among the variables studies in many anthropometric surveys, supply us with important information about the individual nutritional states. Cross- sectional field studies of the upper arm provide a lot of information regarding the relative amount of the target individuals’ muscle and fat tissues as compared to their overall arm area and, under this context, about the individual’s level of diet. The upper arm muscle area indicates the individual’s organic protein reserves and, from that point, the protein energy malnutrition (PEM) state (Lukaski, 109). The upper arm fat area (AFA) shows the fat reserves (Gültekin et al. 231).
In spite of the fact that high weight and obesity are among the biggest health problems faced by today’s globalizing world, low weight and hence chronic energy deficiency are the top issues that need tackling seriously on the part of developing countries (Kiple, 307-322). When assessed in terms of low weight adults, it is known that labour force based on physical power is greatly affected by this factor for economic reasons, and that, from the respect of public health, low state in environmental conditions is moved to the adult dimensions depending especially on the childhood period. Low weight is as well associated with adult mortality as with labour capacity. In field studies made in this context, the World Health Organization frequently resorts both to upper arm anthropometry and BMI.
It is seen that high weight and obesity rates are rapidly increasing across the world with a different prevalence, especially in Europe today. Obesity in the USA appears to be 28% in males and 34 % in females. In some parts of Europe, it is reported that high rates of weight and obesity rates have reached 67% in overall averages even surpassing the values of the USA (WHO 2000). Studies carried out on overweight Germans between 1985-2002 shows that today this value is far above those of the USA and results of the most recent studies indicate the appearance of a percentage of 75 for males
of over 25 years of age. What is to be taken into consideration at this point is that the WHO specially stresses the risk caused by the overweight recently, when obesity’s association with many chronic diseases is subject to arguments. High risk ratio not only appears with obesity but also at BMI’s lower levels (BMI>25) (IOTF 2003, Lobstein et al. 2005).
The purpose of the study is to evaluate the state of nutrition in Turkish adult population by means of anthropometric data and determine the amount of body protein and fat reserves and the low weight, high weight and obesity prevalence in terms of sexes and age groups.
Material and Method
Study sample consisted from 1215 healthy adults (703 males and 512 females) of between 18-59 years of age living in Ankara, the capital city of Turkey. Survey was conducted between 2004 and 2005 years. Under the scope of the cross sectional studies, the variables of each individual’s birth place and dates, educational level, occupation, number of children and dates were collected to determine the socio economic level by means of questionnaire method.
In order to determine the state of nutrition, techniques specified under the International Biological Program (Weiner and Lourie 1969) were carried out and weight (kg) was measured with digital scale sensitive to 100 grams, height (cm) with Martin type anthropometry sensitive to millimetre, triceps skinfold thickness with Harpenden type skinfold (mm) sensitive to millimetre and loose biceps circumference (mm) with type sensitive to millimetre. The upper arm muscle area (AMA) (Formula 1) and upper arm fat area (AFA) (Formula 2) were calculated by means of the following formulas (Frisancho 1981). For the Low weight, high weight and obesity indicators 5th, 85th and 95th percentile values were calculated.
AMA (mm2) = [c - (π * TS)] ² / 4*π (Formula 1)
AFA (mm2) = (c2 /4 * π) – AMA (Formula 2)
One of the other important indicators for state of nutrition, the body mass index (BMI) (kg/m2) was calculated and, by using the International
Obesity Task Force (IOTF) (IOTF 2003, Lobstein, Rigby and Leach 2005) and the World Health Organization’s (WHO 2000) reference criteria low weight (BMI<18.5), overweight (25>BMI<29.9) and obesity (BMI>30) were determined. Differences between sex and age groups were analyzed with the help of student-t test and ANOVA by using SPSS 13.0 software.
Centiles were constructed by using the LMS-method (Cole and Green 1992, Cole et al., 1998). This method summarizes the centiles by three smooth curves: the L-curve (Box-Cox power transformation to remove skewness), M-curve (median) and S-curve (coefficient of variation). Each curve is estimated as a cubic spline using maximum penalized likelihood.
P= M (1 + LSZ)1/L
Results
Socio economic level indicators of the individuals are presented in Table 1. According to this, individuals that underwent high school education are represented with 57%, and primary school graduates (when primary and secondary schools are evaluated together) and university graduates are seen to have been represented closer to each other. Based on the evaluation in terms of occupational groups, almost half of the individuals were found to be civil servants. When two basic criteria –education status and occupation- are considered to be the best indicators to determine the socio economic level, it can be said that the sampling is mostly composed of individuals at medium socio economic level and that individuals belonging to lower and upper socio economic strata are represented quite close to each other.
Table 1- Socio-economic indicators of the sample
Education n % Number of Children n %
Illiterate 5 0.40 0 449 37.00 Elementary school 175 14.40 1 285 23.50 Secondary School 91 7.50 2 336 27.70 High School 688 56.60 3 107 8.80 University 256 21.10 4+ 38 3.20 Occupation Region
Administration Staff 82 6.75 Marmara Region 51 4.20
Civil Servant 584 48.07 Aegean Region 41 3.40
Dealer, Technician 28 2.30 Mediterranean Region 95 7.80
Retired 74 6.09 Central Anatolia 690 56.80
Labour, helper 197 16.21 Black Sea Region 171 14.10
Student 88 7.24 Eastern Anatolia 122 10.00
Housewife 161 13.25 South-eastern Anatolia 37 3.00
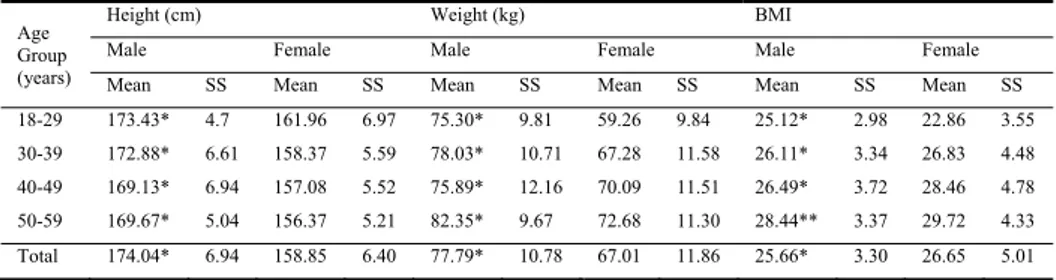
As a result of the anthropometric analyses, it was found that the mean male height was 174 cm and weight was 78 kg where 159 cm and 67 kg for females, respectively (Table 2). When compared by sexes, height, weight and BMI values are seen to significantly differ in terms of statistics. This result is expected for Turkish population due to the high sexual dimorphism.
Table 2- Height, weight and BMI values by age and sex Age
Group (years)
Height (cm) Weight (kg) BMI
Male Female Male Female Male Female
Mean SS Mean SS Mean SS Mean SS Mean SS Mean SS 18-29 173.43* 4.7 161.96 6.97 75.30* 9.81 59.26 9.84 25.12* 2.98 22.86 3.55 30-39 172.88* 6.61 158.37 5.59 78.03* 10.71 67.28 11.58 26.11* 3.34 26.83 4.48 40-49 169.13* 6.94 157.08 5.52 75.89* 12.16 70.09 11.51 26.49* 3.72 28.46 4.78 50-59 169.67* 5.04 156.37 5.21 82.35* 9.67 72.68 11.30 28.44** 3.37 29.72 4.33 Total 174.04* 6.94 158.85 6.40 77.79* 10.78 67.01 11.86 25.66* 3.30 26.65 5.01 * p<0.001, **p<0.05
Tables 3 and 4 present the L, M, S values, as well a selected percentiles of height, weight, BMI, AFA and AMA values for both sexes.
Table 3- L, M, S values, and selected percentiles of height, weight, BMI, AFA and AMA values for males
L M S P5 P10 P25 P50 75 P90 P95 Weight 0,56 76,36 0,14 55,77 62,32 69,18 76,36 83,84 91,63 99,73 Height 2,93 170,14 3,59 156,96 161,59 165,97 170,14 174,13 177,94 181,60 BMI 0,46 26,51 0,13 20,01 22,07 24,23 26,51 28,89 31,39 34,00 AFA 0,13 1459,85 0,47 530,66 755,01 1057,44 1459,85 1988,95 2677,04 3562,89 AMA 0,53 5116,33 0,19 3308,28 3870,24 4473,06 5116,33 5799,69 6522,79 7285,32
Table 4- L, M, S values, and selected percentiles of height, weight, BMI, AFA and AMA values for females
L M S P5 P10 P25 P50 75 P90 P95 Weight -0,29 67,59 0,16 49,48 54,73 60,72 67,59 75,49 84,62 95,23 Height -0,31 157,51 3,47 147,06 150,44 153,92 157,51 161,20 165,02 168,95 BMI -0,63 27,10 0,16 20,34 22,25 24,48 27,10 30,21 33,94 38,49 AFA 0,22 2955,62 0,37 1331,14 1764,92 2301,06 2955,62 3746,11 4691,46 5812,10 AMA -7,42 3348,18 0,25 2039,25 2405,26 2837,53 3348,18 3951,52 4664,53 5507,33
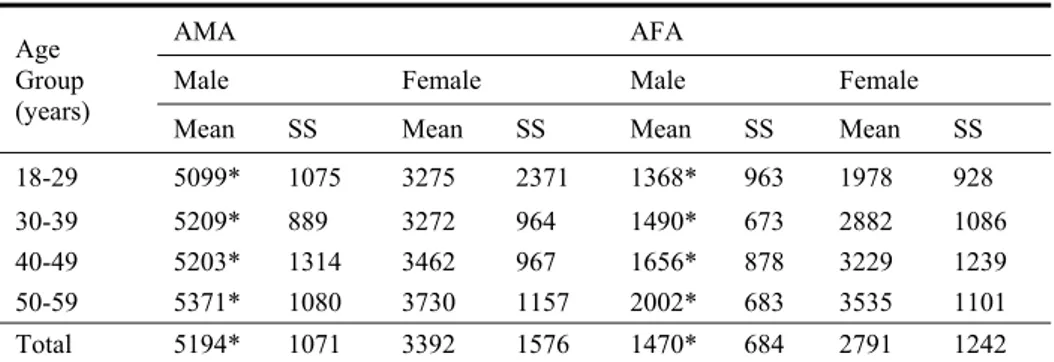
Evaluation of the upper arm anthropometry showed that sexual dimorphism is also common among the sex, and statistically significant as seen by Table 5. In both males and females, upper arm muscle (AMA) area ranges consistently in an age-related manner whereas upper arm fat (AFA) area tend to increase with age. High values of AFA especially common in females, and for 30-39, 40-49 and 50-59 age groups were found out to be far higher than males and tend to increase gradually.
Table 5- Upper arm muscle (AMA) and fat area (AFA) measurements (mm2) by age and sex in Turkish Adults
Age Group (years)
AMA AFA
Male Female Male Female
Mean SS Mean SS Mean SS Mean SS
18-29 5099* 1075 3275 2371 1368* 963 1978 928 30-39 5209* 889 3272 964 1490* 673 2882 1086 40-49 5203* 1314 3462 967 1656* 878 3229 1239 50-59 5371* 1080 3730 1157 2002* 683 3535 1101 Total 5194* 1071 3392 1576 1470* 684 2791 1242 * p<0.001
Table 6 provides the critical values of 5th, 85th, and 95th percentile values for BMI and AFA which are referred to in anthropometric studies as a relative indicator of the body fatness state. The result of the general assessment indicates that low weight poses no problem for both sexes and in terms of two anthropometric variables but that it points to quite high values when handled in terms of being an obesity indicator.
Table 6- Upper arm fat area (AFA) and Body Mass Index (BMI) percentiles by age and sex in Turkish Adults
Age Group (years) Percentile AFA Male Female BMI AFA BMI 18-29 85 5 2002 616 20.23 27.92 2690 855 18.34 26.50 95 2335 29.77 3634 29.93 30-39 85 5 2140 621 21.07 29.31 1232 3941 19.70 31.20 95 2743 32.15 4944 35.71 40-49 5 571 20.77 1516 21.71 85 2713 30.45 4472 32.98 95 3522 31.93 5656 37.00 50-59 5 911 23.25 1887 23.56 85 2562 32.27 4537 34.70 95 3824 35.20 5398 38.15
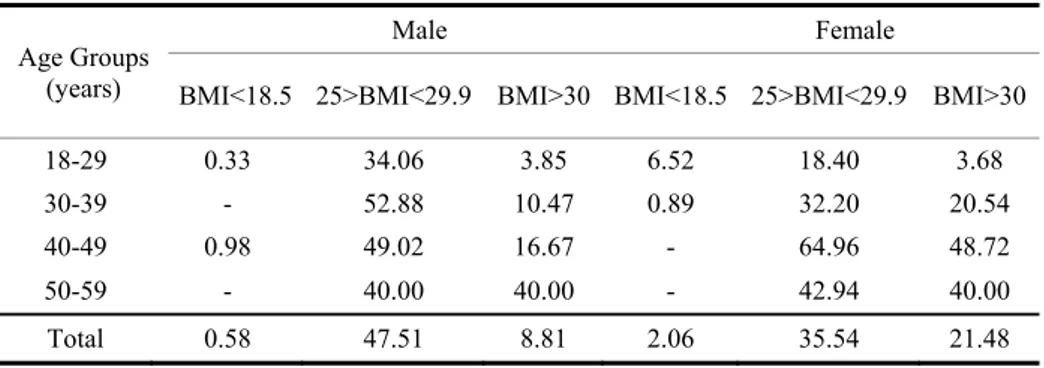
Criteria recently recommended especially by such global organizations as WHO and IOTF were used in our study for determination of the ratios of low weight, overweight and obesity. As seen in Table 7, low weight ratio was found to be 1% in males and 2% in females. Overweight ratios are represented at the level of 48% in males and 36% in females. The high weight percentage that we found to be of far higher level in males than females was seen to have been represented by obesity percentage which is higher in females (22%) than males (9%)
Table 7- Underweight, overweight and obesity prevalence (%) using IOTF reference criteria (Lobstein et al. 2005) by age and sex in Turkish Adults
Age Groups (years)
Male Female BMI<18.5 25>BMI<29.9 BMI>30 BMI<18.5 25>BMI<29.9 BMI>30
18-29 0.33 34.06 3.85 6.52 18.40 3.68 30-39 - 52.88 10.47 0.89 32.20 20.54 40-49 0.98 49.02 16.67 - 64.96 48.72 50-59 - 40.00 40.00 - 42.94 40.00 Total 0.58 47.51 8.81 2.06 35.54 21.48 Discussion
The agro and animal husbandry based type of human diet has developed along his evolutionary process, with the transition from hunter-gathering to settle life has provided important data for our understanding of human communities. When we evaluate it in respect of public health especially, we can see that poor diet and low weight bring about such adverse outcomes as infectious diseases as well as developmental disorders and many other health problems for ancient Anatolian populations (Özer et al., 39). Living conditions that have changed a great deal after the industrial revolution and new poor production and preparation techniques have today altered our sense of diet completely, too. In this context, poor nutrition or low weight have no more become a problem for developed or developing countries at population level but in contrast high weight and obesity have turned to be an epidemic (Kiple 2007). According to the WHO data, around 1 billion people are overweight in the world today and estimates show that by 2015 this figure will reach 1.5 billion (WHO 2011). Each year around 2.6 million people lose their lives as a result of problems caused by overweight or obesity. Contrary to common belief, obesity is not only associated with countries with high income levels but also it has become a threat to lower
and medium size economies. In the world child population (around 42 million) of less than 5 years of age are overweight and at their adulthood they are expected to suffer from many disorders linked to overweight and obesity
Overweight and obesity are the result of consumption of high calorie food and the failure to spend out what has been eaten through any physical activities of equal level (Applegate 2011). This imbalance of energy can be detected through the body’s protein and fat reserves. In this study the existing state has been assessed for Turkish adults and the results have indicated that poor diet and low weight are at quite low levels, nevertheless that overweight rates are about 36% for females and 48% for males, and obesity at the level of 22% and 9%, respectively.
The nationwide TEKHARF study in which obesity prevalence and coronary risk factors were surveyed was carried out in 1990 and 2000 (Şansoy and Onat 2007). According to the results of the study of 1990, obesity rate was found to be 13% in males and 32% in females. The results obtained in year 2000 showed that these rates recorded a rise by 25% and 44% respectively. What is worthy of notice at this point here is that in the TEKHARF study, adult individuals of 30 years of age and over were included. The results of our study indicated no significant change in protein reserves depending on age, whereas a significant increase was observed in respect of fat reserves. If it is to be evaluated from this point, the age criteria in the study should be handled carefully. Another large scale nationwide survey was made on obesity prevalence as focusing on diabetes (Satman et al. 1999). Data compiled of the people of 20 years of age and over from different regions, showed that obesity has a rate of 14% in males and 25% in females. According to the 2005 Nationwide Turkish Anthropometric Survey results, obesity prevalence was found to be 20% in males and 34% in females (Gültekin et al. 207). Rates of overweight population were 38% in males and 30% in females. The difference between the obesity prevalence of the former study and results of the present study stems from the differing distribution of the samples’ age group, socio-economic level and rural-urban distribution.
Analysis of muscle and fat areas of the body supplies provides important information about the overall fat, local muscle and fat masses. As mentioned before, muscle area indicators are the best predictor of protein reserve and probable protein energy malnutrition (Lukaski, 109). And as the fat area shows the amount of subcutaneous adipose tissue, it provides data about the amount and speeds of change of the body energy depots (Frisancho 1990). The high sexual dimorphism that observed in the present results is
apparent both in AMA and AFA. Relying on this, we can conclude that males possess muscle masses in significantly differing amounts whereas females have quite a lot of fat masses, taking into consideration the high AMA rates in males. When the results of the study are compared to the values of the USA, it is clear that the males’ 50th percentile AMA values are fairly low in terms of the overall age groups (Frisancho 1990). Based on AFA, our 50th percentile values have been recorded to be lower with little difference but higher in the age group of 55-59. The same trend exists in females, as well.
Today, in many countries including Turkey, certain programs are put into action as regards obesity as well as overweight controls during childhood and adulthood periods. The Ministry of Health has started to make concrete efforts to this end within the framework of the Obesity Control Program and National Action Plan. Individually what has to be done to prevent obesity seems to be quite simple but it carries importance for the protection of health in general. Those points which are concerned with diet are listed as follows; healthy weight control, balancing the total fat intake, shift from saturated fats to unsaturated fats, raising intake of fruit, vegetables, full grain and nuts, limiting sugar and salt. In addition to diet, the physical activity level should be integrated with the individual’s life according to the individual requirements. A 30-minute daily physical activity to be done regularly at medium scale will no doubt reduce the risks of diseases like cardiovascular diseases, diabetes, colon cancer, and reduce the risks of diseases such as breast cancer, and raise the person’s mobility quality by reducing the incidents of falling with age due to the strengthening of muscles and balance. In addition, the prevalence of high risk that have found in the present study for both sexes should be handled with care, and should be followed with comprehensive anthropometric studies.
REFERENCES
Applegate, Liz. Beslenme ve diyet temel ilkeleri. Çev. H. ÖZPINAR. Kendall/Hunt: Iowa, 2011.
Cole, T.J., Freeman, J.V., Preece, M.A. British 1990 growth reference centiles for weight, height, body mass index and head circumference fitted by maximum penalize likelihood. Statistics in Medicine, 17 (1998): 407 – 429.
Cole, T.J., Green, P.J. Smoothing reference centile curves: the LMS method and penalized likelihood. Statistics in Medicine, 11 (1992): 1305-1319.
Frisancho, A. Roberto. “New norms of upper limb fat and muscle areas for assessment of nutritional status”. American Journal of Clinical Nutrition. 34 (1981): 2540-2545.
Frisancho, A. Roberto. Anthropometric standards for the assessment of growth and
nutritional status. Ann Arbour: University of Michigan Press, 1990.
Güleç, Erksin. Anadolu insanının antropometrik boyutları. Ankara Üniversitesi Bilimsel Araştırma Projeleri Kesin Raporu (20030901018), Ankara, 2006. Gültekin, Timur, ve ark. “Age related patterns of upper arm muscle and fat area in
Turkish children and assessment of nutritional status.” International Journal of
Anthropology 21(2006): 231-239.
Gültekin, Timur, ve ark. “Prevalence of overweight and obesity in Turkish adults”.
Antropologischer Anzeiger. 67. 2 (2009): 205-212.
International Obesity Task Force (IOTF). International Obesity Task Force
Statement, London, 2003.
Kıple, Kenneth F. Gezgin şölen gıda küreselleşmesinin on bin yılı. Çev. N. ELHÜSEYNİ. Cambridge: Cambridge University, 2007.
Lukaskı, Henry C. Estimation of muscle mass. (Eds. AF. Roche, SB. Heymsfield, TG. Lohman) Human body composition. Human Kinetics, Champaign, 1996. Lobsteın, Rigby, ve R. Leach. EU platform on diet, physical activity and health. EU
Platform Briefing Paper. International Obesity Task Force, Brüksel, 2005. Özer, İsmail, ve ark. Nutrition and food consumption in Anatolia, Nutrition Factors
in Past and Present Populations. Biennial Books of EAA Vol 6, (Eds. EB.
Bodzsar and C. Susanne), Budapest, Platin Publ. and Press, 2010.
Pekcan, Gülden. Beslenme durumunun saptanması. Sağlık Bakanlığı Yayın No: 726, Ankara, 2008.
Satman, İlhan. ve ark. Obesity Prevalance in Turkey, Turkish Congress on
Endocrinology and Metabolism, Antalya, 1999.
Şansoy, Vedat. Obesity, abdominal obesity and their relation with other risk factors
Weiner, Jes, ve JA Lourie. Human Biology: A Guide to Field Methods. IBP Handbook, No: 9, Oxford, Blackwell, 1969.
World Health Organızatıon (WHO). Obesity: preventing and managing the global
epidemic. WHO Technical Report Series 894 Geneva, 2000.
World Health Organızatıon (WHO). Obesity and overweight. WHO Fact Sheet Number 311, Geneva, 2011.