Sayı 18, S. 454-464, Mart-Nisan 2020
© Telif hakkı EJOSAT’a aittir
Araştırma Makalesi
www.ejosat.com ISSN:2148-2683No.18, pp. 454-464,March- April 2020
Copyright © 2020 EJOSAT
Research Article
Numerical Modelling of Full-Scale Lateral Load Test
Gizem Mısır
1*, Mustafa Laman
21 Karamanoğlu Mehmetbey Üniversitesi, Mühendislik Fakültesi, İnşaat Mühendisliği Bölümü, Karaman, Türkiye (ORCID: 0000-0002-2649-0381) 2 Çamlıca Ulusoy Plaza No:25, Üsküdar/İstanbul, Türkiye (ORCID: 0000-0003-2914-7738)
(İlk Geliş Tarihi 26 Ocak 2020 ve Kabul Tarihi 5 Mart 2020) (DOI:10.31590/ejosat.695194)
ATIF/REFERENCE: Mısır, G. & Laman, M. (2020). Numerical Modelling of Full-Scale Lateral Load Test. Avrupa Bilim ve
Teknoloji Dergisi, (18), 454-464.
Abstract
Ports are very important structures at the national and international sea transportation. These structures are also in a critical position on economy and commerce capacity by providing shipping and distribution services. It is very important to design a port structure, considering its stability and resistance along its service time. In the design of this type of structure, the lateral loads caused by during ship berthing, wind and wave loads etc. can be more important compared with vertical loads. The design and the performance of a port structure foundation should be investigated by full scale field tests considering the service loads. The aim of this study is to investigate the performance of the steel pipe pile under lateral load by full scale in-situ loading tests at Mersin International Port Construction area in the Mediterranean Sea. Full scale pile lateral loading test (PLLT) on a single offshore pile has been conducted at the project site and the test pile has been loaded up to 2 times the service load with 4 loading-unloading cycles. In addition, a numerical analysis has been performed to simulate the real lateral load-deflection behavior by using Plaxis 3D finite element software. It has been observed that, the analysis results obtained from the numerical model has been reflected the test pile lateral load-displacement behavior with good convergence.
Keywords: Full Scale Test; Laterally Loaded Pile, Plaxis 3D, Port Construction
Tam Ölçekli Yanal Yükleme Testinin Sayısal Modellemesi
Öz
Limanlar, ulusal ve uluslararası deniz taşımacılığında çok önemli yapılardır. Aynı zamanda bu yapılar, nakliye ve dağıtım hizmetleri sağlayarak, ülke ekonomisi ve ticaret kapasitesi üzerinde de kritik bir konumdadır. Liman yapısı tasarımında, yapının hizmet ömrü boyunca stabilitesini ve dayanımını mufaza etmesi oldukça önemlidir. Bu tip yapıların tasarımında, rüzgâr ve dalga yükleri ile gemi yanaşması ve bağlanması sırasında ortaya çıkan etkilerin neden olduğu yanal yükler, dikey yüklere kıyasla çok daha önemli olabilmektedir. Liman yapısı temel sisteminin tasarımı ve performansı, hizmet yükleri dikkate alınarak tam ölçekli saha testleri ile araştırılmalıdır. Bu çalışmanın amacıda, Akdeniz'de Mersin Uluslararası Liman İnşaatı bölgesinde tam ölçekli saha yükleme testleri ile çelik boru kazıklarının yanal yük altındaki performansının incelenmesidir. Tekil bir test kazığı, tam ölçekli yanal yükleme düzeneği ile 4 yükleme-boşaltma çevrimi altında, proje yükünün 2 katına kadar yüklenmiştir. Ayrıca gerçek yanal yük-deplasman davranışını simüle etmek için Plaxis 3D sonlu elemanlar yazılımı kullanılmıştır. Sayısal modelden elde edilen analiz sonuçlarının, yükleme testinden elde edilen kazık yanal yük-deplasman davranışını başarılı bir şekilde yansıttığı gözlemlenmiştir.
Anahtar Kelimeler: Tam Ölçekli Deney, Yanal Yüklü Kazık, Plaxis 3D, Liman İnşaatı
0000-1. Introduction
Construction of marine structures can be classified into two groups as shore protection and offshore applications. The breakwaters, docks, wharfs and quay walls are usually designed as coastal port protection structures while submarine pipe lines, marine discharge systems, petroleum platforms can be classified as offshore structures. These structures should fulfill their functions under wind, tidal currents, earthquake and wave loads that are acting along with their service life. The forces consisted of waves are the most important impact to consider among the external loads affecting marine structures, because they apply the greatest lateral loads to the foundations of marine structures.
The foundation system of offshore and port structures is generally designed as a pile foundation. Piles are used extensively for supporting axial and lateral loads for a variety of structures including heavy buildings, transmission lines, power stations, and highway structures. In recent years, design procedures have begun to develop for foundations of port structures, with the development of considerable knowledge of laterally loaded piles.
The behavior of the pile foundations under lateral loads is a nonlinear 3 dimensional geotechnical problem. The analytical solution to this problem is quite complex and that requires an enormous computational effort. Although several methods (such as Brinch Hansen (1961); Broms (1964); Reese et al. (1974); Poulos and Davis (1980)) have been published for predicting the ultimate lateral resistance of piles, the obtained ultimate lateral resistances are significantly different from each other. This difference makes it difficult for engineers to select the appropriate method effectively, when designing laterally loaded piles. Therefore, a full scale loading test if possible, can be the most realistic solution to evaluate the behavior of the pile. Considering the success of the results in the literature, a great number of numerical studies have been widely preferred by design engineers to investigate the behavior of laterally loaded piles besides the analytical and experimental methods. Numerical modeling of the piles using realistic parameters compatible with the test site, facilitates to forecast the optimal pile length and diameter. At the same time, simulations may also allow evaluating the performance of the pile at different parts of the construction site with a variety of soil conditions by reducing the cost of time and money of pile construction and testing equipment.
In full scale in-situ experiments, the results are considered very reliable, due to the real stress and deformation conditions and soil-structure interaction. But, generally it may be impossible to establish a full scale field test because of the higher cost of system and instrumentation, the necessity of expert staff and time consuming process. Because of these limitations, a limited number of studies that are available about the pile loading in-situ test in the literature. The majority of these studies are about laterally loaded pile raft foundation systems (Brown et al. (1988), Ruesta and Townsend (1997), Rollins et al. (2005)).
In this study, the full-scale pile loading test procedure and test results have been presented. Then, 3 dimensional finite element model has been generated according to the site investigation report and test procedure, by using Plaxis 3D software. According to the comparison between the simulation and in-situ test results, the generated 3 dimensional numerical models have been reflected the real behavior, with a great approximation.
2. A Full Scale Field Test
2.1. General Information About the Test Site Soil
The full scale in-situ loading tests have been conducted for a test pile at Mersin International Port Construction in the Mediterranean Sea. The test site has been investigated by 9 boreholes (409 m) at different locations of the port region. The depth has been selected as 50 m for the six of the boreholes named as GSK-1 to GSK-6, respectively. The depth has been implemented as 35 m at the rest of the three boreholes which is from GSK-7 to GSK-9. The borehole (GSK) locations are given in the borehole layout plan (Figure 1). Boreholes were drilled by “Shell &Auger” and “Marine Rotary” methods.
The diameter of the test pile was 1016 mm. And the soil profile that has been used in the numerical modelling has been idealized basically, according to the borehole 4 (GSK-4) which is the closest position for the test pile.
Figure 1. Borehole Layout Plane
According to the soil profile obtained from boreholes, the depth of the sea water varies between 10.0-10.8 m (Table 1). Underneath the sea water, a sediment layer formed in the form of convection has been classified as soft dark grey clay with a thickness ranging from 0.20 to 1.50 m. Two different groups of cross-sections next to the test site that has been obtained from GSK 7-9-4-3 and GSK-2-3-4-5 boreholes are presented together (Figure 2 and 3).
Figure 3. Diagrammatic Cross-Sections of Boreholes GSK-2, GSK-3, GSK-4 and GSK-5
As seen from the soil profile, clay and gravel (sand occasionally) soils have been generally observed, after about 10m sea water up to 50m drilling depth. In general, underneath the sea water, the first soil layer was clay and after that gravel layer has been observed in all boreholes. The layer of gravel (occasionally sand) has started generally at about 25m depth from the level of the sea water and it continuous up to 50 m borehole depth. Standard Penetration Tests (SPT) have been performed according to Turkish Standard (TS)-5744 in boreholes in order to define the consistency of soil layers. The variation of SPT values with depth for all boreholes has shown in a graph in Figure 4.
Figure 4. Variation of SPT (N) Values with Depth
According to the SPT values taken along the borehole depth of 40 m from the sea floor, it was observed that the SPT (N) values had shown a significant variation from 20 to 50 in the first 20-25 m depth. After this depth, the SPT values have been generally obtained higher from 50 and have been recorded as 50+.
As seen from the soil profile and SPT test results, a depth after about 25-30m from the sea level is good enough to use as a foundation soil. Laboratory tests were also performed on the samples obtained from the boreholes in order to determine the soil properties in accordance with Turkish Standards (TS-1900 1-2). Based on the test results, the clay layer was classified as high plasticity clay (CH). The underlying sandy gravelly deposits are classified as SC and GC. Triaxial compression (3 CU and 2 CD) tests were performed and the values of effective shear strength parameters were obtained, =5.0–23.0 and c=0.24-0.46 kg/cm2 (Table 1, 2
and 3).
Table 1. Summary of Soil Classification Tests
Sample ID Sample
Depth (m)
Grain Size Distribution (%) Atterberg Limits (%)
Gravel Sand Silt Clay Liquid Limit Plastic Limit
GSK-2 U2 20.30-20.80 2.4 3.4 11.4 82.8 80 29
GSK-3 U1 15.80-16.30 0.3 3.4 3.8 92.5 110 44
GSK-6 U1 18.80-19.30 0 6.3 8.4 85.3 92 35
GSK-7 U1 17.30-17.80 0 3.6 10.0 86.4 126 48
GSK-/ U1 15.80-16.30 0 1.6 12.2 86.2 93 39
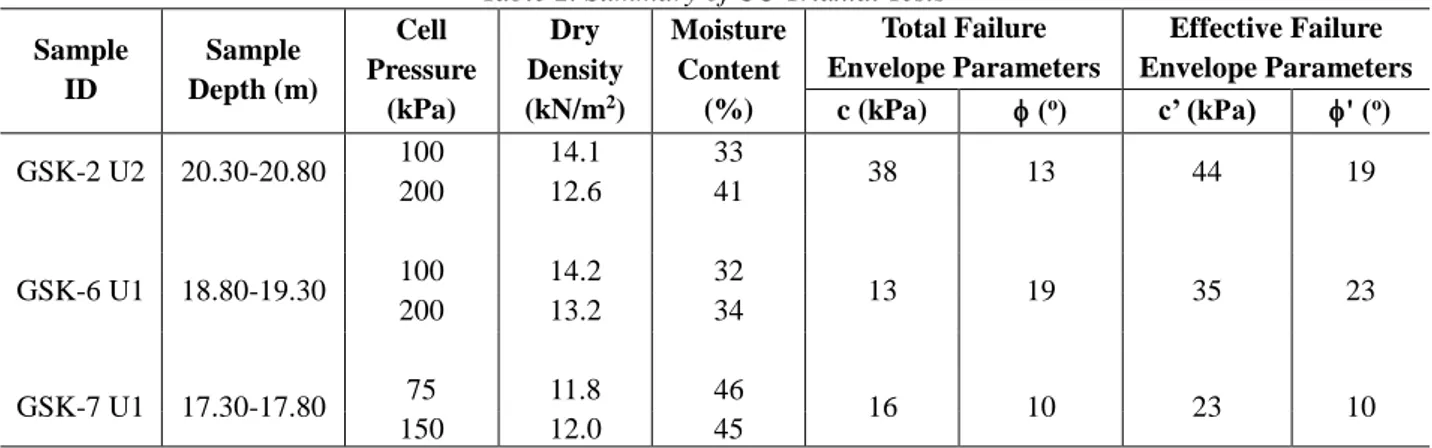
Table 2. Summary of CU Triaxial Tests
Sample ID Sample Depth (m) Cell Pressure (kPa) Dry Density (kN/m2) Moisture Content (%) Total Failure Envelope Parameters Effective Failure Envelope Parameters c (kPa) (o) c’ (kPa) ' (o) GSK-2 U2 20.30-20.80 100 14.1 33 38 13 44 19 200 12.6 41 GSK-6 U1 18.80-19.30 100 14.2 32 13 19 35 23 200 13.2 34 GSK-7 U1 17.30-17.80 75 11.8 46 16 10 23 10 150 12.0 45
Table 3. Summary of CD Triaxial Tests
Sample ID Sample Depth (m) Cell Pressure (kPa) Dry Density (kN/m2) Moisture Content (%) Effective Failure Envelope Parameters c’ (kPa) ' (o) GSK-3 U1 15.80-16.30 50 12.2 44 24 10 100 12.4 43 200 12.7 41 GSK-8 U1 15.80-16.30 70 12.6 41 46 5 140 12.7 41
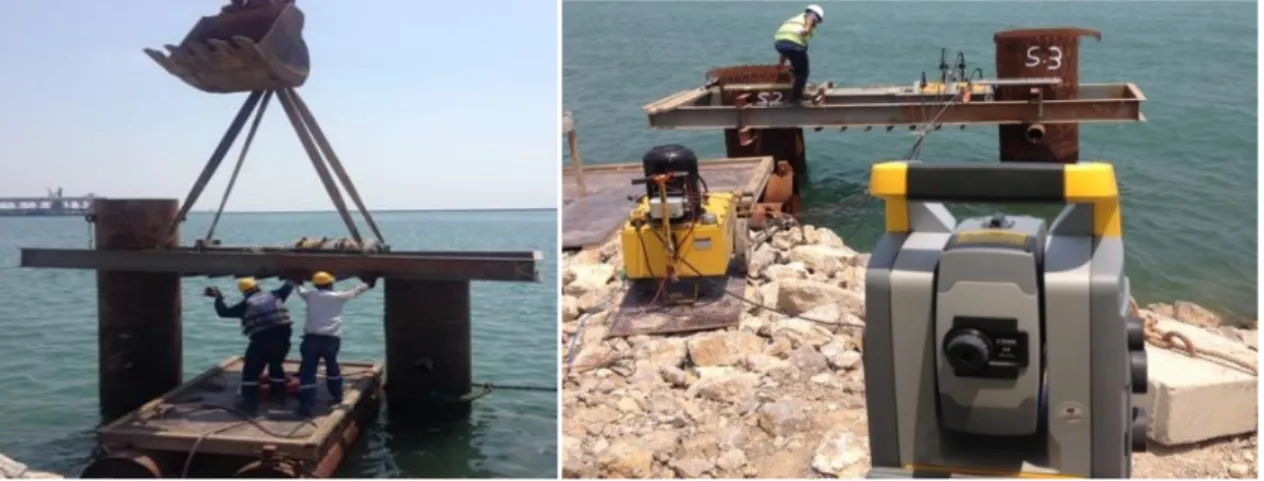
2.2. Testing Equipment
Two steel pipe piles have been implemented at the site to find out the performance of the test pile under lateral load. One of the piles has been used as a test pile while the other one has been used as a reaction pile. The steel pipe piles have been drifted from the coast to the test area by floating on the sea, brought to the upright position at the desired coordinates and lowered to the sea bottom with the help of a crane. Driven piles, were socketed to the sea bottom by pile driving equipment. Both the test and reaction piles were driven by SEMW D-100 diesel-type hammer. The maximum energy that can be produced by using SEMW D-100 type of diesel hammer was 333.540 Nm. Pile driving equipment was consist of a hammer, a tugboat and a floating pile driver with a steel tower.
The distance between the reaction and the test piles was far away to satisfy the 3D distance condition. The setup of the in-situ static loading test has been given in Figure 5.
a. Implementation of the Reference Beam b. Topographical Survey Equipment Figure 5. Setup of the Field Test
A steel frame has been manufactured to use as a reference beam. Measurement instruments such as displacement transducers and load cells have been mounted on this beam and the pile displacements and lateral load values have been measured in this way (Figure 6).
Figure 6. Test Equipment
2.3. Test Procedure of Lateral Load Test
The test has been done on test piles named number 1 and number 2 which have been driven up to the Project elevation in the back yard area of new container berth to be constructed.
Lateral load test has been carried out on the pipe piles that have no concrete inside by applying repellent forces with a hydraulic jack of nominal sufficient capacity which has been horizontally placed at support and frame beam fastened in the horizontal position. As seen in Figure 7, a hydraulic jack has been mounted on the steel frame that has been placed around the two piles [Ø40'' and Ø48''] to enable the exertion of load in the test as per specification.
Piles have been pushed away from each other by being subjected to the lateral loadings according to the test programs given in the technical specification. The percentage of test loadings and the recording of the readings have been taken according to ASTM 3966. The lateral loading procedure has been applied as a loading / unloading cycle. Loading and unloading procedures have been done gradually with specified increments of service load. In the first cycle 50 % (11.25 t) of the service load has been applied. After then, the 100 % (22.5 t), 150 % (33.75 t) and finally the 200 % (45 t) of the service load have been applied as second, third and fourth cycles, respectively (Figure 8). After each increament of lateral load, the load-settlement velocity has been maintained until dropping below 0.25 mm/hr.
Figure 8. Lateral Load-Displacement Curve
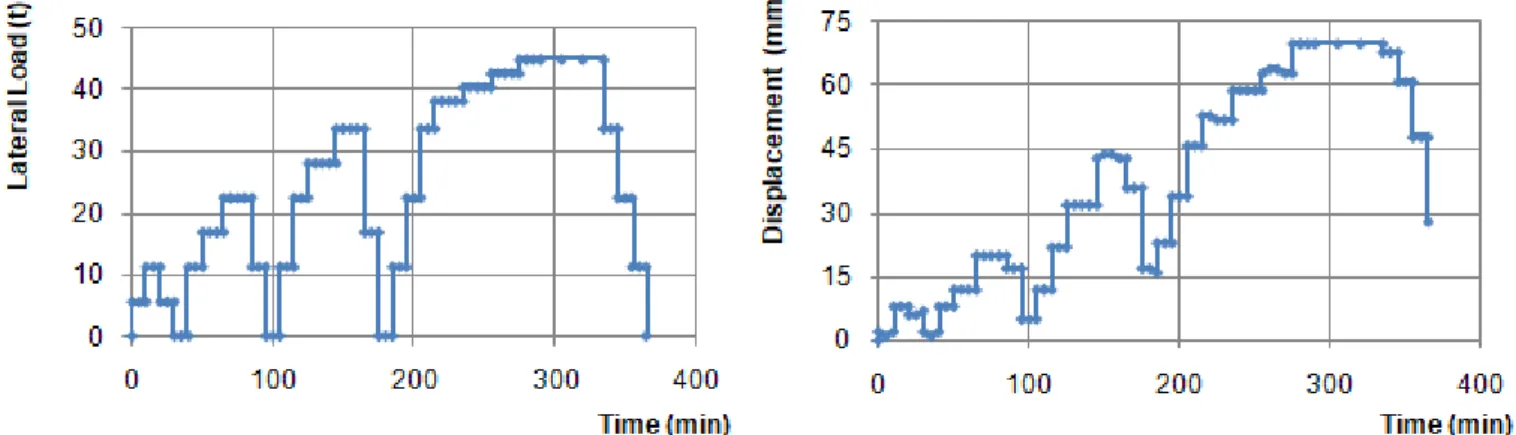
Within any time period in which the load is fixed, measurements of time and displacements were immediately started after the load has been attained. Recorded additional readings have been taken for each loading / unloading cycle totally during 40, 65, 80 and 180 minutes with 5 minutes intervals for the first, second, third and fourth cycles, respectively (Figure 9). Horizontal displacements have been recorded at load and time intervals which were specified in the loading & unloading program. Final readings at the end of 6 hours that corresponds to the condition of unloading the whole load, have been recorded.
Figure 9. Variation of Lateral Load and Displacement According to Time
Magnitudes of applied horizontal forces have been determined by measuring the effective pressure on the piston surface via a manometer and multiplying it with the piston area. The capacity of the manometer was 0-600 kg/cm2. Paper reflectors have been used
3. Finite Element Modelling
The numerical modeling of the lateral load test of the pile has been carried out by using Plaxis software (Plaxis 3D (2013)). Plaxis is a software depends on the finite element method which can be used for the analysis of deformation and stress distribution of the soil and soil-structure interaction problems. Geotechnical applications require constitutive models, for the realistic simulation of the non-linear and time dependent behavior of soils. Plaxis has the required features to deal with numerous problems encountered in most geotechnical structures. Analyses of axially loaded piles using the finite element method have been studied by many researchers (Lozovyi and Zahoruiko (2012), Said et al. (2009), Gowthaman and Nasi (2017), Yi (2004). However; analyses of the laterally loaded piles using finite element method are much less than axially loaded ones in the literature (Uncuoglu and Laman (2012), Misir and Laman (2019) and etc.).
PLAXIS 3D is a popular three-dimensional finite element program, which is used to perform deformation analyses for various types of foundations in soil and rock. The program allows for a fully automatic generation of three dimensional finite element meshes, which enables users to generate a true three-dimensional finite element mesh based on a composition of horizontal cross-sections at different vertical levels. The geometric model is a composition of boreholes. The boreholes are used to define the local soil profile, ground surface level and pore pressure distribution.
This well known program allows the users to identicate the soil and the structural element behaviors in a realistic manner and to evaluate the effect of different loading conditions. Laterally loaded steel pipe pile test was modeled using the parameters given in Table 4. Also, different types of soil material models can be used in Plaxis to define the actual soil behavior. Due to its simplicity, Mohr Coulomb (MC) material model is highly popular and has been commonly preferred by most of the researchers. The MC model involves five parameters, i.e. Young’s Modulus; E, Poisson’s Ratio; ν, Cohesion; c, Internal Friction Angle; ø, and Dilatancy Angle; ψ. In the numerical analysis the sea base soil parameters given in Table 5, have been taken from GSK 4 borehole data since it is very close to the in-situ test location.
Table 4. Test Pile Parameters for Numerical Analyses
Parameters Pile
Material Type Beam
(kN/m3) 77
E(kPa) 3*106
A (m2) 0.0320
I2-I3 (m4) 0.0523
Table 5. Mohr Coulomb Soil Parameters for Numerical Analyses
Parameters Fill 0-10.55m Sand 10.55-14.75m Clay 1 14.75-25.8m Gravel 25.8-31.8m Clay 2 31.8-40.8m unst (kN/m3) 18.0 18.3 18.0 19.0 18.0 sat (kN/m3) 19.0 21.0 18.0 20.0 18.0 E (kPa) 75.000 25.000 7692 100.000 7692 0.25 0.2 0.4 0.25 0.4 c (kPa) 1.0 1.0 69.0 1.0 100.0 35.0 33.0 6.0 37.5 7.0 5.0 3.0 0.0 7.5 0.0
The boundary dimensions for finite element analyses have been determined by conducting several analyses on different mesh sizes to select the dimension of the mesh in which the stress zone is not affected by the boundary conditions. Sensitivity analyses have been also conducted to find out suitable mesh refinement and to minimize mesh-dependent effects.
As a result of preliminary analysis; finite element mesh distribution has been adopted, which has 25 m x 25 m x 70 m dimensions and includes about 9968 elements. The three dimensional model has been analyzed by 26 stage construction phases. Finally, the test pile was loaded laterally, with four loading-unloading cycles as %50, %100, %150 and %200 of the design load as in the field experiment procedure.
4. Comparison of The Experimental and Numerical Results
In this part of the study, the lateral load versus lateral displacement curves which have been obtained from the results of the in-situ full scale experiment and three dimensional numerical analysis have been presented together in the same graph. Comparisons have been made for 4 different loading and unloading cycles and presented in Figure 10.
Figure 10. Comparison of the Test and Plaxis 3D Results
According to Figure 10, the lateral load-displacement curves are more compatible at the peak lateral load values in the loading trend. However at the unloading cycles, especially in case the lateral load is completely removed, the permanent deformations obtained from three dimensional finite element analysis were higher than the experimental results. Therefore, it can be concluded that, the actual soil behavior has shown more elastic behavior comparing with the MC material model. The success of the comparison of the numerical and in-situ test results has been evaluated with the coefficients of determination separately for each pile loading and unloading cycles and has shown in Table 6.
Table 6. Coefficient of Determination for Each Loading-Unloading Cycles
Coefficient of Determination Loading Unloading 1. Cycle 0.943 0.984 2. Cycle 0.971 0.960 3. Cycle 0.969 0.997 4. Cycle 0.968 0.993
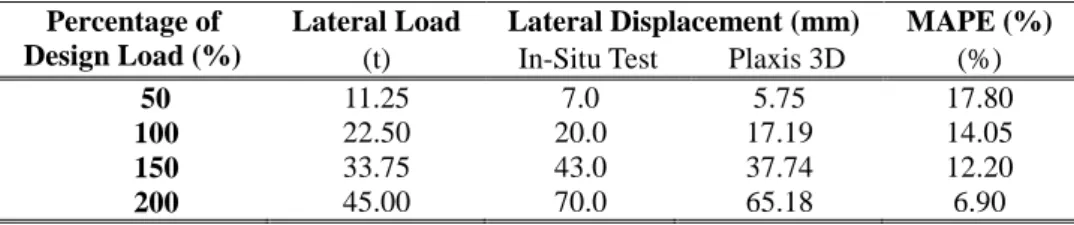
The average correlation coefficient of 0.96 that obtained from the simulation has shown acceptable high reliability. Besides the coefficients of determination, the comparisons have been made according to the lateral displacements obtained from the in-situ test and the numerical model, corresponding to the value of the peak lateral load for each cycle too. As shown in Table 7, the numerical studies have given more conservative results according to the experimental results under the peak lateral loads for each cycle. The lateral displacements and the mean absolute percentage error values (MAPE) are also shown in Table 7.
Table 7. Coefficient of Determination for Each Loading-Unloading Cycles
Percentage of Design Load (%)
Lateral Load Lateral Displacement (mm) MAPE (%)
(t) In-Situ Test Plaxis 3D (%)
50 11.25 7.0 5.75 17.80
100 22.50 20.0 17.19 14.05
150 33.75 43.0 37.74 12.20
n
A
F
A
MAPE
n i i i i
1*
100
(1)where Ai is the actual value and Fi is the forecast value.
According to the numerical model at the peak loading stages, MAPE values vary in the range of 6.9-17.8% with an average error value of approximately 12%. It can be concluded from the reduction of the error rate that, as the lateral load value increases, the interaction between the pile and the surround soil also increases and the system has mobilized.
5. Conclusions
In this study, the laterally loaded pile behavior obtained from a full scale field experiment in a port structure was compared with Plaxis 3D simulation result. The following conclusions can be drawn from the interpretation of test and numerical analyses presented in this study:
• Full scale lateral load test (PLLT) results of steel test pile which was embedded in a sea base were modeled with 3 dimensional Plaxis program with acceptable accuracy.
• The displacements obtained from PLAXIS 3D analysis have given more conservative results compared with the field pile lateral loading test results. When the peak loads of all the loading cycles were considered, the average lateral displacement difference was obtained as 12%.
• According to the lateral load-displacement graph, it can be concluded that, the real soil behavior has shown more elastic behaviour comparing with the Mohr-Coulomb soil model in terms of permanent deformation.
• It can be suggested that, using software, like PLAXIS 3D, with a right soil model and reliable soil parameters can allow reducing the cost and the time for additional field tests. Additionally, the design of the pile configuration can be foreseen by using load-displacement data obtained from the simulation model.
• Simulation studies that correctly modelled make possible to produce parametric investigations for different soil, pile and loading conditions.
Acknowledgements
Mersin Port Development Construction of New Container Berth and Civil Infrastructure Project presented in this paper was carried out with the support of Bektaşoglu Kulak Construction. We gratefully thank the site manager Mehmet Fatih YALDIZ and construction manager Şenol KARAKAYALI for their contributions.
References
ASTM D 3966-07. (2007). Standard test methods for deep foundations under lateral load.ASTM Committee D18 on Soil and Rock and
are the direct responsibility of Subcommittee D18.11 on Deep Foundations 2007.
Brinch-Hansen, J. (1961). The ultimate resistance of rigid piles against transversal forces.Geoteknisk Institute (The Danish
Geotechnical Institute), 12, 5-9.
Broms, B.B. (1964).Lateral resistance of piles in cohesionless soils.Journal of the Soil Mechanics and Foundations Division, 90 (3), 123-156.
Brown D. A., Morrison C. and Reese L. C. (1988). Lateral Load Behavior of Pile Group in Sand. Journal of Geotechnical Engineering. Vol. 114, Issue 11.
Das, B. M. (2007). Principles of foundation engineering, adapted ınternational student edition.Thomson Canada Limited.
Uncuoglu E. and Laman, M. (2012). Numerical modelling of short pile behavior subjected to lateral load. European Journal of
Environmental and Civil Engineering. Volume 16, 2012 - Issue 2. Pages 204-235.
Gowthaman S. and Nasvi M.C.M. (2017). 2D and 3D numerical simulation of load-settlement behaviour of axially loaded pile foundations.American Journal of Civil Engineering and Architecture, Vol. 5, No. 5, 187-195. DOI:10.12691/ajcea-5-5-2
Lozovyi S. and Zahoruiko E. (2012). Plaxis simulation of static pile tests and determination of reaction piles ınfluence.Scientific and
Technical Journal: New Technologies in Construction, 23-24(1-2):68-73.
Misir G. and Laman M. (2019). Numerical Analysis of Laterally Loaded Battered Rigid Piles. Technical journal of Turkish Chamber
of Civil Engineers. 30 (5). pages 9507-9531
Plaxis 3D. (2013).Reference Manual. Delft University of Technology & Plaxis b.v. The Netherlands. Poulos, H. G. and Davis, E. H. (1980). Pile foundation analysis and design.Wiley, New York.
Reese, L. C., Cox, W. R. and Koop, F. D. (1974). Analysis of laterally loaded piles in sand. Paper No, OTC 2080, Proceedings, Fifth
Annual Offshore Technology Conference, Houston, Texas.
Geoenvironmental Engineering. Vol. 123, Issue 12.
Said I., Gennaro, V. De and Frank, R. (2009). Axisymmetric finite element analysis of pile loading tests.Computers and Geotechnics, 36, 6–19.
TS 1900-1. 2006. Methods of Testing Soils for Civil Engineering Purposes in the Laboratory: Part 1: Determination of physical properties. Turkish Standard.
TS 1900-2. 2006. Methods of Testing Soils for Civil Engineering Purposes in the Laboratory: Part 2: Determination of mechanical properties. Turkish Standard.
TS 5744. 2013. Determination of bearing capacity of soils in-situ by plate loading test. Turkish Standard. Yi, L. (2004). Finite element study on static pile load testing.MSc. Thesis, University of Singapore.