EVALUATION OF RELATIONSHIP BETWEEN LARGE
-SCALE
ATMOSPHERIC CIRCULATION PATTERNS WITH PRECIPITATION
OVER NORTHWESTERN IRAN IN THE NORTHERN HEMISPHERE
Emamali AsheriAssistant Professor, Department of geography, Payame Noor University, Tehran, IRAN
ABSTRACT
The impact of teleconnections upon the surface climate has largely been examined via a response in monthly mean temperature or total precipitation. In this paper, for the purpose of determining relationships between teleconnection indices and precipitation, the relationship between 13 patterns of teleconnection and Monthly precipitation for 24 stations in Northwestern Iran were during the period 1992-2011, analyzed and calculated.Finally, the spatial distribution of the correlation between this indices and stations of study area was drawn and its zoning was prepared by use of Kriging method, in GIS software. the results indicate that MEI, NAO, AO and SOI are respectively significant patterns among all those and most significant relationship is related to correlation between NAO index and precipitation of jolfa station with correlation coefficients close to 0.735.
Keywords: Teleconnection, precipitation, correlation, Kriging, Northwestern Iran INTRODUCTION
The subject of atmospheric teleconnection patterns has stimulated much research over the past 70 years. This era of teleconnection pattern research began with the extensive and thorough analysis of Walker and Bliss (1932) (Feldstein, 2002). Teleconnections are statistical associations among climatic variables separated by large distances. They are a consequence of the large-scale dynamics of the ocean and atmosphere linking disparate regional climates into one unified, global climatic system. The spatial and temporal aspects of teleconnections can be interpreted in terms of the large-scale dynamical structure of the atmosphere (Leathers and et al,1991).In other words, The word “teleconnection” has been commonly used to describe relationships in the low-frequency variability of the tropical and extra tropical atmospheric circulations, precipitation, and temperatures (Trenberth and et al. 1998). These patterns have implications for future change, as long-term shifts in the frequency and/or intensity of natural cycles could alter the range of surface climate conditions experienced in many locations around the world (Anne Marie and et al. 2009).
The impact of teleconnections upon the surface climate has largely been examined via a response in monthly mean temperature or total precipitation (Sheridan, 2002). Due to the efficiency of teleconnections studies on understanding of climatic parameters like temperature and precipitation, Often attempts to understand the influence teleconnection patterns on these parameters. Berlage (1966) found evidence of significant correlations between indices of the Southern Oscillation and precipitation at several individual stations around the globe. Hurrell (1996) went on to demonstratteh at the upward rend in the NAO during the past 30 years accounts for much of the warming in SAT averaged over the domain pole ward of 200 N.
Rasmusson and Wallace (1983) showed relationships between time series of rainfall at several locations and the surface pressure at Tahiti and Darwin. Bacon and carter (1993) established a positive Correlation between two in-situ sea wave height time series of the northern Atlantic and the North Atlantic Oscillation (NAO), which is the dominant teleconnection pattern. Lau and Weng (2002) found that the East Asian–North American teleconnection pattern might be used to explain a close relationship in rainfall variability between East Asia and North America.
Cintia (2003) investigated relationships between the North Atlantic oscillation (NAO) and winter temperature and precipitation over northern Europe and found a Strong correlation between them.
Ding and Wang (2005) found a recurrent teleconnection pattern in summertime atmospheric circulation at the mid-latitudes of the Northern Hemisphere. This pattern has a zonal wavenumber-5 structure and is accompanied by the significant anomalies of rainfall and surface temperature in the continental regions of West Europe, European Russia, India, East Asia, and North America.
Karumuri and et al(2007) studied El Niño Modoki and its possible teleconnection based on observed data sets mainly for the period 1979–2005 and found that anomalous warming events different from conventional El Niño events occur in the central equatorial Pacific. This unique warming in the central equatorial Pacific associated with a horseshoe pattern is flanked by a colder sea surface temperature anomaly (SSTA) on both sides along the equator. Empirical orthogonal function (EOF) analysis of monthly tropical Pacific SSTA shows that these events are represented by the second mode that explains 12% of the variance. They suggested that the recent weakening of equatorial easterlies related to weakened zonal sea surface temperature gradient led to more flattening of the thermocline. Lopez-Bustins and et al (2008) showed the correlation between winter rainfall on the Iberian Peninsula and teleconnection indices trends and changes in the frequency of surface circulation patterns over Western Europe. They determined these circulation patterns by carrying out a daily objective synoptic classification by means of a principal components analysis (PCA) using sea-level pressure (SLP) data. Chowdary and et al (2012) investigated Slow modulation of interannual variability and its relationship to El Niño–Southern Oscillation (ENSO) for the period of 1870–2007.They resulted that The modulation is correlated not with the Pacific decadal oscillation but rather with the ENSO variance itself. When ENSO is strong, its effect in the Indo–northwest Pacific strengthens and vice versa. Yuyun and et al (2014) investigated Tree Eurasian Teleconnection Patterns and resulted that all three EU patterns are characterized by a clear quasi-barotropic wave-train structure, but each has a distinct source and centre of action. Accordingly, their impacts on the precipitation and surface air temperature also differ from one other. Using orthogonally rotated principal component analysis and the teleconnectivity method, a number of prominent teleconnection patterns have been identified in the Northern Hemisphere (NH) extratropics throughout the year (e.g., Wallace and Gutzler 1981; Mo and Livezey 1986; Barnston and Livezey 1987, DING and Wang, 2004). Relationships between surface temperature and precipitation in Iran and teleconnections indices are not so well documented. Concerning rainfall variability, many recent studies have contributed results on a regional scale. (DU¨ NKELOH & JACOBEIT, 2003).So, the purpose of this study was to investigate the relationship between 13 patterns of teleconnection and Monthly precipitation over the stations in Northwestern part of Iran.
MATERIALS AND METHODS:
In order to investigate the relationship between teleconnection patterns with precipitation in IRAN, the regression and correlation analysis method is used. Total monthly precipitation data from 24 synoptic stations during the period (2011-1992), were collected from the Meteorological Organization's website (Irimo.ir). standardized data set of teleconnection indices during the same period, was obtained by the Climate Prediction Center depend on National Oceanic and Atmospheric Administration(NOAA).in this study, data set of 13 teleconnection indices in comparison with data from 24 weather stations in Northwestern Iran, were analyzed according to Pearson correlation coefficient After standardization.
Table 1: teleconnection patterns in this study Multivariate ENSO Index (MEI) Arctic Oscillation (AO) East Atlantic Pattern (EA) Pacific North America (PNA) West Pacific Pattern ( WP) North Pacific Pattern (EP/NP) East Atlantic West Russia (EA/WR) Pacific Decadal Oscillation (PDO) North Atlantic Oscillation (NAO) Polar Eurasia Pattern (E/P) or (POL) Tropical Northern Hemisphere (TNH) Southern Oscillation Index (SOI) Scandinavia (SCA)
Many of these patterns have been introduced during the last few years and furthermore these types of studies are in the early stages of evolution at the global level.
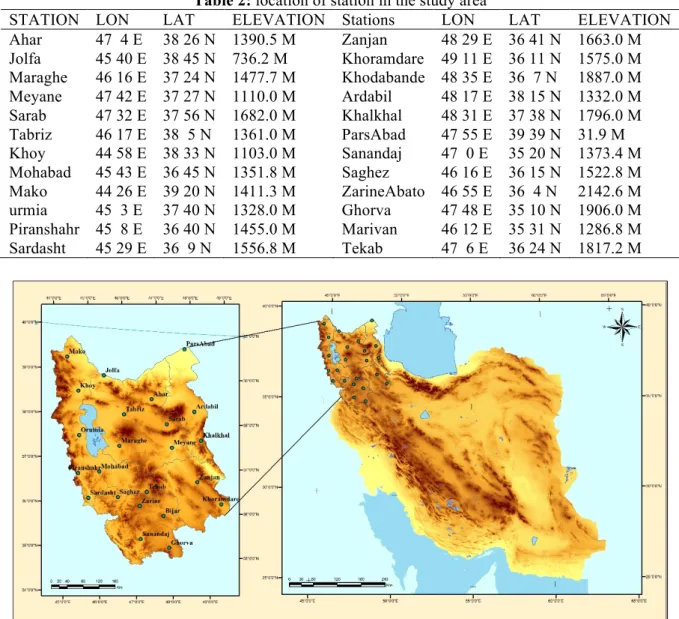
The purpose of the study was to find out the relationship between teleconnection patterns and monthly precipitation in west Azarbaijan, East Azarbaijan, Zanjan, Ardabil and Kurdistan provinces of Iran (Table 2 and Figure 1).
Table 2: location of station in the study area
STATION LON LAT ELEVATION Stations LON LAT ELEVATION
Ahar 47 4 E 38 26 N 1390.5 M Zanjan 48 29 E 36 41 N 1663.0 M Jolfa 45 40 E 38 45 N 736.2 M Khoramdare 49 11 E 36 11 N 1575.0 M Maraghe 46 16 E 37 24 N 1477.7 M Khodabande 48 35 E 36 7 N 1887.0 M Meyane 47 42 E 37 27 N 1110.0 M Ardabil 48 17 E 38 15 N 1332.0 M Sarab 47 32 E 37 56 N 1682.0 M Khalkhal 48 31 E 37 38 N 1796.0 M Tabriz 46 17 E 38 5 N 1361.0 M ParsAbad 47 55 E 39 39 N 31.9 M Khoy 44 58 E 38 33 N 1103.0 M Sanandaj 47 0 E 35 20 N 1373.4 M Mohabad 45 43 E 36 45 N 1351.8 M Saghez 46 16 E 36 15 N 1522.8 M Mako 44 26 E 39 20 N 1411.3 M ZarineAbato 46 55 E 36 4 N 2142.6 M urmia 45 3 E 37 40 N 1328.0 M Ghorva 47 48 E 35 10 N 1906.0 M Piranshahr 45 8 E 36 40 N 1455.0 M Marivan 46 12 E 35 31 N 1286.8 M Sardasht 45 29 E 36 9 N 1556.8 M Tekab 47 6 E 36 24 N 1817.2 M
Figure 1: Distribution map of stations over the Northwestern Iran
Then , after the descriptive analysis data in the statistical software (SPSS 22.0, relationship between the average monthly precipitation in stations mentioned above, with 13 teleconnection indices were analyzed),using a statistical method(Pearson correlation).finally, the most effective meaningful patterns were identified.
RESULTS AND DISCUSSION:
In this paper, the correlation between precipitation with 13 teleconnection indices were assessed and this correlation was tested for supposing that a significant relationships there are between them , the following results were obtained: MEI, NAO, AO and SOI indices, respectively with 49, 45, 39 and 33 months of a significance level are the most influential patterns regarding the statistical analysis of The correlation between precipitation of study stations with 13 teleconnection indices.
TNH, POL and WP indices, respectively with 3, 7, 8 months of a significance level are the least influential of meaningful patterns.
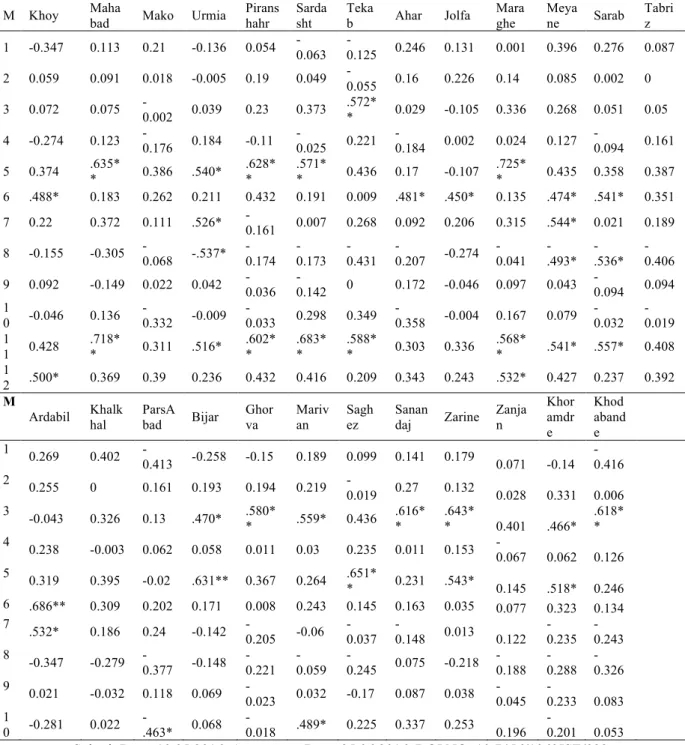
Table3 shows the correlation between precipitation of study stations with MEI teleconnection index. The results demonstrate the relationship between precipitation and MEI pattern in all the stations except Tabriz and Maku have significant correlation at the 0.05 and 0.01 percent confidence interval during 1 to 4 months of year. However, no significant relationship was found in the months of Jan, Apr, Mar and Sep.
The most significant relationship is for Marivan station in NOV with a correlation coefficient of 0.729 and the weakest relationship is for Julfa in Jun with a correlation coefficient of 0.450. As can be seen in Figure 3, significant correlation between precipitation of study stations MEI teleconnection index is positive.
Table 3: Correlation coefficient between the MEI teleconnection index and monthly precipitation over the Northwestern Iran
M Khoy Mahabad Mako Urmia Piranshahr Sardasht b Teka Ahar Jolfa Maraghe Meyane Sarab Tabriz 1 -0.347 0.113 0.21 -0.136 0.054 -0.063 -0.125 0.246 0.131 0.001 0.396 0.276 0.087 2 0.059 0.091 0.018 -0.005 0.19 0.049 -0.055 0.16 0.226 0.14 0.085 0.002 0 3 0.072 0.075 -0.002 0.039 0.23 0.373 .572** 0.029 -0.105 0.336 0.268 0.051 0.05 4 -0.274 0.123 -0.176 0.184 -0.11 -0.025 0.221 -0.184 0.002 0.024 0.127 -0.094 0.161 5 0.374 .635** 0.386 .540* .628** .571** 0.436 0.17 -0.107 .725** 0.435 0.358 0.387 6 .488* 0.183 0.262 0.211 0.432 0.191 0.009 .481* .450* 0.135 .474* .541* 0.351 7 0.22 0.372 0.111 .526* -0.161 0.007 0.268 0.092 0.206 0.315 .544* 0.021 0.189 8 -0.155 -0.305 -0.068 -.537* -0.174 -0.173 0.431 - -0.207 -0.274 -0.041 -.493* -.536* -0.406 9 0.092 -0.149 0.022 0.042 -0.036 -0.142 0 0.172 -0.046 0.097 0.043 -0.094 0.094 1 0 -0.046 0.136 -0.332 -0.009 -0.033 0.298 0.349 -0.358 -0.004 0.167 0.079 -0.032 -0.019 1 1 0.428 .718* * 0.311 .516* .602* * .683* * .588* * 0.303 0.336 .568* * .541* .557* 0.408 1 2 .500* 0.369 0.39 0.236 0.432 0.416 0.209 0.343 0.243 .532* 0.427 0.237 0.392 M
Ardabil Khalkhal ParsAbad Bijar Ghorva an Mariv Saghez Sanandaj Zarine Zanjan Khoramdr e Khod aband e 1 0.269 0.402 -0.413 -0.258 -0.15 0.189 0.099 0.141 0.179 0.071 -0.14 -0.416 2 0.255 0 0.161 0.193 0.194 0.219 -0.019 0.27 0.132 0.028 0.331 0.006 3 -0.043 0.326 0.13 .470* .580* * .559* 0.436 .616* * .643* * 0.401 .466* .618* * 4 0.238 -0.003 0.062 0.058 0.011 0.03 0.235 0.011 0.153 -0.067 0.062 0.126 5 0.319 0.395 -0.02 .631** 0.367 0.264 .651* * 0.231 .543* 0.145 .518* 0.246 6 .686** 0.309 0.202 0.171 0.008 0.243 0.145 0.163 0.035 0.077 0.323 0.134 7 .532* 0.186 0.24 -0.142 -0.205 -0.06 -0.037 -0.148 0.013 0.122 -0.235 -0.243 8 -0.347 -0.279 -0.377 -0.148 -0.221 -0.059 -0.245 0.075 -0.218 -0.188 -0.288 -0.326 9 0.021 -0.032 0.118 0.069 -0.023 0.032 -0.17 0.087 0.038 -0.045 -0.233 0.083 1 0 -0.281 0.022 -.463* 0.068 -0.018 .489* 0.225 0.337 0.253 0.196 -0.201 0.053
1 1 0.432 .578* * 0.302 .544* .516* .729* * .542* .640* * .609* * .449* 0.325 0.464 1 2 0.246 0.284 .458* 0.179 0.14 0.402 0.384 0.288 0.31 0.322 0.306 0.05
**. Correlation is significant at the 0.01 level (2-tailed). *. Correlation is significant at the 0.05 level (2-tailed).
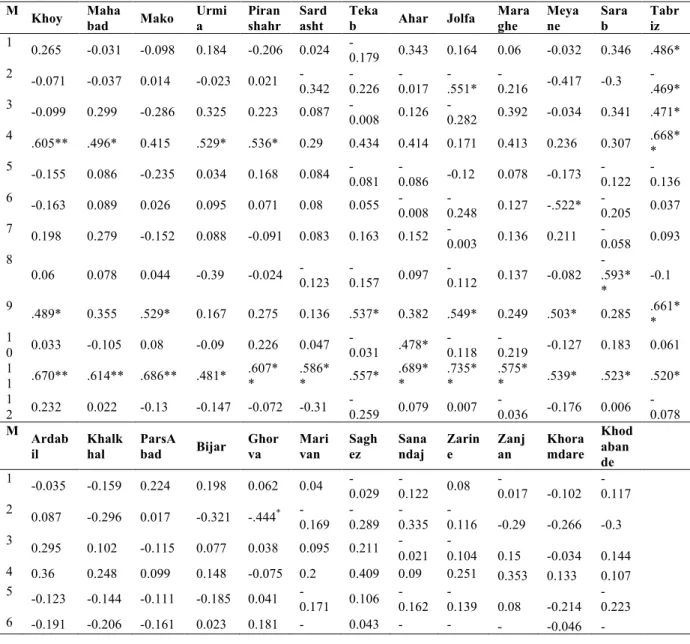
Table4shows the correlation between precipitations of study stations with NAO teleconnection index. The results demonstrate the relationship between precipitation and NAO pattern in all the stations except Khodabande and Sanandaj have significant correlation at the 0.05 and 0.01 percent confidence interval during 1 to 5 months of year. However, no significant relationship was found in the months of Jun, Jul and Dec.
The most significant relationship is for Julfa station in NOV with a correlation coefficient of 0.735 and the weakest relationship is for Ghorva in Jun with a correlation coefficient of
-0.444. As can be seen in Figure 4, significant correlation between precipitations of study stations NAO teleconnection index is positive.
Table 4: Correlation coefficient between the NAO teleconnection index and monthly precipitation over the Northwestern Iran
M Khoy Maha bad Mako Urmi a Piran shahr Sard asht Teka b Ahar Jolfa Mara ghe Meya ne Sara b Tabr iz 1 0.265 -0.031 -0.098 0.184 -0.206 0.024 -0.179 0.343 0.164 0.06 -0.032 0.346 .486* 2 -0.071 -0.037 0.014 -0.023 0.021 -0.342 -0.226 -0.017 -.551* -0.216 -0.417 -0.3 -.469* 3 -0.099 0.299 -0.286 0.325 0.223 0.087 -0.008 0.126 -0.282 0.392 -0.034 0.341 .471* 4 .605** .496* 0.415 .529* .536* 0.29 0.434 0.414 0.171 0.413 0.236 0.307 .668* * 5 -0.155 0.086 -0.235 0.034 0.168 0.084 -0.081 -0.086 -0.12 0.078 -0.173 -0.122 -0.136 6 -0.163 0.089 0.026 0.095 0.071 0.08 0.055 -0.008 -0.248 0.127 -.522* -0.205 0.037 7 0.198 0.279 -0.152 0.088 -0.091 0.083 0.163 0.152 -0.003 0.136 0.211 -0.058 0.093 8 0.06 0.078 0.044 -0.39 -0.024 -0.123 -0.157 0.097 -0.112 0.137 -0.082 -.593* * -0.1 9 .489* 0.355 .529* 0.167 0.275 0.136 .537* 0.382 .549* 0.249 .503* 0.285 .661* * 1 0 0.033 -0.105 0.08 -0.09 0.226 0.047 0.031 - .478* -0.118 -0.219 -0.127 0.183 0.061 1 1 .670** .614** .686** .481* .607** .586** .557* .689** .735** .575** .539* .523* .520* 1 2 0.232 0.022 -0.13 -0.147 -0.072 -0.31 -0.259 0.079 0.007 -0.036 -0.176 0.006 -0.078 M Ardab il Khalk hal ParsA bad Bijar Ghor va Mari van Sagh ez Sana ndaj Zarin e Zanj an Khora mdare Khod aban de 1 -0.035 -0.159 0.224 0.198 0.062 0.04 -0.029 -0.122 0.08 -0.017 -0.102 -0.117 2 0.087 -0.296 0.017 -0.321 -.444* -0.169 -0.289 -0.335 -0.116 -0.29 -0.266 -0.3 3 0.295 0.102 -0.115 0.077 0.038 0.095 0.211 -0.021 -0.104 0.15 -0.034 0.144 4 0.36 0.248 0.099 0.148 -0.075 0.2 0.409 0.09 0.251 0.353 0.133 0.107 5 -0.123 -0.144 -0.111 -0.185 0.041 -0.171 0.106 -0.162 -0.139 0.08 -0.214 -0.223 6 -0.191 -0.206 -0.161 0.023 0.181 - 0.043 - - - -0.046
-0.058 0.068 0.035 0.288 0.119 7 0.358 0.181 0.359 0.135 -0.128 -0.033 0.06 0.15 -0.202 0.003 -0.044 -0.177 8 -0.065 -0.02 -0.034 0.202 0.054 0.039 -0.12 0.285 -0.08 0.135 -0.301 0.02 9 .568** .554* .447* 0.426 0.226 0.412 0.028 0.235 0.198 0.404 0.295 0.237 1 0 0.43 0.177 .497* -0.036 0.213 -0.258 0.043 -0.201 -0.01 0.044 .453* 0.105 1 1 .578** .603** .652** .535* 0.294 .576** .620** 0.384 .589** .590** .520* 0.453 1 2 0.142 -0.139 0.042 -0.157 -0.282 -0.313 0.017 -0.283 -0.234 -0.012 -0.031 -0.184 **. Correlation is significant at the 0.01 level (2-tailed).
*. Correlation is significant at the 0.05 level (2-tailed).
Table5shows the correlation between precipitations of study stations with AO teleconnection index. The results demonstrate the relationship between precipitation and AO pattern in all the stations except Khodabande and Sanandaj have significant correlation at the 0.05 and 0.01 percent confidence interval during 1 to 4 months of year. However, no significant relationship was found in the months of Jan, May, Jul, Sep and Dec.
The most significant relationship is for Khodabande station in NOV with a correlation coefficient of 0.628 and the weakest relationship is for Khoy in Jun with a correlation coefficient of -0.454. As can be seen in Figure 4, significant correlation between precipitations of study stations AO teleconnection index is positive.
Table 5: Correlation coefficient between the AO teleconnection index and monthly precipitation over the Northwestern Iran
M Khoy Maha
bad Mako Urmia Piranshahr Sardasht Tekab Ahar Jolfa Maraghe Meyane Sarab Tabriz
1 0.072 -0.355 -0.191 -0.181 -0.149 -0.173 -0.225 -0.13 -0.021 -0.27 -0.305 -0.207 0.031 2 -0.031 0.232 0.051 0.062 0.147 -0.147 -0.123 0.082 -.540* 0.05 -0.265 -0.113 -0.244 3 0.063 0.321 -0.153 0.39 0.364 0.02 -0.01 -0.003 -0.201 0.242 -0.036 -0.002 .521* 4 .533* -0.018 0.341 0.031 0.113 -0.082 0.113 0.227 0.271 0.063 0.005 -0.043 0.14 5 -0.189 -0.102 -0.102 -0.298 -0.169 -0.116 -0.208 -0.278 -0.147 -0.191 -0.381 -0.261 -0.222 6 -.454* -0.143 -0.189 -0.044 -0.139 -0.086 -0.097 -0.216 -.512* -0.121 -.631** -.496* -0.289 7 -0.206 0.112 -0.395 -0.24 0.014 0.297 -0.106 -0.009 -0.142 -0.098 -0.052 -0.044 -0.085 8 0.108 -0.214 -0.356 -0.213 -0.058 -0.127 -0.23 -.463* -0.046 0.037 0.027 -0.433 0.033 9 0.23 -0.007 0.134 0.162 -0.013 -0.202 0.211 0.327 0.145 0.106 0.181 0.02 0.228 10 0.205 0.154 0.09 0.239 0.443 0.186 -0.034 .566* * -0.103 -0.024 0.022 0.36 0.113 11 .500* .519* 0.41 .579** .602** .550* .472* 0.403 .542* .513* .449* .602** .596** 12 0.27 -0.099 -0.04 -0.285 -0.189 -0.322 -0.399 0.185 0.089 -0.143 -0.227 -0.05 -0.195 M Arda
bil Khalkhal ParsAbad Bijar Ghorva van Mari Saghez Sanandaj Zarine Zanjan
Khor amda re Khod aban de 1 -0.253 -0.217 0.098 -0.077 -0.149 -0.258 -0.338 -0.428 -0.234 -0.361 -0.253 -0.181 2 0.242 -0.217 -0.001 -0.142 -0.283 -0.055 -0.105 -0.117 0.003 -0.11 -0.09 -0.14 3 0.138 0.04 -0.24 -0.064 -0.116 0.088 0.182 -0.109 -0.15 0.017 -0.209 -0.008
4 -0.109 -0.054 0.144 -0.099 0.118 -0.157 0.019 0.005 0.083 0.275 -0.125 -0.102 5 -0.198 -0.153 -0.136 -0.39 -0.055 -0.34 -0.12 -0.321 -0.153 0.147 -0.144 -0.355 6 -.488* -.515* -0.257 -0.218 0.11 -0.399 -0.197 -0.287 -0.253 -.526* -0.331 -0.371 7 0.012 -0.028 0.11 0.016 0.011 -0.039 0.017 0.027 -0.092 0.014 0.067 -0.094 8 -0.034 -0.113 0.12 -0.188 0.236 -0.022 -0.297 0.269 -0.182 -0.328 -.492* -0.445 9 0.099 0.154 0.116 0.304 0.026 0.297 -0.361 0.128 0.078 0.215 0.3 0.179 10 .620** 0.168 .494* 0.197 0.346 -0.144 0.245 -0.093 0.037 0.107 .479* 0.155 11 .596** .506* .617** .533* .476* .560* .600** .489* .517* .484* .537* .628** 12 0.272 -0.162 0.136 -0.251 -0.313 -0.403 -0.049 -0.321 -0.352 -0.028 -0.144 -0.231 **. Correlation is significant at the 0.01 level (2-tailed).
*. Correlation is significant at the 0.05 level (2-tailed).
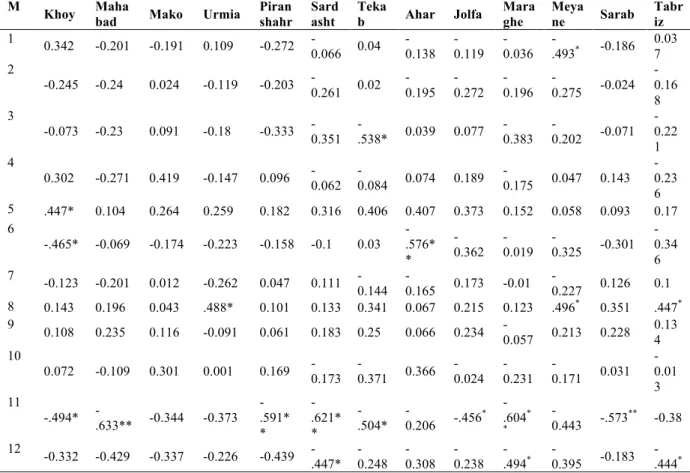
Table 6 shows the correlation between precipitation of study stations with SOI teleconnection index. The results demonstrate the relationship between precipitation and SOI pattern in all the stations except Khodabande and Sanandaj have significant correlation at the 0.05 and 0.01 percent confidence interval during 1 to 4 months of year. However, no significant relationship was found in the months of Feb ،Apr and Sep.
The most significant relationship is for Khodabande station in NOV with a correlation coefficient of -0.633 and the weakest relationship is for Khoy in Dec and Jun with a correlation coefficient of -0.444. As can be seen in Figure 4, significant correlation between precipitation of study stations SOI teleconnection index is negative.
Table 6: Correlation coefficient between the SOI teleconnection index and monthly precipitation over the Northwestern Iran
M Khoy Maha
bad Mako Urmia Piranshahr Sardasht Tekab Ahar Jolfa Maraghe Meyane Sarab Tabriz
1 0.342 -0.201 -0.191 0.109 -0.272 -0.066 0.04 -0.138 -0.119 -0.036 -.493* -0.186 0.037 2 -0.245 -0.24 0.024 -0.119 -0.203 -0.261 0.02 -0.195 -0.272 -0.196 -0.275 -0.024 -0.16 8 3 -0.073 -0.23 0.091 -0.18 -0.333 -0.351 -.538* 0.039 0.077 -0.383 -0.202 -0.071 -0.22 1 4 0.302 -0.271 0.419 -0.147 0.096 -0.062 -0.084 0.074 0.189 -0.175 0.047 0.143 -0.23 6 5 .447* 0.104 0.264 0.259 0.182 0.316 0.406 0.407 0.373 0.152 0.058 0.093 0.17 6 -.465* -0.069 -0.174 -0.223 -0.158 -0.1 0.03 -.576* * -0.362 -0.019 -0.325 -0.301 -0.34 6 7 -0.123 -0.201 0.012 -0.262 0.047 0.111 -0.144 -0.165 0.173 -0.01 -0.227 0.126 0.1 8 0.143 0.196 0.043 .488* 0.101 0.133 0.341 0.067 0.215 0.123 .496* 0.351 .447* 9 0.108 0.235 0.116 -0.091 0.061 0.183 0.25 0.066 0.234 -0.057 0.213 0.228 0.13 4 10 0.072 -0.109 0.301 0.001 0.169 -0.173 -0.371 0.366 -0.024 -0.231 -0.171 0.031 -0.01 3 11 -.494* -.633** -0.344 -0.373 -.591* * -.621* * -.504* -0.206 -.456* -.604* * -0.443 -.573** -0.38 12 -0.332 -0.429 -0.337 -0.226 -0.439 -.447* -0.248 -0.308 -0.238 -.494* -0.395 -0.183 -.444*
M Arda bil Khalk hal ParsA bad Bijar Ghor va Mari van Sagh ez Sana ndaj Zarin e Zanj an Khor amda re Khod aba nde 1 -0.298 -0.379 0.387 0.167 0.08 -0.294 -0.134 -0.274 -0.205 -0.224 0.053 0.319 2 -0.104 -0.25 -0.021 -0.313 -0.326 -0.335 -0.056 -0.407 -0.22 -0.036 -0.426 -0.263 3 -0.018 -0.195 -0.087 -.468* -.496* -.608* * -.489* -.520* -.571** -0.332 -0.344 -.615** 4 -0.084 0.104 0.161 -0.035 0.109 -0.193 -0.15 -0.03 -0.131 0.303 0.127 0.109 5 0.096 -0.078 0.077 -0.042 0.076 0.219 0.158 0.076 0.142 -0.04 0.216 0.078 6 -.444* -0.276 -.477* -0.014 0.014 -0.284 -0.045 0.035 -0.038 -0.046 -0.213 0.054 7 -0.374 0.013 -0.227 -0.046 0.118 0.276 0.021 0.022 -0.28 -0.011 0.197 -0.111 8 0.41 0.21 .477* 0.008 0.307 -0.011 0.109 0.091 0.215 0.092 0.255 0.152 9 0.15 0.188 0.014 0.161 0.206 0.15 0.152 -0.047 0.044 0.299 0.413 0.164 10 0.309 -0.023 .449* -0.089 0.029 -.504* -0.183 -0.379 -0.254 -0.247 0.099 -0.205 11 -0.375 -.608** -0.392 -0.412 -0.317 -.654* * -.458* -.499* -.536* -0.387 -0.209 -0.368 12 -0.268 -0.311 -.561* 0.012 -0.163 -0.396 -0.329 -0.185 -0.302 -0.134 -0.302 0.005 **. Correlation is significant at the 0.01 level (2-tailed).
*. Correlation is significant at the 0.05 level (2-tailed).
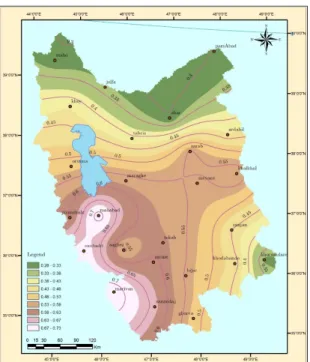
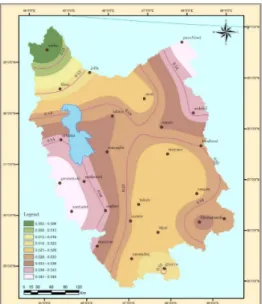
Figure 2 shows annual precipitation over northwestern Iran and Figures 3-6 demonstrate that relationship between precipitation and MEI, AO, NAO and SOI indices in NOV (the most significant month) was drawn and its zoning was prepared by use of Kriging method, in GIS software.
Figure 2: the northwest Iran's annual rainfall
Figure 4: Correlation coefficient Map between the MEI teleconnection index and precipitation in Nov over the Northwestern Iran
Figure 4: Correlation coefficient Map between the NAO teleconnection index and precipitation in Nov over the Northwestern Iran
Figure 5: Correlation coefficient Map between the AO teleconnection index and precipitation in Nov over the Northwestern Iran
Figure 6: Correlation coefficient Map between the SOI teleconnection index and precipitation in Nov over the Northwestern Iran
CONCLUSION
In this study, the relationship between 13 teleconnection indices and 24 weather stations in Northwestern Iran, were investigated. The main result from the study shows that the most influential patterns is the most influential pattern is MEI index that have The most significant correlation with precipitation and NAO ،AO and SOI are also at other level of Effectiveness. In addition, the relationship among precipitation with MEI ،NAO and AO indices is positive and with SOI index is negative. MEI index in May, Jun and Nov; NAO index in Nov, Apr and Sep; AO index in Nov and Jun and SOI in Nov are the most significant. With regard to correlations, seems to be any of Northern hemisphere teleconnection indices cannot show changes of precipitation in Northwestern Iran but a number of these patterns exhibit. It in some month so that teleconnection patterns have the most important correlation with precipitation in Nov.
REFERENCES
Anne Marie K. Stoner, Katharine Hayhoe, and Donald J. Wuebbles, 2009: Assessing General Circulation Model Simulations of Atmospheric Teleconnection Patterns. J. Climate, 22, 4348–4372. doi: http://dx.doi.org/10.1175/2009JCLI2577.1
Anthony G. Barnston and Robert E. Livezey, 1987: Classification, Seasonality and Persistence of Low-Frequency Atmospheric Circulation Patterns. Mon. Wea. Rev., 115, 1083–1126.. http://dx.doi.org/10.1175/1520-0493(1987)115<1083:CSAPOL>2.0.CO;2
Bacon, S. and D.J.T Carter, 1993: A connection between mean wave height and atmospheric pressure gradient in the North Atlantic. International Journal of Climatology, 13, 423-436. DOI: 10.1002/joc.3370130406
Berlage H .P, (1966).The Southern Oscillation and world weather. Mededl verhandel, 88.Kon.Ned, Meteor. Inst, 152pp.
Cinita, B. (2003), Analysis and regionalization of Northern European winter Precipitation based on its relationship with the North Atlantic Oscillation. International Journal Climate. 23: 1185-1194. DOI: 10.1002/joc.930
Chowdary. J. S, Shang-Ping Xie, Hiroki Tokinaga, Yuko M. Okumura, Hisayuki Kubota, Nat Johnson, and Xiao-Tong Zheng, 2012: Interdecadal Variations in ENSO Teleconnection to the Indo–Western Pacific for 1870–2007*. J. Climate, 25, 1722–1744. doi: http://dx.doi.org/10.1175/JCLI-D-11-00070.1 Daniel J. Leathers, Brent Yarnal, and Michael A. Palecki, 1991: The Pacific/North American Teleconnection Pattern and United States Climate. Part I: Regional Temperature and Precipitation Associations. J. Climate, 4, 517–528. doi: http://dx.doi.org/10.1175/1520-0442 (1991)004 <0517:TPATPA> 2.0.CO;2
Dunkeloh A & Jacobeit J, 2003.Circulation Dynamics of Mediterranean Precipitation Variability 1948–98. DOI: 10.1002/joc.973
John M. Wallace and David S. Gutzler, 1981: Teleconnections in the Geopotential Height Field during the Northern Hemisphere Winter. Mon. Wea. Rev., 109, 784–812. doi: http://dx.doi.org/10.1175/1520-0493(1981)109<0784:TITGHF>2.0.CO;2
James W. Hurrell., Influence of variations in extratropical wintertime teleconnections on Northern Hemisphere temperature, Geophys.Res. Len. 23, 665-668, 1996. DOI: 10.1029/96GL00459
Karumuri, Ashok; Swadhin K, Behera; Suryachandra A, Rao; Hengyi, Weng; Toshio, Yamagata.(2007), El Niño Modoki and its possible teleconnection, Journal of Geophysical Research,Vol 112.issue C11. DOI: 10.1029/2006JC003798
Kingtse C. Mo and Robert E. Livezey, 1986: Tropical-Extratropical Geopotential Height Teleconnections during the Northern Hemisphere Winter. Mon. Wea. Rev., 114, 2488–2515. doi: http://dx.doi.org/10.1175/1520-0493(1986)114<2488:TEGHTD>2.0.CO;2
Lau KM, Weng HY (2002) recurrent teleconnection patterns linking summertime precipitation variability over East Asia and North America. J Meteorol Soc Jpn 80:1309–1324. doi: http://dx.doi.org/10.2151/jmsj.80.1309
Lopez-Bustins Joan-Albert, Martin-Vide Javier, Sanchez-Lorenzo Arturo, (2008). Iberia winter rainfall trends based upon changes in teleconnection and circulation patterns, Global and Planetary Change63, pp 171-176. DOI: 10.1016/j.gloplacha.2007.09.002
Qinghua Ding and Bin Wang, 2005: Circumglobal Teleconnection in the Northern Hemisphere Summer*. J. Climate, 18, 3483–3505. doi: http://dx.doi.org/10.1175/JCLI3473.1
Rasmusson E.M, and Wallace J.M, (1983).Meteorological aspects of the El Nino / Southern Oscillation,Science,222,1195-1202. DOI: 10.1126/science.222.4629.1195
Sheridan, Scott C.(2003), North American Weather-Type Frequency and Teleconnection Indices, International Journal of Climatology, Vol 23,pp.27-45. DOI: 10.1002/joc.863
Steven B. Feldstein, 2002. The dynamics of NAO teleconnection pattern growth and decay, Q. J. R. Meteorol. Soc., 129, pp. 901–924. DOI: 10.1256/qj.02.76
Trenberth, K. E., G. W. Branstator, D. Karoly, A. Kumar, N.-C.Lau, and C. Ropelewski, 1998: Progress during TOGA in understanding and modeling global teleconnections associated with tropical sea surface temperatures. J. Geophys. Res. 103 (C7), 14 291–14 324. DOI: 10.1029/97JC01444
Walker, G. T., and E. W. Bliss, 1932: World Weather V. Mem. Roy. Meteor. Soc., 4, No. 36, 53-84. [Documents DJF and JJA variability.], http://research.jisao.washington.edu/data_sets/walker/.
Yuyun, Liu; Lin, Wang; Wen, Zhou; Wen, Chen, (2014). Three Eurasian teleconnection patterns: spatial structures, temporal variability, and associated winter climate anomalies. Climate Dynamics, Vol 42, Issue 11-12, pp 2817-2839. DOI: 10.1007/s00382-014-2163-z