Selçuk J. Appl. Math. Selçuk Journal of Vol. 11. No. 2. pp. 3-11, 2010 Applied Mathematics
Population Dynamical Model for AIDS Patients of a Particular Area Shamsur Rahman1, Atiqur Rahman2
1Department of Mathematics Maulana Azad National Urdu University, Polytechnic
Chandanpatti Laharisari, Darbhanga-846001, Bihar , India e-mail: sham sur@ rediffm ail.com,sham surr@ indiatim es.com 2ICAR- Research Complex for Eastern Region Patna India
e-mail: rahm an patna@ yaho o.co.in
Received Date: August 18, 2008 Accepted Date: October 18, 2010
Abstract. This is an attempt to translate the problem of AIDS patients into a mathematical problem, thereafter interpreting the solution in the language of real world. Here we proposed HIV/AIDS among the peoples as a resultant func-tion of their unnatural sexual intercourses and obtained exponential HIV/AIDS patients growth model and logistic curve for HIV/AIDS patients. The interpre-tation of the logistic curve showed that the HIV/AIDS patient growth is massive and needs urgent care in terms of personal vulnerability of HIV infections. Key words: AIDS Patient, Mathematical Problem, Resultant function, Un-natural Sexual Intercourses Exponential HIV/AIDS Patients Growth Model and Logistic Curve.
2000 Mathematics Subject Classification: 97M10, 97M20. 1. Introduction
AIDS is incurable disease that slowly attacks and destroys the body’s immune system. AIDS (Acquired Immune Deficiency Syndrome) is not hereditary and is characterized by a number of symptoms occurring together. The term syndrome is therefore used for defining AIDS. It is the HIV i.e. the Human Immune Defi-ciency Virus that finally leads to AIDS. The presence of HIV is particularly high in blood, semen of man, cerebrospinal fluid, and vaginal and cervical secretions of the woman. The HIV is transmitted through unnatural sexual intercourse, hetero sexual or homosexual, either vaginal sex, oral sex or anal sex.
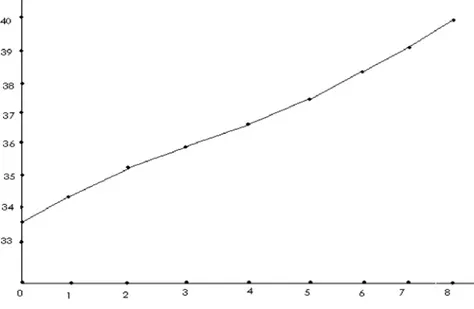
The statistics regarding HIV/AIDS given paper (Table 1) are those from United Nations Programme on HIV/AIDS (UNAIDS) and the World Health Organiza-tion (WHO) publicaOrganiza-tions [2],[3], [4], [5].From data it is observed that the total
number of AIDS patients was 33.4 million, and the total number of AIDS deaths was 2.5 million in 1998, and 39.5 million AIDS patients and the total number of AIDS deaths was 2.9 million in 2006. The people who had high-risk behavior for HIV infection were due to mainly MSM (Men having sex with men), FSW (female sex workers) and unnatural hetero sexuality. Unnatural sexual (hetero or homo sexual) promiscuous behaviour is the most probable source of infec-tion. More than 80 percent AIDS patients are due to unnatural hetero sexual or homo sexual relations ([6], [7], [8], [9]). AIDS patients in India were reported 86 percent in 2005 due to hetero sexual or homo sexual promiscuous behaviour [10].
Hypothesis: If the situation modeled some continuous variable(s) and we have some reasonable hypothesis about the rates of change of dependent variable(s); mathematical modeling in terms of differential equations arises. When we have a variable depending on an independent variable , we obtain a mathematical model in terms of ordinary differential equation of the first order if the hypoth-esis is about the rate of change [1].
Since the dynamics of HIV/AIDS infected population a particular area is de-pends on social and economical saturations which generate the factors respon-sible for the development and transmission of HIV. Let be a parameter on which the dynamics of number of HIV/AIDS infected population depend and composed of two factors say , which denotes the rate of increase, and denote the rate of retardation of HIV/AIDS infected population
Then the total be the number of AIDS patients of a particular area, then will be the function of i.e. () . Then at ( + ∆) , number of AIDS patients will be equal to ( + ∆) , and the change in HIV/AIDS infected population will be ( + ∆) − () at the interval ∆ . Then
( + ∆) − () = ( − )∆ Suppose = − Therefore
( + ∆) − () = ∆ On dividing by ∆ and taking ∆ → 0, we get
(1)
= Integrating equation (1), results
log = + log 1
(2) = 1
Now at = 0, = (0) which represents the value of when the effect of the parameter is insignificant, and then 1= (0) , therefore
(3) () = (0)
Figure 1
From Logistic Theory there may be many sub parameter which decrease or increase the population of HIV/AIDS patients then and may be further cauterized and can be given
= 1− 2 = 1+ 2 1 2 1 2 0 Therefore
− = (1− 1) − (2+ 2) = − and equation (1) becomes
(4) = ( − ) 0 0 On integration, we obtain (5) () − () = 2 or (6) () = 1 + 1 2 − = 1 + 1 2 − Let be the value of for which () = 2. Then
2 = 1 +1 2 − ⇒ 2= 1 −
Substituting this in equation (6)
(7) () =
1 + (−) = 1 + (−)
This is the form in which the equation of logistic curve is generally expressed. But
2=
(0)
Therefore (8) () − () = (0) − (0) Form (4) (9) 2 2 = − 2 so that (10) 2 2 0 2 = 2
The critical value 2 occurs when = . Thus the patients growth curve is convex if 2 = 2 and concave if 2 =
2 and it has a point of inflexion at = 2 = 2 . Equations (4) and (8) show that
(i)(0) = ⇒ () = ⇒ 0
This implies that () is monotonic increasing function of which approaches = as → ∞, is called the saturation level of the patients.
(ii)(0) ⇒ () ⇒ 0
This implies that () is monotonic decreasing function of which approaches
as → ∞.
(iii)The curve is skew symmetric in the sense that () − ( − ) = ( + ) − ()
= 2[
− 1
+ 1]
The above properties taken together indicate that the curve is shaped like an elongated [13]. The graph of () against is given below:
2. Fitting of a Logistic Curve (Method of Rhodes) If the AIDS patients follows a logistic curve strictly,
1 ( − 1) = 1 + (−+1) 1 () = 1 + (−) Therefore, (11) 1 () = 1 − − + − ( − 1) Writing (12) 1 () = () 1 ( − 1) = 0 () = 1 − − = −
Equation (11) can be express as
(13) () = + 0()
Thus if the HIV/AIDS infected population follows exactly a logistic curve then () and 0() will be linearly related. However it is observed that HIV/AIDS infected population does not follow logistic exactly. Denoting 0() the observed HIV/AIDS infected population at parameter and
() = 1 0 () 0 = 1 00 () we shall have () = + 0() + ()
where () is the error due to deviation of observed AIDS patients from the logistic patients.
The estimates are ∧= = s P−1 1 ( () − )2 P−1 1 (() − )2 ; ∧= = − where = 1 − 1 X−1 1 () = 1 − 1 X−1 1 () = + 1 − 1[ 1 ( − 1)− 1 (0)] and are estimated from estimates of and by relations (12). Finally is estimated by noting that for the logistic curve,
= 1 log(
An estimates of is obtained as the arithmetic mean (14) ∧= 1 X−1 =0 (log( 0() − 1)) + − 1 2 () = 027649 () = 0270271 −1 X 1 ( ()− )2= 2429610−6 −1 X 1 (()−)2= 2675810−6 = 9529 Therefore = 048256 = 007246 = 65016 ∧= −1393608 The logistic curve is
() = 65016
The plot between the total estimated HIV/AIDS infected population and the parameter is plotted in Fig.3
Figure 3. vs. total estimated HIV/AIDS infected population 3. Conclusion
The hypothesis proposed in this paper follow the Logistic curve but fitting of this Logistic curve (methods of Rhodes), Fig.3, is neither exponential nor purely -curve (biological shape), however, from population dynamic theory there are two models of population growth: Exponential curve (also known as a -curve) which occurs when there is no limit to population size, and the Logistic curve (-curve) shows the effect of a limiting factor. This shows that in assumed parameter , which is function of both () and () , the increasing factors () of HIV/AIDS infected population is more dominant than the retarding factor () .Therefore, despite world wide efforts, the population of HIV/AIDS infected persons are still increasing with very high rate compared to the efforts which is being made to retard the growth of HIV/AIDS infected persons. For conspicuous retardation the logistic curve must follow the -curve , as the -curve represents that there are some limiting factor which retard the growth of the HIV/AIDS affected populations.
References
1. Kapur, J.N .1989. Mathematical modeling . Wiley Eastern Limited New Delhi (India).
2. UNAIDS and World Health Organization.1998. Global HIV/AIDS Epidemic,Geneva. 3. UNAIDS and WHO. AIDS Epidemic Update December 2004, Geneva
4. UNAIDS and WHO. 2005. AIDS Epidemic Update December, 2005. 5. WHO and UNAIDS.2006 .Global summary of the HIV and AIDS epidemic 6. Stolte IG et.al .2002.A summary report from Amsterdom : increase in sexually transmitted diseases and risky sexual behaviour among homosexual men in relation to the introduction of new anti HIV drugs. Euro Survill 2002; 7(2): 19-22
7. Basu I et.al. 2004.HIV prevention among sex workers in India. Journal of Acquired Immune deficiency Syndromes, 36 (3) : 845-852.
8. Yang H et. al .2005.Heterosexual transmission of HIV in china: A systematic review of behavioral studies in the past two decades. Sexually transmitted diseases. 32(2): 270-280. May
9. Shakarishvili A et. al .2005.Sex work, drug use, HIV infection and spread of sexually transmitted infections in Moscow, Russian Federation. The Lancet, 366: 57-60 10. National AIDS Control.2005. Monthly Updates on AIDS Organization (31st July, 2005)
11. Shamsur Rahman and Shafiullah..2002. Mathematical Modelling of life-conditions of people of particular area through ordinary differential equations.Jour. PASVol.8, pp 205-211, 2002, ISSN 0972-3498
12. Thomas, G. Hallam and Simon, A. Levin.1986.Biomathematics Vol. 17, Mathe-matical Ecology An Introduction, Springer Verlag Tokyo.
13. Mukhopadhyay, Parimal.1999.Applied Statistics, Books and Allied (P) Ltd. Cal-cutta, India.