https://doi.org/10.1007/s10337-018-3624-z
ORIGINAL
Chemometrics-Assisted Optimization of Beta-/Gamma-Tocol
Separation on a C
30Stationary Phase in Reversed-Phase LC
Fatma Nur Arslan1,2 · Hans‑Gerd Janssen2,3
Received: 14 July 2018 / Revised: 4 September 2018 / Accepted: 28 September 2018 / Published online: 8 October 2018 © Springer-Verlag GmbH Germany, part of Springer Nature 2018
Abstract
This paper presents a chemometrics-assisted optimization study to improve the separation of tocopherol (-T) and tocotrienol (-TT) homologues on a C30 stationary phase in reversed-phase HPLC. The HPLC settings were optimized using a central composite design and the response surface methodology. Flow rate, column temperature, and mobile phase composition were chosen as independent variables. Peak resolution (Rs), analysis time (tR), and peak symmetries of the tocopherol isomers
were chosen as response variables. Optimum performance in terms of Rs was obtained at a flow rate of 0.31 mL min−1, a
temperature of 8.70 °C, and % B content (methyl tert-butyl ether: methanol: water, 80:18:2, v/v/v) in the mobile phase of 38.12%. The analysis of variance and regression analysis gave adjusted R2 values of 0.9841 for R
s, 0.9850 for tR-(α-T), 0.9853
for tR-(β-T), and 0.9204 for the peak symmetry of β-T. This confirms the good agreement of experimental data with predicted
values. The close eluting peaks of β-/γ-tocol could be baseline separated at the optimized conditions at a minimized analysis time. Empirical second-order polynomial models were derived that gave statistically high significances (P < 0.0001). Hence, the models can be successfully employed to predict the optimum separation conditions of co-eluting peaks of β-/γ-tocols. The optimized method was successfully applied to determine the individual tocol homologues in various cold pressed edible oils. Total contents ranged from 15 to almost 2600 mg tocol kg−1 oil.
Keywords Chemometrics · Optimization · Tocols · Central composite design · Response surface methodology
Introduction
Tocols involve a group of structurally related amphiphilic, lipid-soluble antioxidants that have various biological activi-ties. Natural tocols primarily comprise eight homologues:
α-, β-, γ- and δ-isomers of tocopherol (T), and tocotrienol (TT), based on the number and position of the methyl groups on the chromanol ring [1–4]. Numerous studies have demon-strated that these natural compounds are key bioactive com-pounds in the human diet and the tocols are well recognized for their strong antioxidant, anti-cancer, immunomodulatory, neuroprotective, and hepatoprotective and anti-inflammatory activities [5–9]. Tocols are also employed to enhance the stability and shelf life of food products. Because not all tocol isomers are equally active with regard to the above men-tioned beneficial effects, the isolation, separation, and quan-tification of individual tocols is of great interest [10, 11].
Because of the growing interest in tocols and the need for a better understanding of the activities of the individual isomers, there is a need for improved analytical methods for tocol analysis. Several methods for tocol analysis based on liquid chromatography have been described in literature [8, 12]. Both normal-phase (NP) and reversed-phase (RP) HPLC are used, coupled either with UV- or fluorescence detection. The most remarkable difference between these techniques is the separation of the β- and γ-tocol isomers
Electronic supplementary material The online version of this
article (https ://doi.org/10.1007/s1033 7-018-3624-z) contains
supplementary material, which is available to authorized users. * Fatma Nur Arslan
[email protected] Hans-Gerd Janssen
1 Department of Chemistry, Faculty of Science, University
of Karamanoglu Mehmetbey, 70100 Karaman, Turkey
2 Van’t Hoff Institute for Molecular Sciences,
Analytical-Chemistry Group, University of Amsterdam, Science Park 904, 1098 XH Amsterdam, The Netherlands
3 Central Analytical Science Unit, Unilever Research
Laboratory, P.O. Box 114, 3130 AC Vlaardingen, The Netherlands
[13–15]. Whereas all tocol isomers can be successfully separated using NPLC, in most RP-HPLC methods β- and γ-tocols co-elute [13, 15–17]. Unfortunately, the use of NP stationary phases can be problematic due to their high sensi-tivity to small alterations in mobile phase composition caus-ing long equilibration times and unstable retention times. Reversed-phase stationary phases have a superior stability and robustness, show rapid equilibration, and generally can be operated with more environmentally friendly eluents [18–20]. Unfortunately, however, conventional reversed-phase stationary reversed-phases such as octyl- or octadecyl-modified silica and standard mobile phases do not provide satisfactory resolution for the β- and γ-tocols [13, 15, 21, 22]. With the implementation of new stationary phases, such as organic monolithic phases [23, 24], polyvinyl alcohol modified materials [25], solid-core penta fluorophenyl (PFP) columns [8, 26], and alkyl-bonded C30 silica columns [18, 27], the
separation of β- and γ-tocols under RP-HPLC conditions has improved. Among these novel reversed-phases, the C30
sta-tionary phases offer greater shape selectivity in the resolu-tion of tocols compared to convenresolu-tional reversed-phase col-umns. Their superior performance results from their rigid, highly ordered longer C30 alkyl groups and dense surface
coverage [18, 27], Although reversed-phase HPLC methods using C30 phases have already been described for the
deter-mination of tocols, their performance was not ideal due to the need for additional sample pre-treatment, use of large volumes or exotic eluents and long analysis times [11, 18,
22, 26], Hence, it is necessary to optimize the experimen-tal parameters that affect the separation performance of C30 stationary phase for the close-eluting β- and γ-tocol peaks.
In most method development studies, analysts have tradi-tionally followed the practice of altering “one-variable-at-a-time” or a “step-by-step” optimization. These approaches for method optimization are laborious, time consuming, and unsuccessful for detecting the accurate optimum condi-tions as they do not take into account interaccondi-tions among the experimental factors [28–30]. Multi-factor experimental designs, such as the response surface methodology (RSM), are widely used for method optimization since they are less laborious and faster as they allow considering mutually influencing experimental factors in a rapid manner. The cen-tral composite design (CCD) method, a second-order tech-nique of RSM, has been successfully used to determine the interaction effects among experimental factors and provides closer information of the influencing factors [28, 31, 32]. Many experimental factors affect the separation efficiency of reversed-phase columns for the tocol isomers. Despite that, so far only trial and error optimization has been performed for the tocols and there have been no reports in literature on the systematic optimization of experimental factors and the evaluation of the effects of the various variables using the CCD methodology.
Here we report the first chemometric-assisted optimiza-tion study for the separaoptimiza-tion of eight tocol homologues in reversed-phase LC on a C30 column. The effects of three
important experimental factors (mobile phase flow rate, column temperature, and mobile phase content) on the most important chromatographic performance parameters were systematically analyzed using CCD. Also, the optimal method parameters were applied for the determination of tocols in several cold pressed oil samples.
Experimental
Materials
HPLC grade methanol (MeOH), water, methyl tert-butyl ether (MTBE), hexane (Hx) and other chemicals were purchased from Sigma Chemical Co. (St. Louis, MO, USA), VWR international (Poole, UK) and Merck (Darm-stadt, Germany). Standards of DL-α-tocopherol acetate,
rac-β-tocopherol, (+)-γ-tocopherol, (+)-δ-tocopherol,
α-tocotrienol, β-tocotrienol, γ-tocotrienol and δ-tocotrienol (HPLC purity grade of ≥ 95.0%) were purchased from Sigma Aldrich (Zwijndrecht, The Netherlands). Stock solutions of standard materials were prepared in hexane at a concentra-tion of 1000 µg mL−1 and were stored at − 20 °C. For
cali-bration, standard mixtures were diluted from the stock stand-ard by dilution with hexane to the appropriate concentrations (10–500 µg mL−1). Commercial cold pressed oil samples
[wheat germ oil (WGO), black cumin seed oil (BSO), fig seed oil (FSO), coriander oil (CO), linseed oil (LSO), grape seed oil (GSO), poppy seed oil (PO), pomegranate seed oil (PGSO), safflower oil (SFO), sesame oil (SSO), pumpkin seed oil (PSO), nettle seed oil (NSO), hemp oil (HO) and walnut oil (WO)] were purchased from local supermarkets in Karaman, Turkey. Oil samples (1 ± 0.01 g) were weighted into centrifuge tubes and 1 mL of hexane was added. The tubes were shaken for 2 min and the samples were filtered through 0.45 µm PTFE membrane filters before injection. All handling of tocol standards and samples was done under dimmed yellow light conditions.
Reversed‑Phase HPLC/FLD Conditions
All chromatographic analyses were performed on an Agilent 1200 HPLC-system (Agilent Technologies Inc, Wilmington, DE, USA) connected to an Agilent G1321C fluorescence detector (FLD). Flexible peek tubing and connectors were used to connect the system components. Data were recorded using Agilent’s Chemstation B.03.02-2008 data station.
The separations were performed on a stainless-steel Develosil C30 column (250 × 4.6 mm, 5 µm; Phenomenex
using solvent A (methanol: water, 91:9, v/v) and solvent B (methyl tert-butyl ether: methanol: water, 80:18:2, v/v/v). Different flow rates and temperatures were used to optimize the separation.
The mobile phase solvents A and B reported by Kne-cht et al. [33] were used with a modified gradient program. Afterwards the effects of the chromatographic settings were optimized using RSM based on the CCD. For detection the FLD was operated at excitation and emission wavelengths of 295 nm and 330 nm, respectively. Peak identification in cold pressed oil samples was performed by comparing the retention times and the spectra of unknown peaks with those of tocol standards.
Central Composite Design Experiments
The optimum separation conditions of the reversed-phase method for resolving the β- and γ-tocols at a minimum anal-ysis time were established by RSM using MATLAB R2007b (MathWorks, Santa Clara, CA, USA). Three independent parameters were included in the optimization: mobile phase flow rate (X1), column temperature (X2), and % B content
(MTBE: MeOH: H2O, 80:18:2, v/v/v) in the mobile phase
between 10 and 21 min of gradient program (X3). Peak resolution (Rs), analysis time (tR) and peak symmetries of the tocopherol isomers were studied as the dependent vari-ables (responses). In the experiments, elution was carried out using the following gradient program of solvents A and B: 0–5.5 min 0% B, 5.5–10 min 0 − X3 % B, 10–21 min
X3 % B, 21–31 min X3 − 55% B, 31–33 min 55–80% B,
33–36 min 80% B, 36–38 min 80–0% B, 38–40 min 0% B. The levels of the independent variables tested are given in Table 1. 20 µL of the sample was injected into the system in all experiments.
The independent variables were coded at five different levels as − 1.68, − 1, 0, + 1, and + 1.68. The proposed design comprised a total of 23 experimental points including nine repetitions of the center point. The 23 experiments were carried out in random order to reduce the effects of unfore-seen variations in the observed responses. After perform-ing all experiments, a second-order polynomial model was
fitted through the response values using MATLAB R2007b software. The variations of the peak resolution, retention times and peak symmetries of the tocol isomers (y) versus the independent parameters (X1, X2 and X3), were displayed using a quadratic model given by the following equation:
where “y” represents the predicted response values, β0 is a constant which presents the intersection with the y-axis and represents the average effect of the factors. β1, β2 and β3 are regression coefficients. β12, β13, β23 and β123 are the
regression coefficients of the interactions of variables [34]. The residual error, pure error, lack of fit, coefficient of deter-mination and F test values obtained from the analysis of variance (ANOVA) were used to check the statistical sig-nificance of the proposed model. Also, three-dimensional (3D) response surface plots were generated to determine the optimum conditions and investigate interactions between the different independent variables. Model validity was further verified by comparing the observed data with the predicted values of the model.
All experiments were performed in triplicate and the results obtained were expressed as mean value ± standard deviation. Standard software packages such as Excel (Micro-soft, 2010), OriginPro 8 (OriginLab, Northampton, MA, USA) and MATLAB R2007b (MathWorks, Santa Clara, CA, USA) were used to design and analyze the chromato-graphic data. ANOVA calculations were performed in Excel to assess the statistical significance and validate the models.
Method Validation and Application to Real Samples
The validation studies were performed on 5 days (n = 5) and recovery studies were performed at three different concentra-tion levels. The calibraconcentra-tion was carried out by injecting the set of tocopherol and tocotrienol standards in triplicate, on each day. Calibration curves were constructed by plotting (1) y = 𝛽0+ 𝛽1⋅ X1+ 𝛽2⋅ X2+ 𝛽3⋅ X3+ 𝛽11⋅ X1 2 + 𝛽22⋅ X2 2 + 𝛽33⋅ X3 2 + 𝛽12⋅ X1⋅ X2 + 𝛽13⋅ X1⋅ X3+ 𝛽23⋅ X2⋅ X3+ 𝛽123⋅ X1⋅ X2⋅ X3,
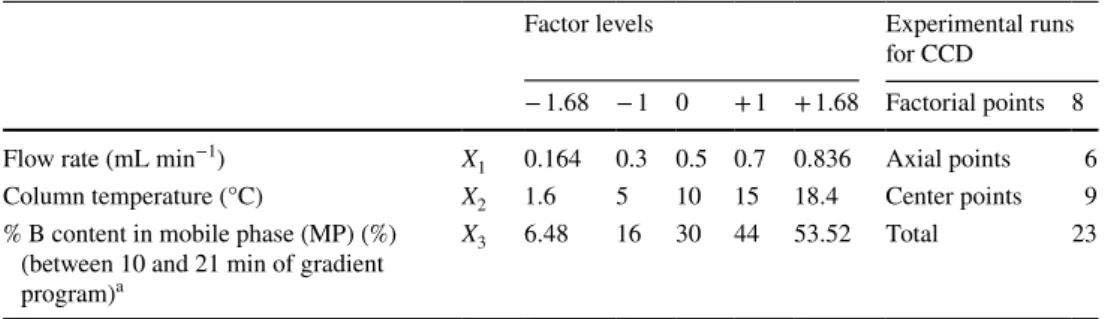
Table 1 Coded and actual levels of variables for the central composite design matrix
a Solvent B: methyl tert-butyl ether: methanol: water, 80:18:2, v/v/v
Factor levels Experimental runs
for CCD
− 1.68 − 1 0 + 1 + 1.68 Factorial points 8
Flow rate (mL min−1) X
1 0.164 0.3 0.5 0.7 0.836 Axial points 6
Column temperature (°C) X2 1.6 5 10 15 18.4 Center points 9
% B content in mobile phase (MP) (%) (between 10 and 21 min of gradient
program)a
the peak area versus the concentration of the tocols. Stock solutions of standards were prepared in hexane at eight dif-ferent concentrations from 0 to 100 µg mL−1 (α-TT, β-TT,
γ-TT, δ-TT and δ-T), 0 to 500 µg mL−1 (β-T and γ-T) and
0–1000 µg mL−1 (α-T). The values were selected taking into
account both the method sensitivity and the typical levels of the tocol isomers in refined or cold pressed edible oils. The linearity of each calibration curve was assessed from the residual plots and the correlation coefficients. LOD and LOQ values were calculated as 3.3 and 10 times the standard deviation of the signal expressed in fluorescence units.
The optimum method parameters were applied in the determination of tocols in selected commercial cold pressed oil samples. The contents of α-, β, γ-, and δ-tocols were determined in a variety of cold pressed oils including WGO, BSO, FSO, CO, LSO, GSO, PO, PGSO, SFO, SSO, PSO, NSO, HO and WO samples. Quantification was performed on the basis of their peak areas by using calibration curves. All analyses were performed in triplicate and results were reported as mean value ± standard deviation.
Results and Discussion
Model Fittings and Statistical Analysis
The experimental design parameters and response values for the analytical C30 column are given in Table 2 and Sup-plementary table 1. As explained above, 23 experimental runs consisting of nine replicates of the center point, eight factorial points and six axial points were carried out. The mobile phase flow rate (X1), column temperature (X2), and the mobile phase composition, i.e. % B (MTBE:MeOH:H2O, 80:18:2, v/v/v) (X3), were identified as the most important
chromatographic parameters (variables). They were studied at five different levels. Including more variables or more levels in the optimization study would not be a suitable approach. Doing so would increase the number of treatment combinations, which could cause problems with the avail-ability of sufficient homogeneous experimental material. Moreover, when a large number of treatment combinations are included in an experiment, its execution will become time consuming and statistical analysis may become dif-ficult [34–37]. The ranges selected for optimization were 0.164–0.836 mL min−1, 1.6–18.4 °C, and 6.48–53.52% B,
respectively. The method optimization was performed using a standard mixture containing all α-, β-, γ-, and δ-tocol isomers.
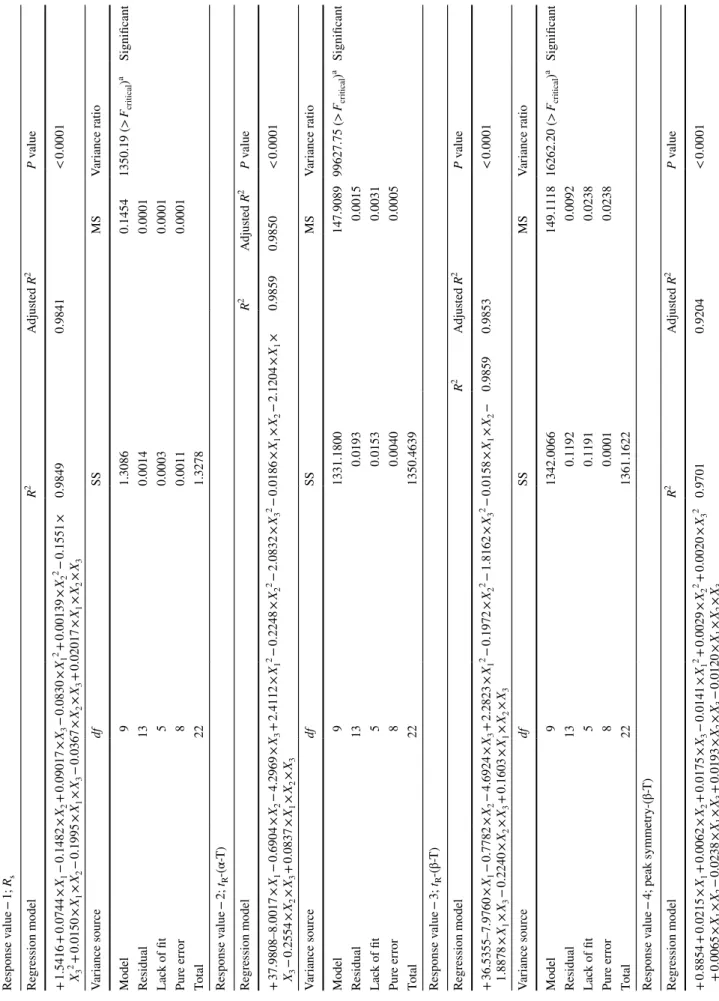
The peak resolution (Rs), retention times (tR) and peak symmetries of tocol isomers were selected as response val-ues. Based on the experimental design, the second-order polynomial equations in terms of the actual factors were determined that reveal the empirical relationships between
the independent factors and the selected responses (Table 3
and Supplementary table 2).
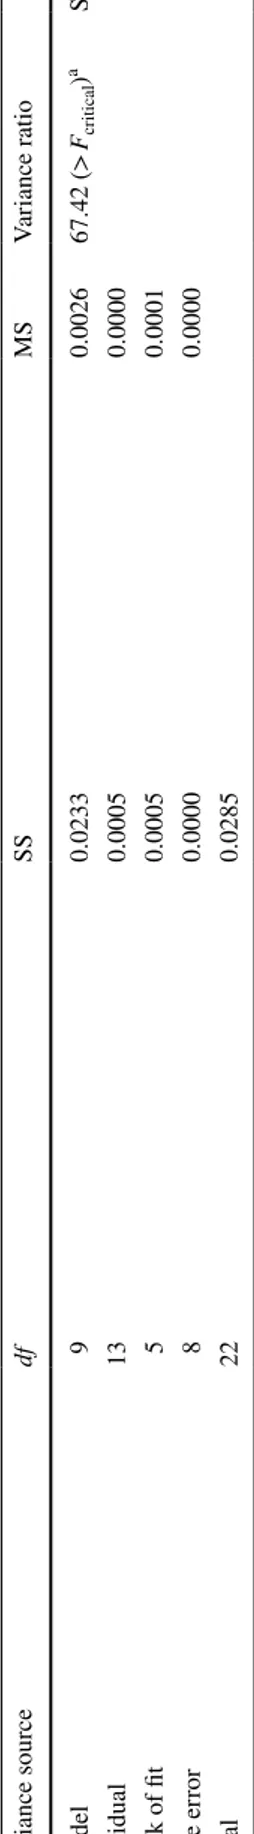
To determine the adequacy of the proposed model, an analysis of variances (ANOVA) was performed for Rs, tR and the peak symmetries of tocol isomers. The results are summarized in Table 3 and Supplementary table 2. The data in Table 3 show that the empirical second-order polynomial models were highly significant with F values of 1350.19 for
Rs, 99627.75 for tR-(α-T), 16,262.20 for tR-(β-T) and 67.42 for peak symmetry-(β-T) response (P < 0.0001). Clearly the proposed model is statistically highly significant and ade-quate for describing the selected responses in the range of the experimental parameters considered. Also, the calculated adjusted coefficients (R2) were within the acceptable limits
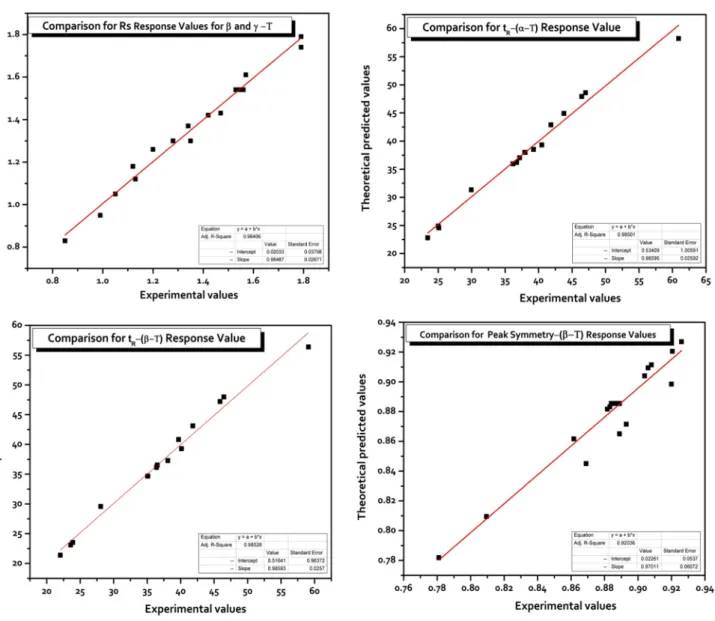
of R2 ≥ 0.80 [38] for R
s, tR-(α-T), tR-(β-T) and peak symmetry
of β-T with values of 0.9841, 0.9850, 0.9853 and 0.9204, respectively (Fig. 1). It can be concluded from the figure that the fitted model correctly describes the observed data with a significance level of 0.05. The calculated adjusted R2
values for tR and peak symmetry of γ-T are presented in Sup-plementary Fig. 1. The results reveal that the fitted models offer an excellent description of the relationship between the response values and the variables. It can also be concluded that the model derived here can be employed for the optimi-zation of the separation of the β-/γ-tocol peaks on the C30 reversed-phase method.
Effect of Independent Factors on the Separation Performance of the C30 Column in the RSM Model
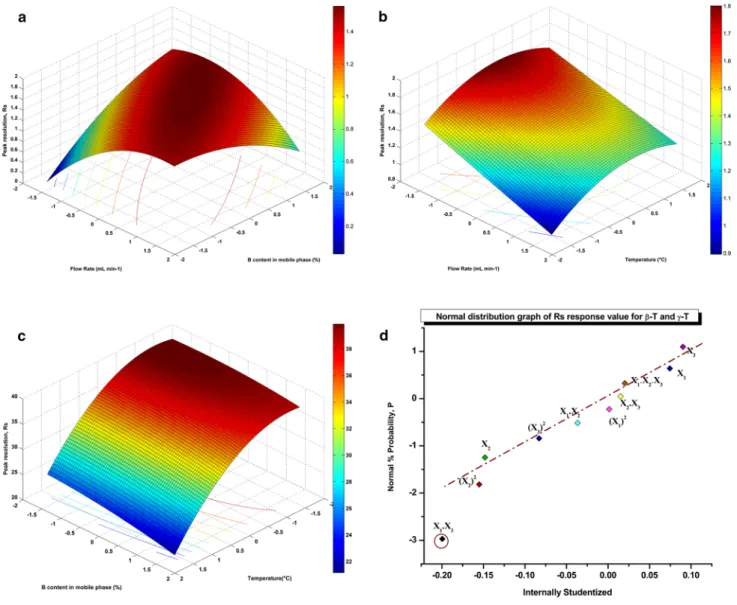
To present the interactive effects of the independent factors on the separation of the tocols, 3D response surface plots and normal distribution (ND) graphs are shown in Fig. 2. These plots are generated by plotting the response (Rs value)
on the z-axis against two independent factors (x- and y-axes) while remaining the other independent factor at the fixed (center) point. The ND graphs show regularity in terms of the errors and should be linear. Figure 2a illustrates the 3D response surface plot for the interactive effect of flow rate and % B content in the mobile phase on the Rs response value (y = Rs; peak resolution of β-/γ-tocopherol) keeping column temperature at the center point (10 °C). An increase of B % content in the mobile phase or a decrease in the flow rate both lead to a better Rs value for the—peak pair β-/γ-tocol. When the B % in the mobile phase was changed from low to middle level (roughly from 30 to − 44% of B %), it was found that the Rs value increased. Also, when the flow
rate was changed from middle to high values (roughly 0.5 to − 0.84 mL min−1), it was found that the R
s value increased.
Figure 2b shows the 3D response surface plot for the interac-tive effect of column temperature and flow rate at the center value of % B (30% B in mobile phase). A decrease of the flow rate from the middle level of 0.5 mL min−1 to the low
Table
2
Centr
al com
posite design matr
ix wit h 5 le vels/3 f act or and r esponse v alues a T means t ocopher ol; tR -(β-T) means r etention time f or be ta t ocopher ol; Rs means r esolution f act or be tw een tw o peak b Sol vent B: me th yl te rt-buty l e ther : me thanol: w ater , 80:18:2, v/v/v c Means wit hin a column ar e significantl y differ ent ( P < 0.05), V alues ar e r epor ted as means ± SD of t hr ee r eplicate anal yses ( n = 3) Ru n Space type Centr al com
posite design (CCD) matr
ix wit h 5 le vels and 3 f act ors Flo w r ate (mL min −1) Tem per atur e (°C) % B in MP . (%) b Response-1 R for β-s T a and γ-T a Response-2 t -(α-R T) a Response-3 t -(β-R T) a
Response-4 Peak symme
try -(β-T) a Exper iment al c Pr edicted c Exper iment al cPr edicted c Exper iment al cPr edicted c Exper iment al cPr edicted c 1 Fact or ial − 1 (0.3) − 1 (5) − 1 (16) 1.05 ± 0.002 1.05 ± 0.002 47.02 ± 0.03 48.60 ± 0.03 46.47 ± 0.04 47.96 ± 0.04 0.87 ± 0.001 0.85 ± 0.001 2 Fact or ial 1 (0.7) − 1 (5) − 1 (16) 1.57 ± 0.004 1.61 ± 0.004 37.17 ± 0.02 37.04 ± 0.02 36.41 ± 0.03 36.14 ± 0.03 0.92 ± 0.002 0.90 ± 0.002 3 Fact or ial − 1 (0.3) 1 (15) − 1 (16) 0.85 ± 0.001 0.83 ± 0.001 46.44 ± 0.01 47.93 ± 0.01 45.89 ± 0.03 47.21 ± 0.03 0.78 ± 0.002 0.78 ± 0.002 4 Fact or ial 1 (0.7) 1 (15) − 1 (16) 1.34 ± 0.002 1.37 ± 0.002 36.18 ± 0.02 35.96 ± 0.02 35.13 ± 0.02 34.68 ± 0.02 0.91 ± 0.003 0.91 ± 0.003 5 Fact or ial − 1 (0.3) − 1 (5) 1 (44) 1.79 ± 0.003 1.74 ± 0.003 43.78 ± 0.02 44.92 ± 0.02 41.82 ± 0.04 43.12 ± 0.04 0.89 ± 0.004 0.87 ± 0.004 6 Fact or ial 1 (0.7) − 1 (5) 1 (44) 1.42 ± 0.002 1.42 ± 0.002 25.12 ± 0.03 24.55 ± 0.03 23.57 ± 0.02 23.11 ± 0.02 0.89 ± 0.002 0.87 ± 0.002 7 Fact or ial − 1 (0.3) 1 (15) 1 (44) 1.35 ± 0.004 1.30 ± 0.004 41.85 ± 0.03 42.90 ± 0.03 39.70 ± 0.02 40.83 ± 0.02 0.93 ± 0.003 0.93 ± 0.003 8 Fact or ial 1 (0.7) 1 (15) 1 (44) 1.13 ± 0.003 1.12 ± 0.003 23.45 ± 0.01 22.78 ± 0.01 22.03 ± 0.01 21.39 ± 0.01 0.91 ± 0.003 0.91 ± 0.003 9 Center 0 (0.5) 0 (10) 0 (30) 1.53 ± 0.002 1.54 ± 0.002 37.94 ± 0.02 37.98 ± 0.02 36.50 ± 0.02 36.54 ± 0.02 0.89 ± 0.002 0.89 ± 0.002 10 Axial − 1.68 (0.164) 0 (10) 0 (30) 1.12 ± 0.003 1.18 ± 0.003 60.91 ± 0.04 58.23 ± 0.04 59.09 ± 0.03 56.38 ± 0.03 0.81 ± 0.003 0.81 ± 0.003 11 Axial 1.68 (0.836) 0 (10) 0 (30) 1.47 ± 0.003 1.43 ± 0.003 29.96 ± 0.02 31.34 ± 0.02 28.08 ± 0.03 29.58 ± 0.03 0.88 ± 0.003 0.88 ± 0.003 12 Axial 0 (0.5) − 1.68 (1.6) 0 (30) 1.79 ± 0.004 1.79 ± 0.004 39.26 ± 0.03 38.51 ± 0.03 38.10 ± 0.04 37.29 ± 0.04 0.88 ± 0.004 0.88 ± 0.004 13 Axial 0 (0.5) 1.68 (18.4) 0 (30) 1.28 ± 0.002 1.30 ± 0.002 36.73 ± 0.04 36.19 ± 0.04 35.07 ± 0.01 34.67 ± 0.01 0.90 ± 0.003 0.90 ± 0.003 14 Axial 0 (0.5) 0 (10) − 1.68 (6.48) 0.99 ± 0.001 0.95 ± 0.001 40.50 ± 0.03 39.32 ± 0.03 40.13 ± 0.03 39.29 ± 0.03 0.86 ± 0.002 0.86 ± 0.002 15 Axial 0 (0.5) 0 (10) 1.68 (53.52) 1.20 ± 0.003 1.26 ± 0.003 25.01 ± 0.03 24.88 ± 0.03 23.90 ± 0.01 23.53 ± 0.01 0.92 ± 0.002 0.92 ± 0.002 16 Center 0 (0.5) 0 (10) 0 (30) 1.54 ± 0.002 1.54 ± 0.002 37.95 ± 0.02 37.98 ± 0.02 36.51 ± 0.02 36.54 ± 0.02 0.89 ± 0.002 0.89 ± 0.002 17 Center 0 (0.5) 0 (10) 0 (30) 1.53 ± 0.002 1.54 ± 0.002 37.95 ± 0.02 37.98 ± 0.02 36.51 ± 0.01 36.54 ± 0.01 0.89 ± 0.002 0.89 ± 0.002 18 Center 0 (0.5) 0 (10) 0 (30) 1.55 ± 0.003 1.54 ± 0.003 37.95 ± 0.02 37.98 ± 0.02 36.52 ± 0.02 36.54 ± 0.02 0.89 ± 0.001 0.89 ± 0.001 19 Center 0 (0.5) 0 (10) 0 (30) 1.53 ± 0.002 1.54 ± 0.002 38.01 ± 0.03 37.98 ± 0.03 36.51 ± 0.02 36.54 ± 0.02 0.88 ± 0.002 0.89 ± 0.002 20 Center 0 (0.5) 0 (10) 0 (30) 1.56 ± 0.002 1.54 ± 0.002 37.95 ± 0.02 37.98 ± 0.02 36.51 ± 0.01 36.54 ± 0.01 0.89 ± 0.002 0.89 ± 0.002 21 Center 0 (0.5) 0 (10) 0 (30) 1.56 ± 0.002 1.54 ± 0.002 37.95 ± 0.02 37.98 ± 0.02 36.51 ± 0.01 36.54 ± 0.01 0.89 ± 0.001 0.89 ± 0.001 22 Center 0 (0.5) 0 (10) 0 (30) 1.55 ± 0.001 1.54 ± 0.001 37.95 ± 0.02 37.98 ± 0.02 36.51 ± 0.02 36.54 ± 0.02 0.88 ± 0.001 0.89 ± 0.001 23 Center 0 (0.5) 0 (10) 0 (30) 1.53 ± 0.002 1.54 ± 0.002 37.95 ± 0.02 37.98 ± 0.02 36.51 ± 0.01 36.54 ± 0.01 0.88 ± 0.002 0.89 ± 0.002
Table
3
R
esponse models and AN
OV
A tes
t dat
a f
or v
alidating and confir
ming t
he centr
al com
posite design model
Response value − 1; Rs Reg ression model R 2 Adjus ted R 2 P v alue + 1.5416 + 0.0744 × X1 − 0.1482 × X2 + 0.09017 × X3 − 0.0830 × X1 2 + 0.00139 × X2 2 − 0.1551 × X3 2 + 0.0150 × X1 × X2 − 0.1995 × X1 × X3 − 0.0367 × X2 × X3 + 0.02017 × X1 × X2 × X3 0.9849 0.9841 < 0.0001 Var iance sour ce df SS MS Var iance r atio Model 9 1.3086 0.1454 1350.19 (> Fcritical ) a Significant Residual 13 0.0014 0.0001 Lac k of fit 5 0.0003 0.0001 Pur e er ror 8 0.0011 0.0001 To ta l 22 1.3278 Response value − 2; tR -(α-T) Reg ression model R 2 Adjus ted R 2 P v alue + 37.9808–8.0017 × X1 − 0.6904 × X2 − 4.2969 × X3 + 2.4112 × X1 2 − 0.2248 × X2 2 − 2.0832 × X3 2 − 0.0186 × X1 × X2 − 2.1204 × X1 × X3 − 0.2554 × X2 × X3 + 0.0837 × X1 × X2 × X3 0.9859 0.9850 < 0.0001 Var iance sour ce df SS MS Var iance r atio Model 9 1331.1800 147.9089 99627.75 (> Fcritical ) aSignificant Residual 13 0.0193 0.0015 Lac k of fit 5 0.0153 0.0031 Pur e er ror 8 0.0040 0.0005 To ta l 22 1350.4639 Response value − 3; tR -(β-T) Reg ression model R 2 Adjus ted R 2 P v alue + 36.5355–7.9760 × X1 − 0.7782 × X2 − 4.6924 × X3 + 2.2823 × X1 2 − 0.1972 × X2 2 − 1.8162 × X3 2 − 0.0158 × X1 × X2 − 1.8878 × X1 × X3 − 0.2240 × X2 × X3 + 0.1603 × X1 × X2 × X3 0.9859 0.9853 < 0.0001 Var iance sour ce df SS MS Var iance r atio Model 9 1342.0066 149.1118 16262.20 (> Fcritical ) aSignificant Residual 13 0.1192 0.0092 Lac k of fit 5 0.1191 0.0238 Pur e er ror 8 0.0001 0.0238 To ta l 22 1361.1622 Response v alue − 4; peak symme try -(β-T) Reg ression model R 2 Adjus ted R 2 P v alue + 0.8854 + 0.0215 × X1 + 0.0062 × X2 + 0.0175 × X3 − 0.0141 × X1 2 + 0.0029 × X2 2 + 0.0020 × X3 2 + 0.0065 × X1 × X2 − 0.0238 × X1 × X3 + 0.0193 × X2 × X3 − 0.0120 × X1 × X2 × X3 0.9701 0.9204 < 0.0001
level of 0.164 mL min−1 at the middle level of temperature
led to a good Rs value. Figure 2c shows the 3D plot for the
interactive effect of column temperature and % B content in the mobile phase on the Rs value with now flow rate at its center value. A decrease of % B content in the mobile phase from 53.52 to 6.48% or column temperature from 18.4 to 1.6 °C improved the resolution of β-/γ-tocol. The quality of the fitted model was also statistically checked by the ND graph (Fig. 2d).
The interactive effects of the experimental variables, illustrated by 3D response surface plots, on tR-(α-T), tR
-(β-T), tR-(γ-T), and, tR and peak symmetries of β-T and γ-T response values are also presented in Supplementary Fig. 2–6.
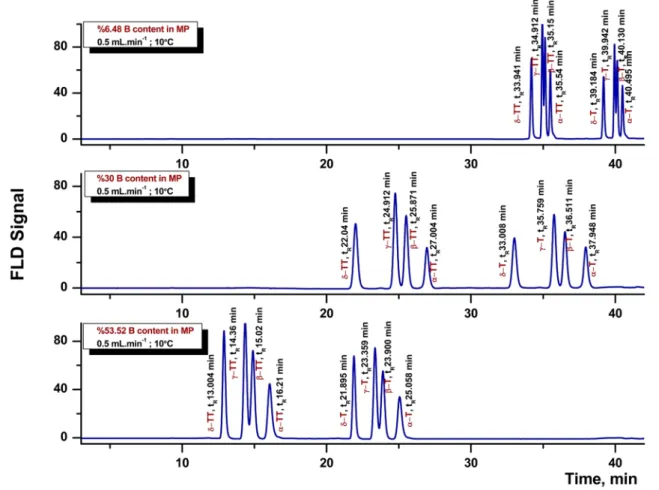
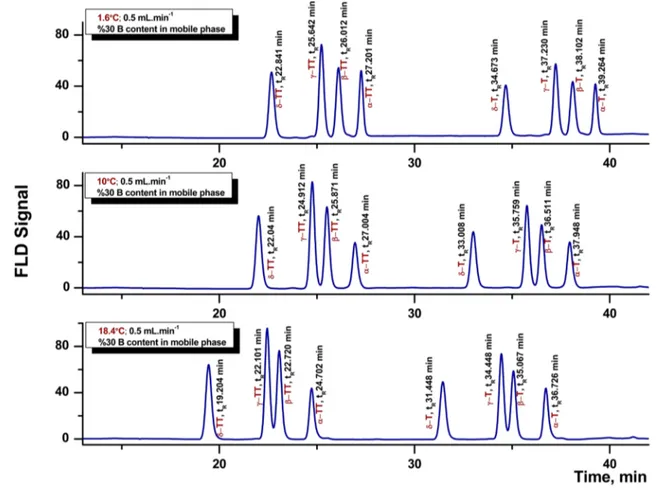
The results of response surface analysis were in good agreement with the ANOVA (see Table 3 and Supplemen-tary table 2), which demonstrated that the quadratic and lin-ear effects of the three factors were significant (P < 0.0001). These results indicate that the selected experimental vari-ables were the major factors affecting the response values at the level of P < 0.0001. The effects of % B and of column temperature on the separation performance were also experi-mentally validated. The results of this study are presented in Figs. 3 and 4, respectively. Figure 3 shows the chromato-graphic separation of a standard mixture, consisting of eight homologues obtained by using the lowest (6.48%), middle (30%) and highest (53.52%) % B levels. As can be seen from Fig. 3, an increase of % B in the mobile phase improved the separation of the co-eluting β-/γ-tocols peaks markedly. Fig-ure 4 shows the separations of a standard mixture of tocols obtained at the lowest (1.6 °C), middle (10 °C) and high-est (18.4 °C) column temperatures thigh-ested. As presented in Fig. 4, a decrease of column temperature led to an improved separation for the close-eluting β-/γ-tocol peaks.
Chromatographic method optimization studies aim at discovering the optimum method parameters and the desired separations in the shortest time possible [39]. To calculate the (coded) optimum points from the experimen-tal model, the fractional derivatives of this model were set to zero, and by performing the matrix functions for all response values the optimum values were calculated (see Table 4 and Supplementary table 3). This resulted in the following set of coded optimal conditions; X1 (flow
rate) = − 0.95, X2 (column temperature) = − 0.26 and X3 (% B content in mobile phase) = + 058 for Rs; X1 = + 0.34,
X2 = − 1.42, and X3 = − 0.21 for tR-(α-T); X1 = + 0.12, X2 = − 1.30, and X3 = − 0.13 for tR-(β-T); X1 = + 0.53, X2 = − 1.73, and X3 = − 0.41 for peak symmetry-(β-T). Next, these coded values were converted into actual experimen-tal values; X1 = 0.31 mL min−1, X2 (temperature) = 8.70 °C,
and X3 (% B content in mobile phase) = 38.12% for Rs; X1 = 0.57 mL min−1, X 2 = 2.90 °C, and X3 = 27.06% for tR -(α-T); X1 = 0.52 mL min−1, X 2 = 3.50 °C, and X3 = 28.18% for Table 3 (continued) Var iance sour ce df SS MS Var iance r atio Model 9 0.0233 0.0026 67.42 (> Fcritical ) a Significant Residual 13 0.0005 0.0000 Lac k of fit 5 0.0005 0.0001 Pur e er ror 8 0.0000 0.0000 To ta l 22 0.0285 df deg ree of fr eedom, SS sum of sq uar es, MS mean sq uar es, T t ocopher ol a df 1 /df2 = 9/13 t he v alue of Fcritical =2.71
tR-(β-T); X1 = 0.61 mL min−1, X2 = 1.35 °C, and X3 = 24.26%
for peak symmetry-(β-T) response value (Table 4). These observations can be explained by the fact that at low column temperature interaction of the analytes with the stationary phase is stronger, and thus there is a greater chance for the separation of the β- and γ-T isomers. The second important finding is about the optimum that occurs for the flow rate. Most likely this reflects the optimum of the Van Deemter curve [40]. The occurrence of the optimal in the % B content in mobile phase reflects the subtle balance between mobile phase solubility and stationary phase interaction. The fact that such an optimum can occur is well known, but locating the exact optimum % B value can only be done experimentally.
Summarizing the overall results of the optimiza-tion study, the optimum performance in terms of Rs was
obtained at a flow rate of 0.31 mL min−1, a column
temper-ature of 8.70 °C, and a % B content (MTBE: MeOH: H2O,
80:18:2, v/v/v) in the mobile phase of 38.12%. The fast-est separations, at an acceptable resolution, were obtained using the following gradient program of solvents A and B: 0–5.5 min 0% B, 5.5–10 min 0–38.12% B, 10–21 min 38.12% B, 21–31 min 38.12–55% B, 31–33 min 55–80% B, 33–36 min 80% B, 36–38 min 80–0% B, 38–40 min 0% B. Other response values were also in good agreement with Rs
response value, in terms of optimum performance for β-/γ-tocol separations (see Table 4). The other important opti-mum coded values for γ-tocol isomer analysis were also detected and converted into actual experimental values;
X1 = 0.35 mL min−1, X
2 = 0.40 °C, and X3 = 10.26% for tR
-(γ-T); X1 = 0.71 mL min−1, X2 = 2.90 °C, and X3 = 16.42%
for peak symmetry-(γ-T) response values (Supplementary table 3). These conditions are similar to optimal values for the analysis of the α- and β-T isomers.
Method Validation and Analysis of Real Samples
The optimum method was validated by examining some basic statistical parameters such as linearity, accuracy, pre-cision, and sensitivity. The performance of the method for these parameters are summarized in Table 5. The data in this table clearly indicate the method to be accurate, sensi-tive, and rapid for the determination of tocol isomers in real edible oil samples. Full resolution of the target peaks was obtained in 45 min.
The linearity of the proposed method was assessed from the calibration curves obtained at eight concentration lev-els for each tocol isomer. Calibration curves were plotted by designing the peak areas versus the concentration of the standards using linear least squares regression. The correla-tion coefficient (R2) calculated from the calibration curves of
standard solutions were higher than 0.9995. The accuracy of the proposed method was evaluated and ranged from 93.00 to 99.19%. The precision data obtained from at least three repeated analyses is presented in terms of the relative stand-ard deviation (RSD %) in Table 5. The RSD % for tocols was calculated to be between 0.31 and 1.39%. The sensitivity of the proposed method, expressed in the LOD and LOQ values, is also given in Table 5. LOD and LOQ values, cal-culated as the concentration corresponding to 3.3 and 10 times the ratio of standard deviation to slope value, ranged from 0.84 to 1.87 (LOD) and from 2.48 to 5.67 (LOQ), cor-respondingly (Table 5).
The contents of individual tocol homologues in 15 cold pressed edible oils from different botanic origins are pre-sented in Supplementary table 4. As can be seen from this table the total tocol content ranged from less than 15 to
Fig. 2 RSM graphs for the optimization of chromatographic
separa-tions in terms of Rs response values for β-T and γ-T, estimated from
the CCD by plotting of: a mobile phase content versus flow rate, b
flow rate versus temperature, c temperature versus mobile phase con-tent, d normal probability of internally studentized residuals
almost 2600 mg kg−1 oil. This range is significantly wider
than given in the Food Chemical Codex, and similar to data from literature [41]. The major types of tocols detected in all analyzed samples were α-T, α-TT, β-T, γ-T, and δ-T. The highest total tocol content was observed for wheat germ oil sample, with the following amounts of individual isomers 1894.44 ± 2.36 mg kg−1 (α-T), 582.34 ± 1.15 mg kg−1 (β-T),
4.63 ± 0.01 mg kg−1 (δ-T), 24.74 ± 0.05 mg kg−1 (α-TT),
81.17 ± 1.04 mg kg−1 (β-TT) and 2.74 ± 0.02 mg kg−1
(δ-T). Coriander seed oil also exhibited a high amount of tocols (1313.5 mg kg−1). Here the main homologues
were β-T (675.07 ± 1.33 mg kg−1), followed by δ-T
(346.28 ± 1.24 mg kg−1) and γ-T (163.29 ± 1.13 mg kg−1).
Cold pressed wheat germ oil was found to be by far the best source of α-T, followed by safflower (893.51 ± 2.25 mg kg−1)
and grape seed oils (275.04 ± 1.11 mg kg−1). β-T occurred
in the highest concentrations in walnut, wheat germ, flax-seed, pumpkin flax-seed, coriander flax-seed, fig flax-seed, and nettle seed oil. Sesame, poppy seed, hemp seed and pomegran-ate seed oils were established to be the excellent source of γ-T. Black cumin seed oil contained the highest levels of tocotrienols, with levels of 98.43 ± 1.04 mg kg−1 α-TT,
304.21 ± 1.13 mg kg−1 β-TT, and 17.61 ± 0.03 mg kg−1 γ-TT
respectively. Walnut, fig seed and nettle seed oils were also characterized by particularly high levels of total tocotrie-nols. Black cumin seed oil contained a high level of α-TT (98.43 ± 1.04 mg kg−1). β-TT and γ-TT were found at high
levels in black cumin seed (304.21 ± 1.13 mg kg−1) and
walnut oils (114.13 ± 1.17 mg kg−1), respectively. Nettle
and fig seed oils were found to be rich in δ-TT at levels of 105.88 ± 1.21 and 106.14 ± 1.35 mg kg−1, respectively.
The lowest total-tocol content was found in the coconut oil sample (14.85 mg kg−1). The amount of individual
homo-logues in coconut oil was as follows; 4.54 ± 0.01 mg kg−1
(α-T), 2.14 ± 0.02 mg kg−1 (β-T), 2.86 ± 0.01 mg kg−1 (γ-T),
4.22 ± 0.01 mg kg−1 (α-TT), and 1.09 ± 0.01 mg kg−1 (γ-T).
Conclusion
Using a chemometrics-assisted route for method develop-ment, an analytical method was successfully developed that allowed the separation of all individual tocol homologues, including the difficult to separate peaks of β- and γ-tocols, in a C30 reversed-phase LC system. The effects of three experi-mental factors [mobile phase flow rate, column temperature,
and % B content in mobile phase (MTBE:MeOH:H2O,
80:18:2, v/v/v)] on the chromatographic performance param-eters [Rs, tR and peak symmetries of β-T and γ-T] were sys-tematically evaluated using CCD and RSM. The empirical second-order polynomial models were highly significant at F values of 98.85 for Rs, 99.71 for tR-(α-T), 101.20 for tR-(β-T)
and 6.51 for peak symmetry-(β-T) responses (P < 0.0001). Moreover, the calculated adjusted coefficients were well within the acceptable limits of R2 ≥ 0.80 for the response
values with values of 0.9841, 0.9850, 0.9853 0.9665, and 0.9204, respectively. This result reveals that the proposed
CCD model is significant and adequate for describing the selected responses at varying experimental conditions. The best separation performance in terms of peak resolu-tion between β-T and γ-T was achieved at a flow rate of 0.31 mL min−1 flow rate, 8.70 °C column temperature, and
a linear gradient elution system with 38.12% B in the mobile phase, using the following gradient program of solvents A and B: 0–5.5 min 0% B, 5.5–10 min 0–38.12% B, 10–21 min 38.12% B, 21–31 min 38.12–55% B, 31–33 min 55–80% B, 33–36 min 80% B, 36–38 min 80–0% B, 38–40 min 0% B. At these optimum resolution conditions the total analysis
Fig. 4 Chromatograms for the tocol standard mixture separation by using different column temperatures
Table 4 Optimum coded and actual values of the proposed method
a Solvent B: methyl tert-butyl ether: methanol: water, 80:18:2, v/v/v
Factors Optimum coded and actual values of the proposed method for response values
Response-1
Rs for β-T and γ-T Response-2tR-(α-T) Response-3tR-(β-T) Response-4Peak symmetry-(β-T)
Coded Actual Coded Actual Coded Actual Coded Actual
Flow rate (mL min−1), X
1 − 0.95 0.31 mL min−1 + 0.34 0.57 mL min−1 + 0.12 0.52 mL min−1 + 0.53 0.61 mL min−1
Temperature (°C), X2 − 0.26 8.70 °C − 1.42 2.90 °C − 1.30 3.50 °C − 1.73 1.35 °C
% B in mobile phase (%)a, X
time was 40 min. The optimized method was successfully applied to the simultaneous determination of all T and TT homologues in cold pressed oil samples.
Acknowledgements This article is supported financially by the Scien-tific Research Project Center of Karamanoglu Mehmetbey University (Project number 18-M-17). The authors would also like to thank the Scientific and Technological Research Council of Turkey (TUBITAK) under the 2219 Research Fellowship Program for International Post-doctoral stays for providing the financial scholarship support to carry out this research work.
Compliance with Ethical Standards
Conflict of interest One author, Hans-Gerd Janssen, is employed by
Unilever, a major user of edible oils and edible oil ingredients. No other conflicts of interest are declared.
References
1. Lampi AM, Nurmi T, Piironen V (2010) Effects of the environ-ment and genotype on tocopherols and tocotrienols in wheat in the HEALTHGRAIN diversity screen. J Agric Food Chem 58:9306–9313
2. Wang X, Song YE, Li JY (2013) High expression of tocochro-manol biosynthesis genes increases the vitamin e level in a new line of giant embryo rice. J Agric Food Chem 61:5860–5869 3. Franke AA, Murphy SP, Lacey R, Custer LJ (2007) Tocopherol
and tocotrienol levels of foods consumed in Hawaii. J Agric Food Chem 55:769–778
4. Cunha SC, Amaral JS, Fernandes JO, Oliveira MBP (2006) Quan-tification of tocopherols and tocotrienols in portuguese olive oils using HPLC with three different detection systems. J Agric Food Chem 54:3351–3356
5. Aggarwal BB, Sundaram C, Prasad S, Kannappan R (2010) Tocot-rienols, the vitamin E of the 21st century: its potential against can-cer and other chronic diseases. Biochem Pharmacol 80:1613–1631 6. Hunter SC, Cahoon EB (2007) Enhancing vitamin E in oil-seeds: unraveling tocopherol and tocotrienol biosynthesis. Lipids 42:97–108
7. Ng LT, Huang SH, Chen YT, Su CH (2013) Changes of toco-pherols, tocotrienols, γ-oryzanol, and γ-aminobutyric acid levels in the germinated brown rice of pigmented and nonpigmented cultivars. J Agric Food Chem 61:12604–12611
8. Inoue T, Tatemori S, Muranaka N et al (2012) The identifica-tion of vitamin E homologues in medicinal plant samples using ESI(+)–LC–MS3. J Agric Food Chem 60:9581–9588
9. Saini RK, Keum Y-S (2016) Tocopherols and tocotrienols in plants and their products: a review on methods of extraction, chromatographic separation, and detection. Food Res Int 82:59–70 10. Jiang Q (2014) Natural forms of vitamin E: Metabolism, anti-oxidant, and anti-inflammatory activities and their role in disease prevention and therapy. Free Radic Biol Med 72:76–90
11. Strohschein S, Pursch M, Lubda D, Albert K (1998) Shape selectivity of C30 phases for RP-HPLC separation of tocopherol isomers and correlation with MAS NMR data from suspended stationary phases. Anal Chem 70:13–18
12. Gentili A, Caretti F, Bellante S et al (2013) Comprehensive profil-ing of carotenoids and fat-soluble vitamins in milk from different animal species by LC–DAD–MS/MS hyphenation. J Agric Food Chem 61:1628–1639
13. Irakli MN, Samanidou VF, Papadoyannis IN (2012) Optimiza-tion and validaOptimiza-tion of the reversed-phase high-performance liquid chromatography with fluorescence detection method for the sepa-ration of tocopherol and tocotrienol isomers in cereals, employing a novel sorbent material. J Agric Food Chem 60:2076–2082 14. Tsochatzis ED, Tzimou-Tsitouridou R (2015) Validated RP-HPLC
method for simultaneous determination of tocopherols and tocot-rienols in whole grain barley using matrix solid-phase dispersion. Food Anal Methods 8:392–400
15. Panfılı G, Fratıannı A, Irano M (2003) Normal phase high-per-formance liquid chromatography method for the determination of tocopherols and tocotrienols in cereals. J Agric Food Chem 51:3940–3944
16. Kamal-Eldin A, Görgen S, Pettersson J, Lampi A-M (2000) Nor-mal-phase high-performance liquid chromatography of tocophe-rols and tocotrienols. J Chromatogr A 881:217–227
17. Gruszka J, Kruk J (2007) RP-LC for determination of plas-tochromanol, tocotrienols and tocopherols in plant oils. Chroma-tographia 66:909–9013
18. Franke AA, Morrison CM, Custer LJ et al (2013) Simultaneous analysis of circulating vitamin D3, 25-hydroxy-vitamin D2, retinol, tocopherols, carotenoids, and oxidized and reduced coenzyme Q10 by high performance liquid
Table 5 Working range and calibration equations of the tocol isomers (n = 5) and performance characteristics of the proposed method
T tocopherol, TT tocotrienol, tR retention time, R correlation coefficient, RSD relative standard deviation, SD standard deviation, LOD limit of
detection, LOQ limit of quantification
Tocol isomers tR ± SD (min) Range (mg kg−1) Standard linearity Sensitivity
Calibration RSD (%) Accuracy
Equation R2 Recovery (%) LOD (mg kg−1) LOQ (mg kg−1)
δ-TT 28.97 ± 0.08 0–100 y = 4.5836x − 0.3844 0.9996 0.81 99.19 0.82 2.48 γ-TT 30.36 ± 0.07 0–100 y = 13.7660x − 1.4802 0.9997 0.58 97.91 0.86 2.61 β-TT 31.92 ± 0.08 0–100 y = 11.458x − 2.0042 0.9998 0.46 97.30 0.84 2.55 α-TT 34.92 ± 0.10 0–100 y = 4.6084x − 1.3446 0.9996 1.39 93.00 1.29 3.92 δ-T 39.05 ± 0.11 0–100 y = 4.5946x − 0.3615 0.9995 0.62 98.14 1.43 4.35 γ-T 41.10 ± 0.09 0–500 y = 13.7790x − 1.5266 0.9999 0.31 98.10 1.36 4.13 β-T 42.89 ± 0.05 0–500 y = 11.4340x − 0.7020 0.9999 0.39 98.28 1.68 5.08 α-T 44.67 ± 0.05 0–1000 y = 4.5814x − 0.7456 0.9999 1.25 97.52 1.87 5.67
chromatography with photo diode-array detection using C18 and C30 column. J Chromatogr A 1301:1–9
19. Emenhiser C, Sander LC, Schwartz SJ (1995) Capability of a polymeric C30 stationary phase to resolve cis-trans carotenoid isomers in reversed-phase liquid chromatography. J Chromatogr A 707:205–216
20. Gundersen TE, Blomhoff R (2001) Qualitative and quantitative liquid chromatographic determination of natural retinoids in bio-logical samples. J Chromatogr A 935:13–43
21. Shammugasamy B, Ramakrishnan Y, Manan F, Muhammad K (2015) Rapid reversed-phase chromatographic method for deter-mination of eight vitamin E isomers and γ-oryzanols in rice bran and rice bran oil. Food Anal Methods 8:649–655
22. Henry CW, Fortier CA, Warner IM (2001) Separation of tocoph-erol isomers using capillary electrochromatography: comparison of monomeric and polymeric C30 stationary phases. Anal Chem 73:6077–6082
23. Duan Q, Liu C, Liu Z et al (2014) Preparation and evaluation of a novel monolithic column containing double octadecyl chains for reverse-phase micro high performance liquid chromatography. J Chromatogr A 1345:174–181
24. Lerma MJ, Herrero-Martínez JM, Simó-Alfonso EF, Ramis-Ramos G (2007) Determination of tocopherols in vegetable oils by CEC using methacrylate ester-based monolithic columns. Elec-trophoresis 28:4128–4135
25. Abidi SL and MTL (1997) Reversed-phase high-performance liq-uid chromatographic separations of tocopherols. J Chromatogr 782:25–32
26. Grebenstein N, Frank J (2012) Rapid baseline-separation of all eight tocopherols and tocotrienols by reversed-phase liquid-chromatography with a solid-core pentafluorophenyl column and their sensitive quantification in plasma and liver. J Chromatogr A 1243:39–46
27. Stöggl W, Huck C, Wongyai S et al (2005) Simultaneous determi-nation of carotenoids, tocopherols, and γ-oryzanol in crude rice bran oil by liquid chromatography coupled to diode array and mass spectrometric detection employing silica C30 stationary phases. J Sep Sci 28:1712–1718
28. Sen S, Mondal U, Singh G (2016) Dual optimization in phase transfer catalyzed synthesis of dibenzyl sulfide using response surface methodology. Org Process Res Dev 20:1765–1773 29. Islam MA, Sakkas V, Albanis TA (2009) Application of statistical
design of experiment with desirability function for the removal of organophosphorus pesticide from aqueous solution by low-cost material. J Hazard Mater 170:230–238
30. Arslan FN, Kara H (2016) Fully automated three-dimensional column-switching SPE–FIA–HPLC system for the characteriza-tion of lipids by a single injeccharacteriza-tion: part I. Instrumental design and chemometric approach to assess the effect of experimental settings on the response of ELSD. J Am Oil Chem Soc 93:11–26 31. Sujoy Bose C, Das (2014) Role of binder and preparation pressure
in tubular ceramic membrane processing: design and optimization study using response surface methodology (RSM) role of binder and preparation pressure in tubular ceramic membrane processing : design and optimization. Ind Eng Chem Res 53:12319–12329 32. Arslan FN, Kara H (2017) Central composite design and response
surface methodology for the optimization of—Ag+—HPLC/
ELSD method for triglyceride profiling. J Food Meas Charact 11:902–912
33. Knecht K, Sandfuchs K, Kulling SE, Bunzel D (2015) Tocopherol and tocotrienol analysis in raw and cooked vegetables: a vali-dated method with emphasis on sample preparation. Food Chem 169:20–27
34. Brereton RG (1997) Multilevel multifactor designs for multivari-ate calibration. Analyst 122:1521–1529
35. Kamal-eldin A, Andersson R (1997) A multivariate study of the correlation between tocopherol content and fatty acid composition in vegetable oils. J Am Oil Chem Soc 74:375–380
36. Bezerra MA, Santelli RE, Oliveira EP et al (2008) Response sur-face methodology (RSM) as a tool for optimization in analytical chemistry. Talanta 76:965–977
37. Vildozo D, Ferronato C, Sleiman M, Chovelon JM (2010) Pho-tocatalytic treatment of indoor air: optimization of 2-propanol removal using a response surface methodology (RSM). Appl Catal B Environ 94:303–310
38. Lundstedt T, Seifert E, Abramo L et al (1998) Experimental design and optimization. Chemom Intell Lab Syst 42:3–40 39. Li X, Xu X, Albano DR, You T (2011) Optimization using central
composite design for antihistamines separation by nonaqueous capillary electrophoresis with electrochemical and electrochemi-luminescence detections. Analyst 136:5294
40. Gritti F, Guiochon G (2013) The van Deemter equation: assump-tions, limits, and adjustment to modern high performance liquid chromatography. J Chromatogr A 1302:1–13
41. Codex Alimentarius Commission (2001) Joint FAO/WHO Food Standards Programme Codex Committee on food additives and contaminants. Food and Agriculture Organization of the United Nations, World Health Organization, London