ANALYSIS OF POTENTIAL GAIN FROM USING HYBRID VEHICLES IN
PUBLIC TRANSPORTATION
İre m D Ü Z D A R 1 a n d Ö za y Ö Z A Y D IN 2
Abstract: In the last two decades, the pollution in major cities was a growing concern. A significantly large contribution was made by road transportation sources to this problem. E U regulations on emissions and improvements in fu e l quality sustained an improvement in air quality through reduction in pollutants. Latest trend taking the environmental issues into consideration in consumer car industry is hybrid vehicles, which use a conventional inner combustion engine using petroleum or diesel fuel, alongside with an electric engine, selectively using the necessary one depending on the current speed and pow er needs. As the vehicles equipped with this technology create less emission and consume less fuel, investigation o f the potential gain when used public transportation is inevitable. In this study, a comparison-based study will be done between traditional busses using fo ssil fu e l and new technology busses that the Istanbul M unicipality selected as candidate fleet, utilizing energy, finance, environment and social responsibility aspects.
Keywords: Public transportation, H ybrid vehicles, Environment
I. IN T R O D U C T I O N
Public transport, public transportation, public transit or mass transits are transport systems that transport members o f the general public, usually charging set fares. The terms generally taken to include rail and bus services, and wider definitions m ight include scheduled airline services, ferries, and taxicab services. A restriction sometimes applied is that transit should occur in continuously shared vehicles, which would exclude taxis that are not shared-ride taxis.
Public transport may be regulated as a common carrier and usually provides scheduled service on fixed routes on a non-reservation basis, although share taxis provide an ad-hoc form o f flexible public transport and demand responsive transport provides a pre-bookable form o f public shared transport. Taxicabs and other vehicles for hire are generally fully flexible.
The majority o f transit passengers are traveling within a local area or region between their homes and places o f employment, shopping, or schools.
I I . E F F E C T S O F P T O N E N V IR O N M E N T
The people moves from one place to another all their lives for various reasons. The distance moved is getting bigger as the cities growing. And they have to use vehicles to reach their destinations. In the developed countries well educated people use the public transportation vehicles. Public transportation has many o f the advantages. It is more economical for the people, for the country and for the environment. It yields less noise, less pollution, less heat emission for the atmosphere, less money for fuel and vehicle, less area for roads and parking. [1]
I I I . N E X T S T E P : H Y B R ID V E H I C L E S
W h y w o u ld a n y o n e b u y a h y b r id e le c tric v e h ic le (H E V )?
First mass introduction to markets happened in 1999, and was a radical change in motor vehicle technology. Currently available HEV models achieve fuel economy increases o f 10-40% [2]. compared to similar-sized vehicles, with commensurate reductions in greenhouse gas emissions. Some o f H EV s’ benefits are collective. Millions o f people buying less-polluting and more fuel-economical cars can produce cleaner air and reduce risk o f climate change, but no single HEV buyer can have much impact on these problems.
1 İrem Düzdar, Haliç University, Faculty of Engineering, Industrial Engineering Department, Bomonti, Istanbul, Turkey,
Further, the private benefits o f HEVs are unclear; reduced expenditures on fuel are routinely shown to be lass than the vehicle purchase price premium o f the hybrid vehicle over an assumed non-hybrid alternative. If private benefits are illusory and if collective benefits are not achievable by individual customers, why would anyone buy an HEV? Hopes that HEVs (or any new technology that promises collective benefits) can be successfully mass-marketed depend on answers to such a question [4].
A n a n s w e r
HEV not only provides its owner with transportation, but also provides symbolic meanings that owners can incorporate into better stories about themselves [3]. The symbolic meanings associated with HEVs are multiple and multi-layered, including widely recognized ideas like preserving the environment, opposing war, saving money, reducing support for oil producers, and owning the latest technology. But these denotations are linked to more personal connotations, such as concern for others, ethics, maturity, national independence, or individuality [4].
IV . H Y B R ID V E H I C L E S A S A P U B L IC T R A N S P O R T A T IO N T O O L
Hybrid-electric buses are being developed to answer specific challenges faced by today's public transport operators, range, fuel economy, emissions, and safety. Today's conventional buses still exhibit relatively poor fuel economy and moderately high emission levels while today's battery-electric buses cannot handle the demands o f most transit duty cycles, specifically with respect to vehicle range. Hybrid buses are being developed in response to these challenges. Many hybrid-electric vehicles have evolved over time from initial work in the electric bus arena with assistance from both government and private programs [1]. Additionally, many urban areas where transit buses operate experience air quality problems that are also driving the decision to adopt alternative technologies. These include both alternative fueled traditional buses and hybrid buses.
A hybrid vehicle can be set up as a parallel configuration, where both the electric motor and the mechanical engine can drive the wheels, or as a series configuration, where only the electric motor drives the wheels. Different advantages and tradeoffs exist for each combination o f components (Table 1 and Table 2)
TABLE 1 - S E R [ES HYBRID [1]
Benefits Trade-offs
Fuel cell compatible Greater energy losses as more energy passes
through the energy storage device than in parallel hybrid
Reduced emissions - engine rarely idles and tends to operate in a narrow peak efficiency band
Maximum power at high speeds may only be available with both the APU and energy storage device operating
Improved low speed acceleration - all the power is routed through the electric motor providing high torque at low speeds
Lower steady state efficiency as generator is required to convert engine energy to electric energy and back again into mechanical energy Numerous component layout options, simpler
packaging
Increased weight - smaller APU will increase reliance on batteries and may require more batteries (weight) and may shorten battery life
M ost o f the countries now import more than h alf o f the oil it consumes annually. The trade imbalance created by oil imports poses a m ajor threat to the nation's economy should foreign sources o f fuel become disrupted. Governments have directed federal agencies to develop programs to reduce the nation's consumption o f imported fuels. One o f the primary strategies has been to support the development o f advanced vehicle technologies, like hybrid-electric, that reduce fossil fuel consumption overall and can utilize domestically produced fuels such as natural gas.
TABLE 2 - SER][ES HYBRID [1]
Benefits Trade-offs
More overall power - both engine and motor can supply power simultaneously
Generator rotor must spin when using energy from engine, adding more mass and rotating inertia
Reduced weight - smaller energy storage capacity possible compared to series hybrid
Less capable of capturing all available regenerative braking energy
Greater energy efficiency during steady state operation - not all energy must go through generator and electric motor as with series hybrid
Not fuel cell compatible
Greater battery life as batteries are used primarily for regenerative braking and acceleration assist, not for primary acceleration
A diesel engine is currently the most efficient power supply available to the transit industry. In a conventional bus, current diesel engines are about as efficient (~30% overall) as they can get, although direct fuel injection will be used in the future to force some small efficiency gains and emission reductions. The reason this increase is expected to be small for conventional buses is that engine efficiency is dominated by the operating cycle and excessive idle time and not necessarily by the peak efficiency o f the engine. In a hybrid-electric vehicle, however, the engine is not coupled mechanically to the wheels and can be operated more efficiently or, in some cases, turned o ff completely.
In slow urban drive cycles, nearly 50% o f the energy expended by the vehicle is utilized for acceleration while the remaining energy goes to auxiliary systems and road load. If all the kinetic energy could be captured it would potentially double current transit bus fuel economy? Real world system limitations usually result in a maximum capture o f about 50% o f the available kinetic energy during regenerative braking. By recapturing 50% o f the total kinetic energy (25% o f the total expended energy), fuel economy is increased by 33%. [5]
The European Commission (2001) states in their White paper (European transport policy for 2010), that logistics can contribute to one o f the objectives through: reducing the environmental impact o f transport (e.g. improved vehicle utilization).
Two general approaches for reducing the environmental impact can be identified. The first is to rely on new, more energy efficient technology, which for public transport has proven to be insufficient. The second is to rely on companies to restructure their processes. In the public transport literature (the micro perspective) two methods to reduce the environmental impact are to either introduce more energy efficient technology, or to organize in a different way. However, it is not enough to introduce new technology to stop the development, e.g. more energy efficient engines. There is a need for larger structural changes in public transport.
A hybrid-electric bus is defined as carrying at least two sources o f energy on board the vehicle, with an electric drive to provide partial or complete drive power to the vehicle's wheels. In most cases the two sources o f energy will be an electrical energy storage device and an APU (auxiliary power unit). In a conventional bus, the diesel engine generates power that is mechanically transferred to the wheels through the transmission and differential. In a hybrid-electric drive bus, the engine produces electricity and may not be coupled to the wheels. Power is electrically transmitted to the wheels by a combination o f the engine generator set and traction batteries. Although simple, the components o f an electric drive system may only be well understood by transit agencies that operate electric trains or trolley buses.
O w ning Costs
Here we will try to provide an understanding o f the cost factors involved with owning and operating hybrid electric drive buses. Since the technology is new it is impossible to use hard numbers on the cost to own and
operate these buses. Recent buyers have paid between 840.000 and 440.000 USD/bus. But in 1999 New York City Transit paid 385.000 USD/bus for 125 hybrid buses.
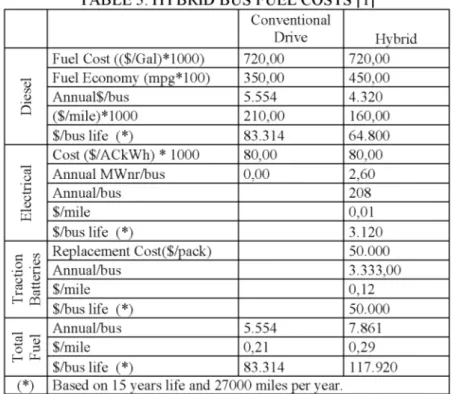
Fuel
By definition H E V ’s consumes at least two different fuels, and these different fuels costs must be considered to estimate the operating costs. One is diesel or natural gas, and the other is lead acid batteries.
TABLE 3. HYBRID BUS FUEL COSTS [11 Conventional Drive Hybrid D ie se l
Fuel Cost (($/Gal)*1000) 720,00 720,00
Fuel Economy (mpg*100) 350,00 450,00 Annual$/bus 5.554 4.320 ($/mile)*1000 210,00 160,00 $/bus life (*) 83.314 64.800 El ec tr ic al Cost ($/ACkWh) * 1000 80,00 80,00 Annual MWnr/bus 0,00 2,60 Annual/bus 208 $/mile 0,01 $/bus life (*) 3.120 T rac ti on B att eri es Replacement Cost($/pack) 50.000 Annual/bus 3.333,00 $/mile 0,12 $/bus life (*) 50.000 T o ta l Fu el Annual/bus$/mile 5.5540,21 7.8610,29 $/bus life (*) 83.314 117.920
C*) Based on 15 years life and 27000 miles per year.
1 4 0 . 0 0 0 1 2 0 . 0 0 0 1 0 0 . 0 0 0 8 0 . 0 0 0 6 0 . 0 0 0 4 0 . 0 0 0 2 0 . 0 0 0 0 $ Cost Components C o n v e n t i o n a l D r i v e ■ H ybr id
FIGURE 1. COMPARISON OF HYBRID BUS FUEL COSTS
The hybrid-electric drive definition problem is getting more unclear by the fact that the technology takes many forms and different labels to describe them. For instance, there are series and parallel hybrids, engine-dominant and battery-dominant hybrids, charge-sustaining and charge-depleting hybrids and dual mode hybrids. All o f these are currently under development and/or deployment and each has its advantages. Many perceived advantages are actually a function o f the electric drive, which results in more available torque at low speed, smoother acceleration, and efficient regenerative braking. In either parallel or series
configurations the short-term benefit is increased efficiency due to the capture o f kinetic energy through regenerative braking.
Hybrid-electric drive systems on transit buses are being aggressively investigated as a means o f improving fuel economy, reducing emissions, and lowering maintenance and operating expenses. Several m ajor federally funded research and development projects are testing the viability o f these drive systems on buses. W ith the rapid pace o f development and improvement o f hybrid-electric drive technology, more transit agencies are being asked to evaluate the potential for hybrid-electric drive systems in their fleets. It is intended to provide transit managers with a better understanding o f the technology, including benefits, challenges, and life-cycle costs.
In this paper, alternative fuels are considered for their potential to displace the oil is the main and only source o f transport fuel. But we want to analyze only the hybrid electric buses among twelve different alternative fuel buses.
_______________ TABLE 4. AVERAGE VALUES OF W EIGHTS [11_______________
Criterion Manufacture Academic
Institute Research Organization Bus Operator Average Energy Supply 0,0357 0,0314 0,0340 0,0249 0,0313 Energy Efficiency 0,1040 0,0943 0,1020 0,0748 0,0938 Air Pollution 0,1355 0,2090 0,1595 0,1605 0,1661 Noise Pollution 0,0452 0,0697 0,0532 0,0535 0,0554 Industrial Relationship 0,0923 0,0357 0,0480 0,0757 0,0629 Employment Cost 0,0900 0,0680 0,0343 0,1393 0,0829 Maintenance Cost 0,0300 0,0227 0,0114 0,0464 0,0276 Road Facility 0,1373 0,0953 0,1827 0,0803 0,1239 Vehicle Capability 0,0827 0,0590 0,1520 0,0283 0,0805 Speed of Traffic 0,1520 0,2420 0,1400 0,2637 0,1994 Sense of Comfort 0,0957 0,0730 0,0833 0,0523 0,0761
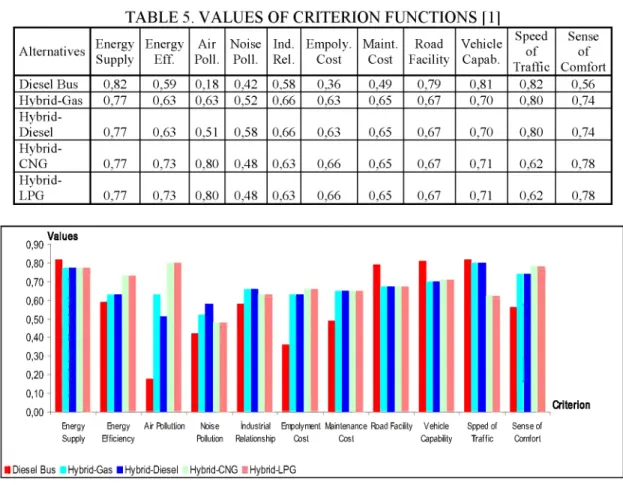
The evaluation o f alternative-fuel buses should be considered from various aspects as; energy supply, energy efficiency, air pollution, noise pollution, industrial relationship, implementation costs, maintenance costs, capability o f vehicle, road facility, speed o f traffic flow, comfort. The AHP is used to determine the weights o f evaluation criteria. The decision makers o f the related industries as bus producers and operators assessed their subjective relative importance for each o f the criteria. Table 4 shows the average values o f weights. Then the next step is to evaluate the alternatives.
C riterion
Manufacture ■ A c adem ic Institute ■ Research Organization ■ Bus O perator ■ Average FIGURE 2. COMPARISON OF CRITERIA VALUES
______________ TABLE 5. VALUES OF CRITERION FUNCTIONS [11_______________ Alternatives Energy Supply Energy Eff. Air Poll. Noise Poll. Ind. Rel. Empoly. Cost Maint. Cost Road Facility Vehicle Capab. Speed of Traffic Sense of Comfort Diesel Bus 0,82 0,59 0,18 0,42 0,58 0,36 0,49 0,79 0,81 0,82 0,56 Hybrid-Gas 0,77 0,63 0,63 0,52 0,66 0,63 0,65 0,67 0,70 0,80 0,74 Hybrid Diesel 0,77 0,63 0,51 0,58 0,66 0,63 0,65 0,67 0,70 0,80 0,74 Hybrid-CNG 0,77 0,73 0,80 0,48 0,63 0,66 0,65 0,67 0,71 0,62 0,78 Hybrid-LPG 0,77 0,73 0,80 0,48 0,63 0,66 0,65 0,67 0,71 0,62 0,78 0,90 0,80 0,70 0,60 0,50 0,40 0,30 0,20 0,10 0,00 Values Criterion E n e rg y S u p p ly
E n e rg y A ir FOlluttion N o is e in d u s tria l E m p o lym e n t M a in te n a n c e R oa d F a cility V e h ic le E ffic ie n c y FOllution R e la tio n s h ip C o s t C o s t C a p a b ility
S p p e d o f T r a ffic
S e n s e o f C o m fo rt
I Diesel Bus Hybrid-Gas i Hybrid-Diesel Hybrid-CNG ■ Hybrid-LPG
FIGURE 3. COMPARISON OF CRITERION FUNCTIONS
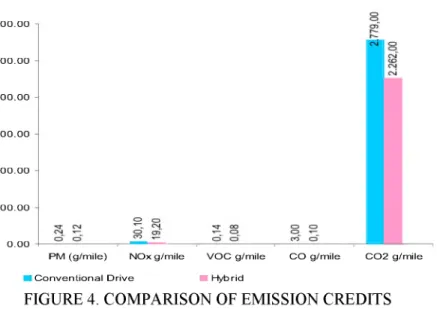
The m ajor force behind the development o f hybrid drive buses is emissions reduction. Hybrid buses are cleaner and emit fewer grams o f pollutants per mile than conventional diesel buses. Hybrids have been shown to reduce particulates and NO x by as much as 50% during testing. Hybrid buses may be very desirable for highly industrialized countries [5].
TABLE 6. HYBRID BUS EMISSION CREDITS [11
Conventional Drive Hybrid PM g/mile 0,24 0,12 ton/year/bus 0,01 0,00 ton/year/100 buses 0,71 0,36 NOx g/mile 30,10 19,20 ton/year/bus 0,89 0,57 ton/year/100 buses 89,40 57,20 VOC g/mile 0,14 0,08 ton/year/bus 0,00 0,00 ton/year/100 buses 0,42 0,24 CO g/mile 3,00 0,10 ton/year/bus 0,09 0,00 ton/year/100 buses 8,91 0,30 CO2 g/mile 2.779,00 2.262,00 ton/year/bus 82,54 37,18 ton/year/100 buses 8.253,63 6.718,14
P M ( g / m i l e ) N O x g / m i l e V O C g / m i l e
I C o n v e n t i o n a l D r i v e ■ H y b r i d
C O g / m i l e C O 2 g / m i l e
FIGURE 4. COMPARISON OF EM ISSION CREDITS
Dual mode hybrids may allow limited zero emission range for operation in highly sensitive areas. For example, crowded downtown, tourist or historic areas might particularly benefit from pure electric (zero emission) propulsion mode o f operation for short distances. In Boston, a new underground bus transit way is being constructed that will require buses to travel a 1.1 mile tunnel without burning fuel. Dual-mode hybrid buses might be particularly well suited to this type o f application.
3 . 0 0 0 , 0 0 2 . 5 0 0 , 0 0 2 . 0 0 0 , 0 0 1 . 5 0 0 , 0 0 1 . 0 0 0 , 0 0 5 0 0 , 0 0 0 , 0 0
The major impetus behind alternative fuels is interest in reducing harmful emissions, improving public health, and conserving energy. Political, social, and environmental pressures are being placed on transit agencies to adopt alternative fuels and technologies including hybrid-electric drive.
Normal operating conditions for diesel buses range from 10°C to 85° C. Hybrid buses can perform in similarly demanding conditions; however, this will likely require some type o f thermal management o f the batteries. Lead acid batteries become less efficient when ambient temperatures drop below 45° C while other batteries such as nickel metal hydride may require active cooling at warmer temperatures. Regardless, hybrid drive system developers are designing thermal management into their battery m anagement systems.
Hybrid transit bus maintenance costs are not well understood at this time. There is not yet enough operating experience with hybrids to realistically quantify the hours and costs associated with maintaining them. In practice, transit agencies experimenting with early hybrid prototypes report higher than normal maintenance costs which are typical for a new technology.
Hybrid technology can also have noise reduction benefits over conventional buses. Diesel bus noise standards typically specify that noise levels not exceed 83 dBA at any seat location in the bus at 50 km/h. Comparative noise data for hybrid bus was not available, but hybrid buses are quieter than standard diesel buses in service.
V . R E S U L T S
Hybrid-electric drive technology introduces new opportunities and challenges in bus operation and maintenance. Hybrid drive offers operational advantages such as smoother and quicker acceleration, more efficient braking, improved fuel economy, and reduced emissions. Maintenance requirements may initially increase due to energy storage system requirements; however, these may go away once the technology develops. In the long term, hybrid bus maintenance may be less difficult than conventional mechanical technology due to savings associated with transmission and brakes. Infrastructure modifications are expected to be minor. Mechanical and safety retraining is needed in light o f high voltage components. Transit providers must understand the issues and risks involved in deploying hybrid drive technology.
Successful introduction o f a new technology into the bus fleet ultimately depends on both the commitment from management and a successful management plan. Hybrid drive will present public transportation managers with new challenges in the areas o f operation, maintenance, labor, cost, and public relations. A m anagement plan must address each o f these issues and receive the full support o f the agency's leadership. Addressing the nuts and bolts o f infrastructure, hardware, and operating schedules will ensure success. Other human factors must be addressed as well, such as driver and mechanic acceptance. Employee acceptance can be won through careful training and rewards. Customer acceptance and public relations must also be carefully addressed. Hybrid technology may win supporters among public transportation users, elected officials and environmental constituencies for being quieter, smoother, and better for the environment.
R E F E R E N C E S
[1]Transportation Research Board National Research Council. (2000). Hybrid-Electric Transit Buses: Status, Issues, and
Benefits. TCRP Report 59, National Academy Press, Washington, D.C.
[2] US Department of Energy. (2007). Fuel Economy Guide.Report D0E/EE*0314, Office of Energy Efficiency and
Renewable Energy, Washington, DC.
[3]Kurani, K., Turretine, T., & Heffner, R. (2006). Narrative self-identity and societal goals: automotive fuel economy
and global warming policy. In D. Sperling, J. Cannon, & J. Cannon (Ed.), Driving Climate Change. Burlington: Elsevier.
[4] Heffner, R. R., Kurani, K. S., & Turrentine, T. S. (2007). Symbolism in California's early market for hybric electric
vehicles. Transportation Research P art D , 12, 396-413.
![TABLE 2 - SER][ES HYBRID [1]](https://thumb-eu.123doks.com/thumbv2/9libnet/4040004.56735/3.893.159.728.109.419/table-ser-es-hybrid.webp)