Tarım Bilimleri Dergisi
Tar. Bil. Der.Dergi web sayfası: www.agri.ankara.edu.tr/dergi
Journal of Agricultural Sciences
Journal homepage: www.agri.ankara.edu.tr/journal
TARIM BİLİMLERİ DERGİSİ
—
JOURNAL OF AGRICUL
TURAL SCIENCES
21 (2015) 606-619
Numerical Modelling and Experimental Validation of a Cold Store
Ambient Factors
Serap AKDEMİRa, Thomas BARTZANASb
aNamik Kemal University, Technical Sciences Vocational School, Air Conditioning and Refrigeration Programme, Tekirdağ, TURKEY
bCentre for Research and Technology-HELLAS, Institute for Research and Technology-Thessaly, Volos, GREECE
ARTICLE INFO
Research Article
Corresponding Author: Serap AKDEMİR, E-mail: [email protected], Tel: +90 (537) 529 59 06 Received: 19 October 2014, Received in Revised Form: 20 March 2015, Accepted: 30 March 2015
ABSTRACT
The objective of this study was to analyse air temperature and relative humidity distribution in an experimental cold store fully loaded with apples by using both experimental and numerical (CFD) methods. An unsteady three-dimensional computational fluid dynamics model was developed to assess the distribution of temperature and relative humidity in a cold store fully loaded with Granny Smith apples. The storage temperature and relative humidity were maintained at 2 °C and 90%, respectively. The relative humidity and temperature were measured at 36 different points inside the cold store in three different planes. A three-dimensional mathematical model was built for the numerical needs. The numerical model was validated against experimental data from the same facility. Relative error of the model was calculated 13% for temperature and 1.43% for relative humidity. Numerical results obtained from the simulations agreed quite well with experimental data for temperature and relative humidity. Maximum differences were observed near the borders of the cold store which can be attributed to the stronger thermal gradients taking place on these surfaces. A more homogeneous distribution was achieved in the middle of the cold store both for air temperature and relative humidity leading to even smaller errors between measurements and simulations.
Keywords: Computational fluid dynamics (CFD); Cold store; Temperature; Relative humidity; Apple
Bir Soğuk Hava Deposunda Ortam Koşullarının Sayısal Modellenmesi
ve Deneysel Geçerliliğinin Belirlenmesi
ESER BİLGİSİ
Araştırma Makalesi
Sorumlu Yazar: Serap AKDEMİR, E-posta: [email protected], Tel: +90 (537) 529 59 06 Geliş Tarihi: 19 Ekim 2014, Düzeltmelerin Gelişi: 20 Mart 2015, Kabul: 30 Mart 2015
ÖZET
Bu araştırmanın amacı; deneysel bir soğuk depo için sıcaklık ve bağıl nem dağılımını sayısal ve deneysel yöntemleri birlikte kullanarak incelemektir. Granny Smith elma ile dolu bir soğuk depoda hava hızı ve sıcaklığın dağılımını değerlendirmek için kararsız üç boyutlu hesaplamalı akışkanlar dinamiği modeli geliştirilmiştir. Depolama sıcaklığı ve
Numerical Modelling and Experimental Validation of a Cold Store Ambient Factors, Akdemir & Bartzanas
1. Introduction
Many agricultural products are consumed a long time after their harvest or they have to be kept in storage for long periods of time. Fruits and vegetables remain physiologically active after harvesting. Respiration affects and constrains the life span of fruits and vegetables, as well as quality and nutrition changes during storage. Continuing respiration after harvesting of fruits and vegetables results in quality deterioration and nutrient reduction. Post-harvest storage facilities for agricultural fresh products are usually used in order to preserve the quality of agricultural products by reducing the respiration process and thus the production of carbon dioxide and heat. The indoor climate was automated and controlled in order to keep temperature, humidity and CO2 concentration stable. However, it is difficult to achieve a homogenous distribution of climate parameters in any agricultural building due to geometrical features of the post-harvest facility, the cooling medium and the influence of products on the airflow distribution as well as the rest climate parameters. However it is important to access in as much detail is possible the distribution of air temperature and then to propose a design modification in the cold store for improving the quality and storage duration of agricultural products. The heterogeneous climate inside a cold store can be accessed experimentally. However the method is expensive, time consuming and usually very difficult, if not impossible, to receive values for the whole experimental domain. On the other hand, numerical modelling techniques such as computational fluid dynamics (CFD) can be used as an alternative technology and tool for
analysing design parameters and/or fruit process, environmental data and weather conditions within a virtual environment. Computational fluid dynamics (CFD) is a simulation tool which uses powerful computer and applied mathematics to model fluid flow situations for the prediction of heat, mass and momentum transfer and optimal design in industrial processes. It is only in recent years that CFD has been applied in the food processing industry (Xia & Sun 2002). The amount of experimental work has thus been greatly reduced, although, not eliminated since experimental data is needed for the validation process. CFD is used more and more in many engineering applications that aim to analyse heat and mass transfer and to propose design modifications (Schaldach et al 2000). CFD is also used extensively in agricultural operations in the last decade such as: drying and sterilization, Le Page et al (2009), crop sprayers Nuyttens et al (2009), greenhouse and livestock buildings Bartzanas et al (2013); Ambaw et al (2013); Bjerg et al (2013). CFD has been used to predict and analyse the airflow, air temperature and air gases distribution in post-harvest facilities (Foster et al 2006). Tassou & Xiang (1998) have analysed the buoyancy driver airflow in a post-harvest facility used for vegetables. The 3-D model of (Xu & Burfoot 1999) for the prediction of distribution of air velocity, air temperature and humidity was further improved and used by Moureh et al (2009). In order to predict the possibilities of condensation in stored potatoes, Chourasia & Goswami (2007a) used CFD not only to analyse the distribution of microclimate variables inside a cold store room but also to propose design modifications for improving the airflow distribution system. The same approach for improving the design of
bağıl nem 2 oC ve % 90 olarak belirlenmiştir. Bağıl nem ve sıcaklık soğuk hava deposu içinde üç farklı düzlemde 36
farklı noktada ölçülmüştür. Sayısal gereksinimler için üç boyutlu matematiksel model oluşturulmuştur. Sayısal modelin geçerliliği aynı koşullarda uygulamadan elde edilen deneysel verilerle test edilmiştir. Modelin bağıl hatası sıcaklık için % 13 ve hava hızı için % 1.43 olarak hesaplanmıştır. Sıcaklık ve bağıl nem için modellemeden elde edilen sayısal sonuçlar oldukça iyidir. Model ile ölçümler arasındaki en yüksek farklılıklar yüzeyler üzerinde ısı değişimlerinin en güçlü olduğu soğuk odanın sınırlarına yakın saptanmıştır. Soğuk deponun ortasında model ve ölçümler arasında küçük hatalar olmasına rağmen hem sıcaklık hem de bağıl nem için daha homojen bir dağılım elde edilmiştir.
Anahtar Kelimeler: Hesaplamalı akışkanlar dinamiği (HAD); Soğuk depo; Sıcaklık; Bağıl nem; Elma
Bir Soğuk Hava Deposunda Ortam Koşullarının Sayısal Modellenmesi ve Deneysel Geçerliliğinin Belirlenmesi, Akdemir & Bartzanas
air conditioning systems was adopted and used by Tanaka et al (2012) and Xie et al (2006). Their results clearly indicate the strong influence of design parameters on the distribution of air velocity and air temperature inside the cold store facilities. Nahor et al (2005) developed and experimentally validated a CFD model for predicting air and fruit temperature with reasonable accuracy. Mirade & Picgirard (2006) developed a CFD model which was also validated successfully against experimental data for improving the airflow distribution inside a batch-type meat carcass chiller. Martins et al (2011) used a CFD model with a true apple shape in order to study the cooling of apple fruits in overleaf arrangements on trays. The cooling performance of a partially loaded cold store was numerically investigated and experimentally validated by Tanaka et al (2012) with the aim of a transient 3D CFD model. A multi-scale approach for analysing air velocity distribution cold store facilities was used by Delele et al (2009). The CFD model was used at the smallest scale whereas, at a larger scale, the airflow was assessed through the estimation of pressure loss coefficients around the stacks. Air flow inside a cold store was investigated using computational fluid dynamics by Hoang et al (2000). The validation of the model was performed using a comparison of the calculated time-averaged velocity magnitudes with the mean velocities measured by means of a hot film type omnidirectional velocity sensor. A relative error of 26% was observed on the calculated air velocities (Hoang et al 2000). The SST k–ω based model was applied to calculate air-flow velocities and temperatures in a model office room. Calculations were compared with experimental results as well as with the results of the standard k–ε, the RNG k– ε model and the laminar model. It was concluded that (a) all the three tested turbulent models satisfactorily predict the main qualitative features of the flow and the layered type of temperature fields and (b) computations with the SST k–ω based model show the best agreement with the measurements (Stamou & Katsiris 2006). Measurements of infiltration through different size entrances of a cold store at two different cold store temperatures were taken and compared against established analytical models and computational fluid dynamics (CFD) models
(Foster et al 2003). To investigate the effectiveness of postharvest storage fungicide fogging systems, a computational fluid dynamics (CFD) model was developed and validated (Delele et al 2012).
Variation of storage conditions greatly affects quality of stored products. Using sensors in cold storage is an easy and rapid method to attain valuable data and monitor the storage conditions on an ongoing basis. Fuzzy clustering was proved to be a sufficient tool to manage spatial variation of cold storage properties and to delineate zones of differential management (Akdemir & Tagarakis 2014). Distribution of the temperature and relative humidity in a cold store was important because these factors affect quality of stored products. Many studies on the effect of storage temperature on quality and storage life of fruits have been carried out which indicate that temperature plays an important role on quality of fruits after harvest (Marcilla et al 2006). The Objective of this study was to analyse air temperature and velocity distribution in an experimental cold store full loaded apples by using both experimental and numerical (CFD) methods. A second objective was to use the validated CFD model for proposing design modifications of the cold store for improving the homogeneity of environmental factors.
2. Material and Methods
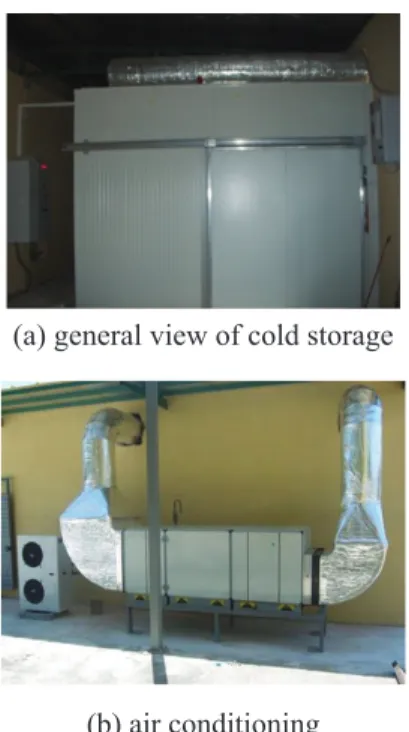
2.1. Experimental cold storeAn experimental cold store (4.0 m length, 5.0 m width and 3.0 m height) with chiller and air conditioning system was used in this study. The system consists of three main units; water cooling unit, air conditioning unit and control unit. Cold store mainly installed in a concrete building but two of the walls of the cold store were located in front of the outside walls of concrete buildings. These walls called as “outside walls”. One another called as “door-wall” and last was inside walls because of its position. The experimental cold storage general view and the air-conditioning units can be seen in Figure 1.
Apples (Granny Smith variety) were stored during the experiments. Air conditioning unit was
Numerical Modelling and Experimental Validation of a Cold Store Ambient Factors, Akdemir & Bartzanas
operating to maintain an air temperature of 2 °C and an air relative humidity of 90% during the storage. The unit has a tolerance of ± 0.5 °C for air temperature, 5% for relative humidity and the temperature control step was 0.1 °C. The technical specifications of the air-conditioning unit used in the experimental cold storage were given in Table 1.
Water was cooled by using refrigerant 404A in the chiller. Cold air was distributed by the inlet (pressure) channels and exhausted by the outlet (suction) air channels to be released outside. There were 3 inlets and 3 outlets channels for ventilation and suction of the cold air. The cooling system was facilitated with a vapour humidification capacity of 2 kg h-1. A control software was responsible for the supervision and inspection of the cooling system performance. Inlet and outlet temperatures as well as relative humidity could be controlled and checked on a computer screen.
2.2. Data loggers for temperature and relative humidity
Air temperature and relative humidity were measured using a Testo 177 H1 data logger. Number of Testo 177H1 data logger was 36. Measuring Range of the Testo 177 H1 data logger is 0..100 for relative humidity and -40 to +120 °C for temperature. Resolution is 0.1 for RH% and 0.1 °C for temperature. Accuracy is for 2% for relative humidity and 0.2% for temperature (Testo 2015). Testo Comfort Software and Testo IRsoft software were used to transfer the recorded data from the data loggers to the computer.
2.3. Numerical analysis
Computational Fluid Dynamics (CFD) software package ANSYS FLUENT v.14 was used for numerical modelling of air temperature and relative humidity in the cold store (Ansys 2014). The finite volume method was used to solve the partial differential equations for different quantities of interest. The code first performs the coupled resolution of the pressure and velocity fields after which it continues with the other parameters such as temperature. The domain of interest was generated and then meshed using the integrated pre-processor software for creating and meshing the geometry. Table 1- Technical specification of air conditioning unit
Çizelge 1- İklimlendirme sisteminin teknik özellikleri
Parameter Value
Ventilator type Axial Flow rate 5000 m3 h-1 Cooling system capacity 10 kW Heating capacity 5 kW Inlet air temperature and relative
humidity 19 °C 65% RH
Outlet air temperature and
relative humidity 15 °C 85% RH Water inlet and outlet
temperature 6/11 °C
Heating system type Electrical resistance Air flow rate of ventilator Invertor changes
flow rate (a) general view of cold storage
(b) air conditioning
Figure 1- The experimental cold storage general view (a) and the air conditioning unit (b)
Şekil 1- Deneysel soğuk odanın genel görünümü (a) ve iklimlendirme ünitesi (b)
Bir Soğuk Hava Deposunda Ortam Koşullarının Sayısal Modellenmesi ve Deneysel Geçerliliğinin Belirlenmesi, Akdemir & Bartzanas
The CFD technique numerically solved the Navier-Stokes equations and the mass and energy conservation equations. The three dimensional conservation equations describing the transport phenomena for steady flows in free convection are of the general form:
2
(U ) (V ) (W ) S
x y z Φ
∂ Φ +∂ Φ +∂ Φ = Γ∇ Φ +
∂ ∂ ∂ (1)
In Equation (1), Φ stands for the transport quantity in a dimensionless form, while U, V and W are the components of velocity vector; Γ is the diffusion coefficient; and SΦ is the source term.
The present flow and transport phenomena are described using the Navier-Stokes equations. The time-averaged Navier-Stokes equations for the continuity and momentum are given in Equation 2 and 3. Continuity equation: 0 i i U x ∂ = ∂ (2) Momentum conservation:
(
)
i i j i b i j i j j U P U U f S x x x x ρ ∂∂ = −∂∂ +∂∂ µ µ+ ∂∂ + + (3) 2.4. Turbulence modellingSeveral previous experiments and simulations have shown that airflow distribution inside buildings is turbulent even for very small values of air velocity (Monteith & Unsworth 1990). We have to introduce turbulent models in our solution domain in order to assess the turbulent nature of air flow and to obtain a more realistic solution. The standard k-ε model (Launder & Spalding 1974) assuming isotropic turbulence was adopted to describe turbulent transport. The complete set of equations of the k-ε model as in Equation 4, 5, 6 and 7 can be found in Mohammadi & Pironneau (1994).
The effect of turbulence on flow was implemented via the high Re k-ε model (standard) model (Launder & Spalding 1974).
t i j ij j j j j U k U k k t x x κ x x µ ρ ρ µ τ ρε σ + + ∂ ∂ ∂ = ∂ + ∂ − ∂ ∂ ∂ ∂ ∂ (4) 2 2 1 ε ε ε ε ε µ ε ε ε ρ ρ µ ρ σ = ∂ + ∂ ∂ + ∂ − + ∂ j∂ ∂ t∂ k j j j U C C P t x x x k k (5)
Where, the turbulent viscosity is:
2 t Cµk
µ
ρ
ε
= (6) and∂
=
∂
i k ij jU
P
x
τ
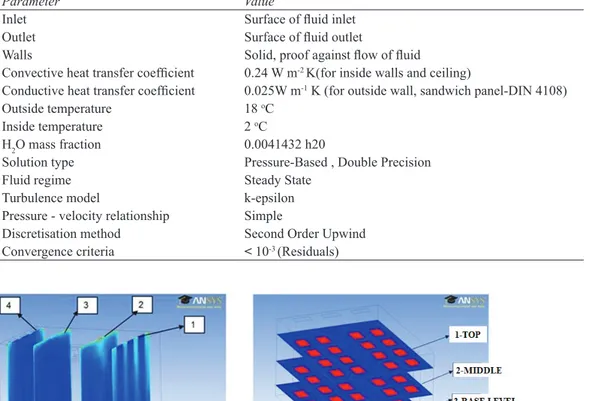
(7) and Cμ= 0.09, σκ=1, Cε1= 1.44, Cε2= 1.96, and σε= 1.3 are model constants.Boundary and initial conditions, the geometry of the studied domain and the final grid are all important factors that affect the final result. Mean values from experiments were used for boundary and initial conditions (Table 2) and a three dimensional (3D) model for rendering the geometry of the cold store (Figure 4). The final grid, selected after grid independence test studies, was dense enough to secure accurate solutions especially in areas where strong gradients of airflow were expected. Number of the tetrahedral and hexahedral elements was approximately 3250000. The resulting solid model, mesh structure and nodes were presented in Figure 2.
Distributions of temperature and relative humidity in the cold store were modelled using Computational Fluid Dynamic (CFD). Analysis includes geometrical modelling, creating numerical mesh and evaluating of results. Boundary conditions have been given in Table 2.
Tetrahedral and hexahedral meshes were generated and then refined until a solution was obtained. Turbulence was modelled using k-ε. Heat transition through boundaries and the lighting system were taken into account for modelling. The base of cold store was accepted as an isolated surface. Constant heat transition was used as a boundary condition for the walls and ceiling. Storage temperature, air velocity and relative humidity were assumed as 2 oC, 2.99 m s-1 and 90%, respectively.
X-Z, Y-Z and X-Y planes and levels were used to acquire data from CFD models which have been given in Figure 3.
Numerical Modelling and Experimental Validation of a Cold Store Ambient Factors, Akdemir & Bartzanas
(a)Solid model (b) Mesh structure (c) nodes Figure 2- Solid model (a) mesh structure (b) and nodes (c) in the geometrical model
Şekil 2- Geometrik modelde katı model (a) mesh yapısı (b) ve düğüm noktaları (c)
Table 2- CFD Model boundary conditions
Çizelge 2- CFD Model sınır koşulları
Parameter Value
Inlet Surface of fluid inlet
Outlet Surface of fluid outlet
Walls Solid, proof against flow of fluid
Convective heat transfer coefficient 0.24 W m-2 K(for inside walls and ceiling)
Conductive heat transfer coefficient 0.025W m-1 K (for outside wall, sandwich panel-DIN 4108) Outside temperature 18 oC
Inside temperature 2 oC
H2O mass fraction 0.0041432 h20
Solution type Pressure-Based , Double Precision Fluid regime Steady State
Turbulence model k-epsilon Pressure - velocity relationship Simple
Discretisation method Second Order Upwind Convergence criteria < 10-3 (Residuals)
Figure 3- X-Z and X-Y planes
Bir Soğuk Hava Deposunda Ortam Koşullarının Sayısal Modellenmesi ve Deneysel Geçerliliğinin Belirlenmesi, Akdemir & Bartzanas
In addition, CFD models of temperature and relative humidity were developed for Y-Z planes, X-Z and X-Y planes by using Ansys Fluent Software. 2.5. Experimental measurements
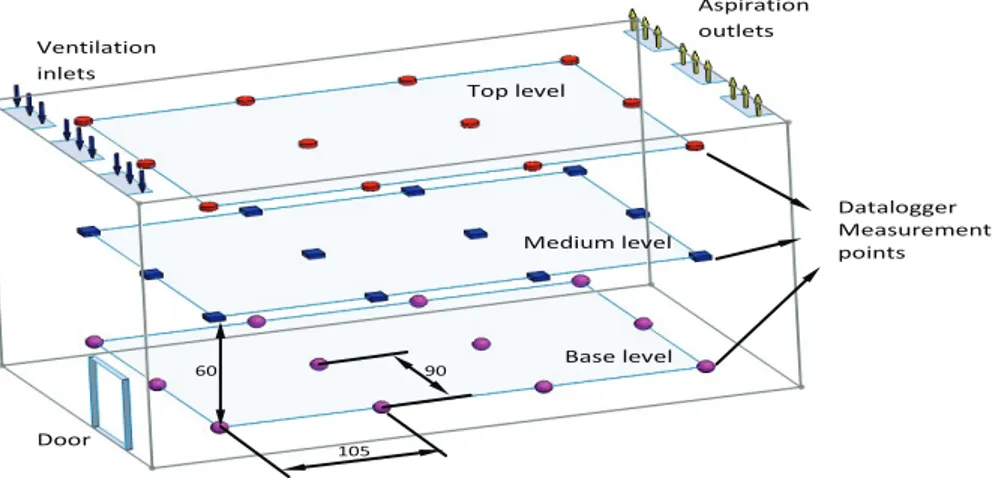
The cold store was loaded with 160 cases (10 cases/ column, 4x4 rows) of 0.6 m length, 0.4 m width and 0.2 m height. The arrangement of apple cases has been shown in Figure 4.
Air temperature and relative humidity were measured at a total of 36 different points inside the cold store for 3 different levels (12 points for each
level). Measurement points (as star), axis and layout of the data loggers can be seen in Figure 5.
Temperature and relative humidity data loggers were located at measurement points. Model data were determined from CFD models by using Ansys Fluent Software.
CFD Model validated with measurements by using Equation 8 (Hoang et al 2000; Nahor et al 2005; Chourasia & Gosvami 2007a).
7
Air temperature and relative humidity were measured at a total of 36 different points inside the cold store for 3 different levels (12 points for each level). Measurement points (as star), axis and layout of the data loggers can be seen in Figure 5.
Figure 5- Measurements points, axis and layout of the data loggers in the cold store
Şekil 5- Soğuk odada ölçme noktaları, eksenler ve data loggerların yerleşimi
Temperature and relative humidity data loggers were located at measurement points. Model data were determined from CFD models by using Ansys Fluent Software.
CFD Model validated with measurements by using equation given below (Hoang et al 2000; Nahor et al 2005; Chourasia & Gosvami 2007a).
𝐸𝐸𝐸𝐸𝐶𝐶𝐶𝐶𝐶𝐶𝐶𝐶𝐶𝐶𝐶𝐶 ������ =1 𝑆𝑆𝑆𝑆∑ �𝑅𝑅𝑅𝑅𝑅𝑅𝑅𝑅𝐶𝐶𝐶𝐶𝐶𝐶𝐶𝐶𝐶𝐶𝐶𝐶 𝑟𝑟𝑟𝑟 , 𝑡𝑡𝑡𝑡𝐶𝐶𝐶𝐶𝐶𝐶𝐶𝐶𝐶𝐶𝐶𝐶,𝑟𝑟𝑟𝑟 −𝑅𝑅𝑅𝑅𝑅𝑅𝑅𝑅𝑚𝑚𝑚𝑚𝑚𝑚𝑚𝑚𝑚𝑚𝑚𝑚𝑚𝑚𝑚𝑚𝑚𝑚𝑚𝑚𝑟𝑟𝑟𝑟𝑚𝑚𝑚𝑚𝑚𝑚𝑚𝑚𝑚𝑚𝑚𝑚𝑚𝑚𝑚𝑚𝑚𝑚𝑚𝑚𝑚𝑚𝑚𝑚𝑟𝑟𝑟𝑟 , 𝑡𝑡𝑡𝑡𝑚𝑚𝑚𝑚𝑚𝑚𝑚𝑚𝑚𝑚𝑚𝑚𝑚𝑚𝑚𝑚𝑚𝑚𝑚𝑚𝑟𝑟𝑟𝑟𝑚𝑚𝑚𝑚𝑚𝑚𝑚𝑚𝑚𝑚𝑚𝑚𝑚𝑚𝑚𝑚𝑚𝑚𝑚𝑚𝑚𝑚𝑚𝑚𝑟𝑟𝑟𝑟 � 𝑅𝑅𝑅𝑅𝑅𝑅𝑅𝑅𝑚𝑚𝑚𝑚𝑚𝑚𝑚𝑚𝑚𝑚𝑚𝑚𝑚𝑚𝑚𝑚𝑚𝑚𝑚𝑚𝑟𝑟𝑟𝑟𝑚𝑚𝑚𝑚𝑚𝑚𝑚𝑚𝑚𝑚𝑚𝑚𝑚𝑚𝑚𝑚𝑚𝑚𝑚𝑚𝑚𝑚𝑚𝑚𝑟𝑟𝑟𝑟 , 𝑡𝑡𝑡𝑡𝑚𝑚𝑚𝑚𝑚𝑚𝑚𝑚𝑚𝑚𝑚𝑚𝑚𝑚𝑚𝑚𝑚𝑚𝑚𝑚𝑟𝑟𝑟𝑟𝑚𝑚𝑚𝑚𝑚𝑚𝑚𝑚𝑚𝑚𝑚𝑚𝑚𝑚𝑚𝑚𝑚𝑚𝑚𝑚𝑚𝑚𝑚𝑚𝑟𝑟𝑟𝑟 𝑠𝑠𝑠𝑠 𝑟𝑟𝑟𝑟=1 . 100……….. (8)
Where; 𝐸𝐸𝐸𝐸������, relative error (%); s, Total number of the measurements; r, Indices 0, 1, 2,….s; 𝑅𝑅𝑅𝑅𝑅𝑅𝑅𝑅𝐶𝐶𝐶𝐶𝐶𝐶𝐶𝐶𝐶𝐶𝐶𝐶 𝐶𝐶𝐶𝐶𝐶𝐶𝐶𝐶𝐶𝐶𝐶𝐶,𝑟𝑟𝑟𝑟 𝑡𝑡𝑡𝑡𝐶𝐶𝐶𝐶𝐶𝐶𝐶𝐶𝐶𝐶𝐶𝐶,𝑟𝑟𝑟𝑟 ,
CFD model data for relative humidity and temperature; 𝑅𝑅𝑅𝑅𝑅𝑅𝑅𝑅𝑚𝑚𝑚𝑚𝑚𝑚𝑚𝑚𝑚𝑚𝑚𝑚𝑠𝑠𝑠𝑠𝑚𝑚𝑚𝑚𝑟𝑟𝑟𝑟𝑚𝑚𝑚𝑚𝑚𝑚𝑚𝑚𝑚𝑚𝑚𝑚𝑚𝑚𝑚𝑚𝑡𝑡𝑡𝑡𝑠𝑠𝑠𝑠𝑟𝑟𝑟𝑟 , 𝑡𝑡𝑡𝑡𝑚𝑚𝑚𝑚𝑚𝑚𝑚𝑚𝑚𝑚𝑚𝑚𝑠𝑠𝑠𝑠𝑚𝑚𝑚𝑚𝑟𝑟𝑟𝑟𝑚𝑚𝑚𝑚𝑚𝑚𝑚𝑚𝑚𝑚𝑚𝑚𝑚𝑚𝑚𝑚𝑡𝑡𝑡𝑡𝑠𝑠𝑠𝑠𝑟𝑟𝑟𝑟 , Measured data for
relative humidity and temperature.
Mean values of ambient factors do not give a correct idea for the evaluation of the spatial distribution of relative humidity and temperature in a cold store. The variation should be evaluated level by level using CFD models and spatial distribution graphics of ambient factors. In addition, variance analysis also gives an idea about the comparison of the CFD model with data logger measurements. In this sense; differences between model and measurements were calculated and evaluated via variance analysis for statistical evaluation. Significant sources such as CFD/Measurements, Y axis, levels or interactions between these factors were grouped by Duncan test. Logarithmic transformation was applied to relative humidity for variance analysis (Soysal 2007). SPSS and MSTAT statistical software were used to make variance analysis and Duncan grouping tests.
3. Results and Discussion
3.1. CFD model results 3.1.1. Temperature
Air temperature distribution in the Y-Z planes has been given in Figure 6. Air temperature strongly decreased in this specific area due the strong air steam from inlet, increasing in the rest volume of the cold
Door Ventilation inlets Aspiration outlets Datalogger Measurement points Medium level Top level Base level 105 90 60 (8)
(a) Sizes of cold store and boxes (b) Model domain (c) layout of the apple cases Figure 4- Sizes of cold store and boxes (a) model domain (b) layout of the apple cases (c)
Şekil 4- Soğuk oda ve kasaların ölçüleri (a) model etki alanı (b) elma kasalarının yerleşimi(c)
Door Ventilation inlets Aspiration outlets Datalogger Measurement points Medium level Top level Base level 105 90 60
Figure 5- Measurements points, axis and layout of the data loggers in the cold store Şekil 5- Soğuk odada ölçme noktaları, eksenler ve data loggerların yerleşimi
Numerical Modelling and Experimental Validation of a Cold Store Ambient Factors, Akdemir & Bartzanas
Where;
7
Air temperature and relative humidity were measured at a total of 36 different points inside the cold store for 3 different levels (12 points for each level). Measurement points (as star), axis and layout of the data loggers can be seen in Figure 5.
Figure 5- Measurements points, axis and layout of the data loggers in the cold store
Şekil 5- Soğuk odada ölçme noktaları, eksenler ve data loggerların yerleşimi
Temperature and relative humidity data loggers were located at measurement points. Model data were determined from CFD models by using Ansys Fluent Software.
CFD Model validated with measurements by using equation given below (Hoang et al 2000; Nahor et al 2005; Chourasia & Gosvami 2007a).
𝐸𝐸𝐸𝐸𝐶𝐶𝐶𝐶𝐶𝐶𝐶𝐶𝐶𝐶𝐶𝐶 ������ =1 𝑆𝑆𝑆𝑆∑ �𝑅𝑅𝑅𝑅𝑅𝑅𝑅𝑅𝐶𝐶𝐶𝐶𝐶𝐶𝐶𝐶𝐶𝐶𝐶𝐶 𝑟𝑟𝑟𝑟 , 𝑡𝑡𝑡𝑡𝐶𝐶𝐶𝐶𝐶𝐶𝐶𝐶𝐶𝐶𝐶𝐶,𝑟𝑟𝑟𝑟 −𝑅𝑅𝑅𝑅𝑅𝑅𝑅𝑅𝑚𝑚𝑚𝑚𝑚𝑚𝑚𝑚𝑚𝑚𝑚𝑚𝑚𝑚𝑚𝑚𝑚𝑚𝑚𝑚𝑟𝑟𝑟𝑟𝑚𝑚𝑚𝑚𝑚𝑚𝑚𝑚𝑚𝑚𝑚𝑚𝑚𝑚𝑚𝑚𝑚𝑚𝑚𝑚𝑚𝑚𝑚𝑚𝑟𝑟𝑟𝑟 , 𝑡𝑡𝑡𝑡𝑚𝑚𝑚𝑚𝑚𝑚𝑚𝑚𝑚𝑚𝑚𝑚𝑚𝑚𝑚𝑚𝑚𝑚𝑚𝑚𝑟𝑟𝑟𝑟𝑚𝑚𝑚𝑚𝑚𝑚𝑚𝑚𝑚𝑚𝑚𝑚𝑚𝑚𝑚𝑚𝑚𝑚𝑚𝑚𝑚𝑚𝑚𝑚𝑟𝑟𝑟𝑟 � 𝑅𝑅𝑅𝑅𝑅𝑅𝑅𝑅𝑚𝑚𝑚𝑚𝑚𝑚𝑚𝑚𝑚𝑚𝑚𝑚𝑚𝑚𝑚𝑚𝑚𝑚𝑚𝑚𝑟𝑟𝑟𝑟𝑚𝑚𝑚𝑚𝑚𝑚𝑚𝑚𝑚𝑚𝑚𝑚𝑚𝑚𝑚𝑚𝑚𝑚𝑚𝑚𝑚𝑚𝑚𝑚𝑟𝑟𝑟𝑟 , 𝑡𝑡𝑡𝑡 𝑚𝑚𝑚𝑚𝑚𝑚𝑚𝑚𝑚𝑚𝑚𝑚𝑚𝑚𝑚𝑚𝑚𝑚𝑚𝑚𝑟𝑟𝑟𝑟𝑚𝑚𝑚𝑚𝑚𝑚𝑚𝑚𝑚𝑚𝑚𝑚𝑚𝑚𝑚𝑚𝑚𝑚𝑚𝑚𝑚𝑚𝑚𝑚 𝑟𝑟𝑟𝑟 𝑠𝑠𝑠𝑠 𝑟𝑟𝑟𝑟=1 . 100……….. (8)
Where; 𝐸𝐸𝐸𝐸������, relative error (%); s, Total number of the measurements; r, Indices 0, 1, 2,….s; 𝑅𝑅𝑅𝑅𝑅𝑅𝑅𝑅𝐶𝐶𝐶𝐶𝐶𝐶𝐶𝐶𝐶𝐶𝐶𝐶 𝐶𝐶𝐶𝐶𝐶𝐶𝐶𝐶𝐶𝐶𝐶𝐶,𝑟𝑟𝑟𝑟 𝑡𝑡𝑡𝑡𝐶𝐶𝐶𝐶𝐶𝐶𝐶𝐶𝐶𝐶𝐶𝐶,𝑟𝑟𝑟𝑟 ,
CFD model data for relative humidity and temperature; 𝑅𝑅𝑅𝑅𝑅𝑅𝑅𝑅𝑚𝑚𝑚𝑚𝑚𝑚𝑚𝑚𝑚𝑚𝑚𝑚𝑠𝑠𝑠𝑠𝑚𝑚𝑚𝑚𝑟𝑟𝑟𝑟𝑚𝑚𝑚𝑚𝑚𝑚𝑚𝑚𝑚𝑚𝑚𝑚𝑚𝑚𝑚𝑚𝑡𝑡𝑡𝑡𝑠𝑠𝑠𝑠𝑟𝑟𝑟𝑟 , 𝑡𝑡𝑡𝑡𝑚𝑚𝑚𝑚𝑚𝑚𝑚𝑚𝑚𝑚𝑚𝑚𝑠𝑠𝑠𝑠𝑚𝑚𝑚𝑚𝑟𝑟𝑟𝑟𝑚𝑚𝑚𝑚𝑚𝑚𝑚𝑚𝑚𝑚𝑚𝑚𝑚𝑚𝑚𝑚𝑡𝑡𝑡𝑡𝑠𝑠𝑠𝑠𝑟𝑟𝑟𝑟 , Measured data for
relative humidity and temperature.
Mean values of ambient factors do not give a correct idea for the evaluation of the spatial distribution of relative humidity and temperature in a cold store. The variation should be evaluated level by level using CFD models and spatial distribution graphics of ambient factors. In addition, variance analysis also gives an idea about the comparison of the CFD model with data logger measurements. In this sense; differences between model and measurements were calculated and evaluated via variance analysis for statistical evaluation. Significant sources such as CFD/Measurements, Y axis, levels or interactions between these factors were grouped by Duncan test. Logarithmic transformation was applied to relative humidity for variance analysis (Soysal 2007). SPSS and MSTAT statistical software were used to make variance analysis and Duncan grouping tests.
3. Results and Discussion
3.1. CFD model results 3.1.1. TemperatureAir temperature distribution in the Y-Z planes has been given in Figure 6. Air temperature strongly decreased in this specific area due the strong air steam from inlet, increasing in the rest volume of the cold
Door Ventilation inlets Aspiration outlets Datalogger Measurement points Medium level Top level Base level 105 90 60
, relative error (%); s, total number of the measurements; r, indices 0, 1, 2,….s;
7
Air temperature and relative humidity were measured at a total of 36 different points inside the cold store for 3 different levels (12 points for each level). Measurement points (as star), axis and layout of the data loggers can be seen in Figure 5.
Figure 5- Measurements points, axis and layout of the data loggers in the cold store
Şekil 5- Soğuk odada ölçme noktaları, eksenler ve data loggerların yerleşimi
Temperature and relative humidity data loggers were located at measurement points. Model data were determined from CFD models by using Ansys Fluent Software.
CFD Model validated with measurements by using equation given below (Hoang et al 2000; Nahor et al 2005; Chourasia & Gosvami 2007a).
𝐸𝐸𝐸𝐸𝐶𝐶𝐶𝐶𝐶𝐶𝐶𝐶𝐶𝐶𝐶𝐶 ������ =1 𝑆𝑆𝑆𝑆∑ �𝑅𝑅𝑅𝑅𝑅𝑅𝑅𝑅𝐶𝐶𝐶𝐶𝐶𝐶𝐶𝐶𝐶𝐶𝐶𝐶 𝑟𝑟𝑟𝑟 , 𝑡𝑡𝑡𝑡𝐶𝐶𝐶𝐶𝐶𝐶𝐶𝐶𝐶𝐶𝐶𝐶,𝑟𝑟𝑟𝑟 −𝑅𝑅𝑅𝑅𝑅𝑅𝑅𝑅𝑚𝑚𝑚𝑚𝑚𝑚𝑚𝑚𝑚𝑚𝑚𝑚𝑚𝑚𝑚𝑚𝑚𝑚𝑚𝑚𝑟𝑟𝑟𝑟𝑚𝑚𝑚𝑚𝑚𝑚𝑚𝑚𝑚𝑚𝑚𝑚𝑚𝑚𝑚𝑚𝑚𝑚𝑚𝑚𝑚𝑚𝑚𝑚𝑟𝑟𝑟𝑟 , 𝑡𝑡𝑡𝑡𝑚𝑚𝑚𝑚𝑚𝑚𝑚𝑚𝑚𝑚𝑚𝑚𝑚𝑚𝑚𝑚𝑚𝑚𝑚𝑚𝑟𝑟𝑟𝑟𝑚𝑚𝑚𝑚𝑚𝑚𝑚𝑚𝑚𝑚𝑚𝑚𝑚𝑚𝑚𝑚𝑚𝑚𝑚𝑚𝑚𝑚𝑚𝑚𝑟𝑟𝑟𝑟 � 𝑅𝑅𝑅𝑅𝑅𝑅𝑅𝑅𝑚𝑚𝑚𝑚𝑚𝑚𝑚𝑚𝑚𝑚𝑚𝑚𝑚𝑚𝑚𝑚𝑚𝑚𝑚𝑚𝑟𝑟𝑟𝑟𝑚𝑚𝑚𝑚𝑚𝑚𝑚𝑚𝑚𝑚𝑚𝑚𝑚𝑚𝑚𝑚𝑚𝑚𝑚𝑚𝑚𝑚𝑚𝑚𝑟𝑟𝑟𝑟 , 𝑡𝑡𝑡𝑡 𝑚𝑚𝑚𝑚𝑚𝑚𝑚𝑚𝑚𝑚𝑚𝑚𝑚𝑚𝑚𝑚𝑚𝑚𝑚𝑚𝑟𝑟𝑟𝑟𝑚𝑚𝑚𝑚𝑚𝑚𝑚𝑚𝑚𝑚𝑚𝑚𝑚𝑚𝑚𝑚𝑚𝑚𝑚𝑚𝑚𝑚𝑚𝑚𝑟𝑟𝑟𝑟 𝑠𝑠𝑠𝑠 𝑟𝑟𝑟𝑟=1 . 100……….. (8)
Where; 𝐸𝐸𝐸𝐸������, relative error (%); s, Total number of the measurements; r, Indices 0, 1, 2,….s; 𝑅𝑅𝑅𝑅𝑅𝑅𝑅𝑅𝐶𝐶𝐶𝐶𝐶𝐶𝐶𝐶𝐶𝐶𝐶𝐶 𝐶𝐶𝐶𝐶𝐶𝐶𝐶𝐶𝐶𝐶𝐶𝐶,𝑟𝑟𝑟𝑟 𝑡𝑡𝑡𝑡𝐶𝐶𝐶𝐶𝐶𝐶𝐶𝐶𝐶𝐶𝐶𝐶,𝑟𝑟𝑟𝑟 ,
CFD model data for relative humidity and temperature; 𝑅𝑅𝑅𝑅𝑅𝑅𝑅𝑅𝑚𝑚𝑚𝑚𝑚𝑚𝑚𝑚𝑚𝑚𝑚𝑚𝑠𝑠𝑠𝑠𝑚𝑚𝑚𝑚𝑟𝑟𝑟𝑟𝑚𝑚𝑚𝑚𝑚𝑚𝑚𝑚𝑚𝑚𝑚𝑚𝑚𝑚𝑚𝑚𝑡𝑡𝑡𝑡𝑠𝑠𝑠𝑠𝑟𝑟𝑟𝑟 , 𝑡𝑡𝑡𝑡𝑚𝑚𝑚𝑚𝑚𝑚𝑚𝑚𝑚𝑚𝑚𝑚𝑠𝑠𝑠𝑠𝑚𝑚𝑚𝑚𝑟𝑟𝑟𝑟𝑚𝑚𝑚𝑚𝑚𝑚𝑚𝑚𝑚𝑚𝑚𝑚𝑚𝑚𝑚𝑚𝑡𝑡𝑡𝑡𝑠𝑠𝑠𝑠𝑟𝑟𝑟𝑟 , Measured data for
relative humidity and temperature.
Mean values of ambient factors do not give a correct idea for the evaluation of the spatial distribution of relative humidity and temperature in a cold store. The variation should be evaluated level by level using CFD models and spatial distribution graphics of ambient factors. In addition, variance analysis also gives an idea about the comparison of the CFD model with data logger measurements. In this sense; differences between model and measurements were calculated and evaluated via variance analysis for statistical evaluation. Significant sources such as CFD/Measurements, Y axis, levels or interactions between these factors were grouped by Duncan test. Logarithmic transformation was applied to relative humidity for variance analysis (Soysal 2007). SPSS and MSTAT statistical software were used to make variance analysis and Duncan grouping tests.
3. Results and Discussion
3.1. CFD model results 3.1.1. TemperatureAir temperature distribution in the Y-Z planes has been given in Figure 6. Air temperature strongly decreased in this specific area due the strong air steam from inlet, increasing in the rest volume of the cold
Door Ventilation inlets Aspiration outlets Datalogger Measurement points Medium level Top level Base level 105 90 60
, CFD model data for relative humidity and temperature;
7
Air temperature and relative humidity were measured at a total of 36 different points inside the cold store for 3 different levels (12 points for each level). Measurement points (as star), axis and layout of the data loggers can be seen in Figure 5.
Figure 5- Measurements points, axis and layout of the data loggers in the cold store
Şekil 5- Soğuk odada ölçme noktaları, eksenler ve data loggerların yerleşimi
Temperature and relative humidity data loggers were located at measurement points. Model data were determined from CFD models by using Ansys Fluent Software.
CFD Model validated with measurements by using equation given below (Hoang et al 2000; Nahor et al 2005; Chourasia & Gosvami 2007a).
𝐸𝐸𝐸𝐸𝐶𝐶𝐶𝐶𝐶𝐶𝐶𝐶𝐶𝐶𝐶𝐶 ������ =1 𝑆𝑆𝑆𝑆∑ �𝑅𝑅𝑅𝑅𝑅𝑅𝑅𝑅𝐶𝐶𝐶𝐶𝐶𝐶𝐶𝐶𝐶𝐶𝐶𝐶 𝑟𝑟𝑟𝑟 , 𝑡𝑡𝑡𝑡𝐶𝐶𝐶𝐶𝐶𝐶𝐶𝐶𝐶𝐶𝐶𝐶,𝑟𝑟𝑟𝑟 −𝑅𝑅𝑅𝑅𝑅𝑅𝑅𝑅𝑚𝑚𝑚𝑚𝑚𝑚𝑚𝑚𝑚𝑚𝑚𝑚𝑚𝑚𝑚𝑚𝑚𝑚𝑚𝑚𝑟𝑟𝑟𝑟𝑚𝑚𝑚𝑚𝑚𝑚𝑚𝑚𝑚𝑚𝑚𝑚𝑚𝑚𝑚𝑚𝑚𝑚𝑚𝑚𝑚𝑚𝑚𝑚𝑟𝑟𝑟𝑟 , 𝑡𝑡𝑡𝑡𝑚𝑚𝑚𝑚𝑚𝑚𝑚𝑚𝑚𝑚𝑚𝑚𝑚𝑚𝑚𝑚𝑚𝑚𝑚𝑚𝑟𝑟𝑟𝑟𝑚𝑚𝑚𝑚𝑚𝑚𝑚𝑚𝑚𝑚𝑚𝑚𝑚𝑚𝑚𝑚𝑚𝑚𝑚𝑚𝑚𝑚𝑚𝑚𝑟𝑟𝑟𝑟 � 𝑅𝑅𝑅𝑅𝑅𝑅𝑅𝑅𝑚𝑚𝑚𝑚𝑚𝑚𝑚𝑚𝑚𝑚𝑚𝑚𝑚𝑚𝑚𝑚𝑚𝑚𝑚𝑚𝑟𝑟𝑟𝑟𝑚𝑚𝑚𝑚𝑚𝑚𝑚𝑚𝑚𝑚𝑚𝑚𝑚𝑚𝑚𝑚𝑚𝑚𝑚𝑚𝑚𝑚𝑚𝑚𝑟𝑟𝑟𝑟 , 𝑡𝑡𝑡𝑡 𝑚𝑚𝑚𝑚𝑚𝑚𝑚𝑚𝑚𝑚𝑚𝑚𝑚𝑚𝑚𝑚𝑚𝑚𝑚𝑚𝑟𝑟𝑟𝑟𝑚𝑚𝑚𝑚𝑚𝑚𝑚𝑚𝑚𝑚𝑚𝑚𝑚𝑚𝑚𝑚𝑚𝑚𝑚𝑚𝑚𝑚𝑚𝑚𝑟𝑟𝑟𝑟 𝑠𝑠𝑠𝑠 𝑟𝑟𝑟𝑟=1 . 100……….. (8)
Where; 𝐸𝐸𝐸𝐸������, relative error (%); s, Total number of the measurements; r, Indices 0, 1, 2,….s; 𝑅𝑅𝑅𝑅𝑅𝑅𝑅𝑅𝐶𝐶𝐶𝐶𝐶𝐶𝐶𝐶𝐶𝐶𝐶𝐶 𝐶𝐶𝐶𝐶𝐶𝐶𝐶𝐶𝐶𝐶𝐶𝐶,𝑟𝑟𝑟𝑟 𝑡𝑡𝑡𝑡𝐶𝐶𝐶𝐶𝐶𝐶𝐶𝐶𝐶𝐶𝐶𝐶,𝑟𝑟𝑟𝑟 ,
CFD model data for relative humidity and temperature; 𝑅𝑅𝑅𝑅𝑅𝑅𝑅𝑅𝑚𝑚𝑚𝑚𝑚𝑚𝑚𝑚𝑚𝑚𝑚𝑚𝑠𝑠𝑠𝑠𝑚𝑚𝑚𝑚𝑟𝑟𝑟𝑟𝑚𝑚𝑚𝑚𝑚𝑚𝑚𝑚𝑚𝑚𝑚𝑚𝑚𝑚𝑚𝑚𝑡𝑡𝑡𝑡𝑠𝑠𝑠𝑠𝑟𝑟𝑟𝑟 , 𝑡𝑡𝑡𝑡𝑚𝑚𝑚𝑚𝑚𝑚𝑚𝑚𝑚𝑚𝑚𝑚𝑠𝑠𝑠𝑠𝑚𝑚𝑚𝑚𝑟𝑟𝑟𝑟𝑚𝑚𝑚𝑚𝑚𝑚𝑚𝑚𝑚𝑚𝑚𝑚𝑚𝑚𝑚𝑚𝑡𝑡𝑡𝑡𝑠𝑠𝑠𝑠𝑟𝑟𝑟𝑟 , Measured data for
relative humidity and temperature.
Mean values of ambient factors do not give a correct idea for the evaluation of the spatial distribution of relative humidity and temperature in a cold store. The variation should be evaluated level by level using CFD models and spatial distribution graphics of ambient factors. In addition, variance analysis also gives an idea about the comparison of the CFD model with data logger measurements. In this sense; differences between model and measurements were calculated and evaluated via variance analysis for statistical evaluation. Significant sources such as CFD/Measurements, Y axis, levels or interactions between these factors were grouped by Duncan test. Logarithmic transformation was applied to relative humidity for variance analysis (Soysal 2007). SPSS and MSTAT statistical software were used to make variance analysis and Duncan grouping tests.
3. Results and Discussion
3.1. CFD model results 3.1.1. TemperatureAir temperature distribution in the Y-Z planes has been given in Figure 6. Air temperature strongly decreased in this specific area due the strong air steam from inlet, increasing in the rest volume of the cold
Door Ventilation inlets Aspiration outlets Datalogger Measurement points Medium level Top level Base level 105 90 60 , measured data for relative humidity and temperature.
Mean values of ambient factors do not give a correct idea for the evaluation of the spatial distribution of relative humidity and temperature in a cold store. The variation should be evaluated level by level using CFD models and spatial distribution graphics of ambient factors. In addition, variance analysis also gives an idea about the comparison of the CFD model with data logger measurements. In this sense; differences between model and measurements were calculated and evaluated via variance analysis for statistical evaluation. Significant sources such as CFD/Measurements, Y axis, levels or interactions between these factors were grouped by Duncan test. Logarithmic transformation was applied to relative humidity for variance analysis (Soysal 2007). SPSS
and MSTAT statistical software were used to make variance analysis and Duncan grouping tests.
3. Results and Discussion
3.1. CFD model results 3.1.1. TemperatureAir temperature distribution in the Y-Z planes has been given in Figure 6. Air temperature strongly decreased in this specific area due the strong air steam from inlet, increasing in the rest volume of the cold store according to the distribution of airflow. The air temperature varies from 2.40 °C to 2.7 °C near the roof of the cold store and this value was further decreased to the range of 2.10-2.40 °C near the middle height of the cold store.
Air temperature distribution in X-Z planes has been given in Figure 7. The temperature distribution
(a) right/sağ (b) middle/orta (c) left/sol
Figure 6- Temperature distributions in Y-Z plane of the cold store
Şekil 6- Soğuk oda Y-Z düzlemlerinde sıcaklık dağılımı
(a) front/ön (b) middle/orta (c) back/arka
Figure 7- Air temperature distribution in X-Z planes of the cold store
Bir Soğuk Hava Deposunda Ortam Koşullarının Sayısal Modellenmesi ve Deneysel Geçerliliğinin Belirlenmesi, Akdemir & Bartzanas
was more homogeneous along the length of the cold store. The cold store air temperature varied from 1.50 °C to 1.80 °C near the walls and the ground (Figure 7). Air temperature increased and its value ranged from 2.40 °C to 2.70 °C near the roof of cold store due to reduced air velocities.
Temperature distribution in X-Y planes along the length of the cold store has been given in Figure 8. Air temperature distribution along the cold store height varies from 1.5 °C (a few centimetres above cold store ground and close to the airflow outlets) to 3.0 °C at regions on the ground of the cold store and in the corners usually at regions unaffected from air velocities (Figure 8).
3.1.2. Relative humidity
Relative humidity distribution in the Y-Z planes has been given in Figure 9. It can be seen from Figure 9 that the ventilated cold air entering the cold store from the inlet was directly guided to the ground
after which it was distributed into the rest of the cold store volume following the cold store walls. While inlet relative humidity was approximately 88%, outlet relative humidity was decreased to 85%. Relative humidity was changed between 84% and 87%in the middle areas of the cold store.
Relative humidity distribution in X-Z planes along the length of the cold store has been given in Figure 10. This area has no direct contact with inlet and outlet. So the values of relative humidity were further decreased in middle and top areas of the cold store. Relative humidity varied from 82% to 87%. Relative humidity at base level of this plane was 87%.
Relative humidity distribution in X-Y planes has been given in Figure 11. The relative humidity was changed from 88% to 85% in this plane. Even there wasn’t big variability for relative humidity in X-Y plane, amount of the relative humidity was decreased from bottom to top.
(a) base/taban (b) middle/orta (c) top/üst Figure 8- Air temperature distribution in X-Y planes of the cold store
Şekil 8- Soğuk oda X-Y düzlemlerinde sıcaklık dağılımı
(a) right/sağ (b) middle/orta (c) left/sol
Figure 9- Relative humidity distribution in Y-Z plane of the cold store
Numerical Modelling and Experimental Validation of a Cold Store Ambient Factors, Akdemir & Bartzanas
3.2. Numerical model validation 3.2.1. Air temperature
CFD model (t_CFD) and data logger measurements (t_measurements) and differences between model and measurements (Dt) of temperature in the cold storage during full loaded apple storage have been given in Table 3.
The difference between CFD model and data logger measurement was 0.33 oC. CFD model estimations were generally lower than data logger measurements. Standard deviation was calculated as 0.02 oC for measurement and 0.04 oC for CFD Model. Relative error of CFD model was calculated as 13.01%. This value was higher than that mean average absolute deviation of temperature value of 4.42% (Gilani et al 2013). Even differences between CFD model data and data logger measurements for temperature was small, uneven distribution of the temperature was a good agreement with results of Moureh & Flick (2004). The uneven distributions of
(a) front/ön (b) middle/orta (c) back/arka
Figure 10- Relative humidity distribution in X-Z planes of the cold store
Şekil 10- Soğuk oda X-Z düzlemlerinde bağıl nem dağılımı
(a) base/taban (b) middle/orta (c) top/üst
Figure 11- Relative humidity distribution in X-Y planes of the cold store
Şekil 11- Soğuk oda X-Y düzlemlerinde bağıl nem dağılımı
Table 3. CFD model (t_CFD) and measurements
(t_m) and differences (Dt)
Çizelge 3- CFD model (t_CFD) ve data logger ölçümleri (t_m) ve farklar (Dt) X-Z Planes Level t_CFD (oC) t_m(oC) Dt (oC) ECFD 1 1 2.14 2.53 0.39 15.42 1 2 2.14 2.54 0.40 15.75 1 3 2.09 2.50 0.41 16.40 2 1 2.22 2.53 0.31 12.25 2 2 2.20 2.50 0.30 12.00 2 3 2.15 2.48 0.33 13.31 3 1 2.20 2.53 0.33 13.04 3 2 2.18 2.50 0.33 12.80 3 3 2.18 2.51 0.32 13.15 4 1 2.25 2.53 0.28 11.07 4 2 2.24 2.48 0.24 9.68 4 3 2.21 2.49 0.33 11.24 Mean 2.18 2.51 0.33 13.01 Minimum 2.09 2.48 0.24 Maximum 2.25 2.54 0.41 Standard deviation 0.04 0.02 0.05 t_m, t_measurements
Bir Soğuk Hava Deposunda Ortam Koşullarının Sayısal Modellenmesi ve Deneysel Geçerliliğinin Belirlenmesi, Akdemir & Bartzanas
temperature were also compatible with the results of Akdemir & Tagarakis (2014) who determined 4 management zones for this cold store. The developed CFD model can be used to estimate temperature distribution in this kind of cold store.
Differences between CFD model and data logger measurement (F= 1622.25, α= 0.001), X-Z Planes (F= 7.244, α= 0.002), Levels (F= 4.866, α= 0.005), CFD/ Measurements x Levels interactions (F= 11.482, α= 0.001) were found to be statistically significant according to the variance analysis of the air temperature in the cold store. Means of main factors and interaction effects statistically found to be significant were grouped via Duncan tests and the results have been given in Table 4.
It can be seen from Table 4 that the temperature values (mean 2.124 oC) was lower in the first X-Z plane which was close to the cold air input (ventilation) channels in comparison with the other X-Z planes. There were no statistically significant differences between X-Z planes. Model estimation was good for temperature.
There were also spatial variations for temperature of different measurement planes in the experimental cold store. The spatial variations of temperature were also determined by Tassou & Xiang (1998)
for wet air-cooled store after 5, 10 and 15 hours, Akdemir & Arin (2006) for evaporative cold store by using a mapping software with measured data, storage temperature varied between 0-5 oC for Tassou & Xiang (1998), 2.7-5.3 oC for Akdemir & Arin (2006). Average temperature differences during cooling period was found as 1.2 oC by Chourasia & Goswami (2007b) used CFD in their research. 3.2.2. Relative humidity
CFD model (RH_CFD) and data logger measurements (RH_measurmeents) and differences between model and measurements (DRH) of relative humidity in the cold storage during fully loaded apple have been given in Table 5.
The difference between CFD model and data logger measurement was 1.20%. It was very good for the model estimation. Standard deviation was calculated as 0.38% for measurement and 0.78% for CFD Model. Relative error of CFD model was calculated as 1.43%. The CFD model can be used to estimate relative humidity distribution. There was a good agreement between CFD model estimations and data logger measurements for distribution of relative humidity (%) in the cold store (Chourasia & Goswami 2007a). The relative error (ECFD) of relative humidity was better than 15.9% as overall Table 4- Means and Duncan test group code of main factors and interaction effects on temperature at different X-Z Planes and Levels
Çizelge 4- Farklı X-Z düzlemlerinde ve seviyelerde ana faktör ve interaksiyon etkilerinin sıcaklık ortalamaları ve Duncan test grupları
X-Z planes
CFD
Levels 1 2 3 4 Mean Mean
Top (1) 2.141 2.221 2.199 2.248 2.202 C Middle (2) 2.140 2.202 2.175 2.239 2.189 CD 2.18 A Base (3) 2.092 2.154 2.183 2.214 2.161 D Mean 2.124 2.192 2.186 2.234 Measurements Top (1) 2.530 2.530 2.530 2.530 2.530 A Middle (2) 2.537 2.497 2.500 2.480 2.503 B 2.51 B Base (3) 2.503 2.480 2.507 2.493 2.496 B Mean 2.523 2.502 2.512 2.501 Sx(CFD/measurements) x Levels: 0.0091, α=0.05
Numerical Modelling and Experimental Validation of a Cold Store Ambient Factors, Akdemir & Bartzanas
average relative error of the previously reported CFD models of Delele et al (2009) and 11.5% of Chourasia & Goswami (2007b).
Differences between CFD model and data logger measurement (F= 13.193, α= 0.001) was found to be statistically significant according to the variance analysis of the relative humidity in the cold store. Means of main factors and interaction effects
statistically did not found to be significant were in Table 6.
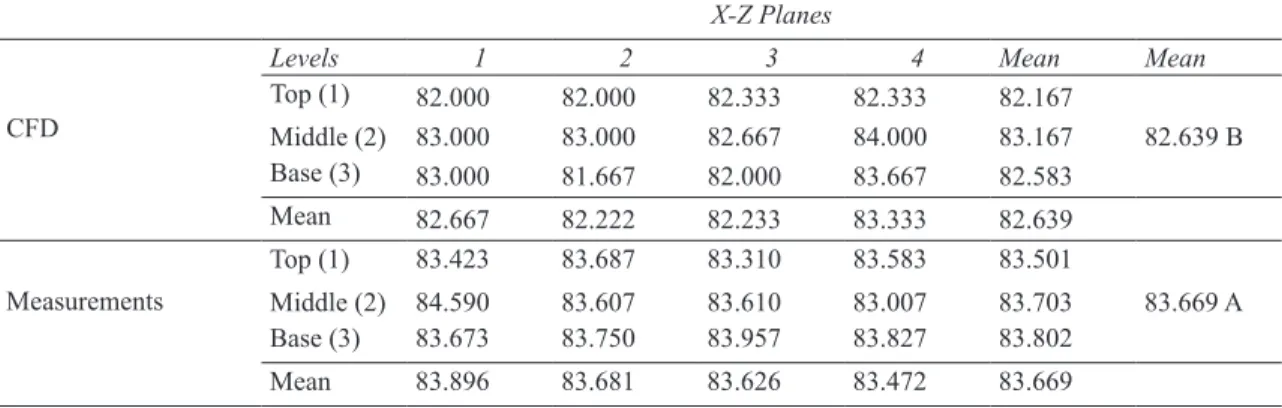
It can be seen from Table 6 that there was only small differences between CFD model estimation (mean 82.639%) and data logger measurements (mean 83.669%) as 1.03%. Relative humidity of the base level a little beat higher than other levels for model and measurements.
Table 5- CFD model (RH_CFD) and data logger measurements (RH_measurements) and differences (DRH)
Çizelge 5- CFD model (RH_CFD) ve datalogger ölçümleri (RH_measurements) ve farklar (DRH)
X-Z Planes Level RH_CFD(%) RHmeasurements(%) DRH (%) ECFD
1 1 82.00 83.42 1.42 1.71 1 2 83.00 84.59 1.59 1.88 1 3 83.00 83.67 0.67 0.80 2 1 82.00 83.69 1.69 2.02 2 2 83.00 83.61 0.61 0.73 2 3 82.00 83.75 1.75 2.09 3 1 82.00 83.31 1.31 1.57 3 2 83.00 83.61 0.61 0.73 3 3 82.00 83.96 1.96 2.33 4 1 82.00 83.58 1.58 1.89 4 2 84.00 83.01 0.99 1.20 4 3 84.00 83.83 0.17 0.21 Mean 82.67 83.67 1.20 1.43 Minimum 82.00 83.01 Maximum 84.00 84.59 Standard deviation 0.78 0.38
Table 6. Means and Duncan test group code of main factors and interaction effects on Relative Humidity at different X-Z Planes and Levels
Çizelge 6- Farklı X-Z düzlemlerinde ve seviyelerde ana faktör ve interaksiyon etkilerinin bağıl nem ortalamaları
X-Z Planes
CFD
Levels 1 2 3 4 Mean Mean
Top (1) 82.000 82.000 82.333 82.333 82.167 Middle (2) 83.000 83.000 82.667 84.000 83.167 82.639 B Base (3) 83.000 81.667 82.000 83.667 82.583 Mean 82.667 82.222 82.233 83.333 82.639 Measurements Top (1) 83.423 83.687 83.310 83.583 83.501 Middle (2) 84.590 83.607 83.610 83.007 83.703 83.669 A Base (3) 83.673 83.750 83.957 83.827 83.802 Mean 83.896 83.681 83.626 83.472 83.669
Bir Soğuk Hava Deposunda Ortam Koşullarının Sayısal Modellenmesi ve Deneysel Geçerliliğinin Belirlenmesi, Akdemir & Bartzanas
There is always variation for temperature and relative humidity in cold stores. There is not any cooling system to establish completely homogeny distribution inside the cold stores. This variation also can be affected by replacement of storage boxes. It is important that manage of the spatial variation of ambient factors to decrease effect on quality of stored products.
4. Conclusions
The objective was to develop a CFD model to estimate temperature and relative humidity in a cold store which includes a chiller cooling system. A numerical model was used to access air temperature and relative humidity distribution inside a cold store filled with boxes of apples. Ansys Fluent software was used to develop the model. Before its use the numerical model was validated against experimental data.
Analysis of the simulation with the CFD and experimental data reveals a maximum difference indicating a good agreement between measurements and simulations for temperature and relative humidity. Relative error of CFD model was 13% for temperature and 1.43% for relative humidity. The image as seen in the distribution of temperature inside the cold store was not exactly a homogeneous distribution. Heterogeneity was due to the design of the cold storage system and the arrangements of apple boxes. Ambient temperature was generally increased from bottom to top contrary relative humidity decreased from bottom to top. There is a good agreement results of distribution of relative humidity and temperature in the cold store with Chourasia & Goswami (2007a). Blown air was distributed directly by cold air inlet channels into the room, slamming the air into the ground. Part of the air hitting the ground while flowing parallel to the ground portion enters the circulation in the room. According to research results; ambient temperature and relative humidity in the cold store with chiller unit can be predicted effectively by CFD model.
Acknowledgements
Authors would like to thank to TUBITAK for their support to “TUBITAK Project No: 110 O 147 - Investigation of Spatial variability effect of ambient conditions on storage losses”, Report No: 4 and 5.
References
Akdemir S & Arın S (2006). Spatial variability of ambient temperature, relative humidity and air velocity in a cold store. Journal of Central European 7(1): 101-110 Akdemir S & Tagarakis A (2014). Investigation of spatial
variability of air temperature, humidity and velocity in cold stores by using management zone analysis.
Tarım Bilimleri Dergisi - Journal of Agricultural Sciences 20: 175-186
Ambaw A, Delele M A, Defraeye T, Ho Q T, Opara L U, Nicolai B M & Verboven P (2013). The use of CFD to characterize and design post-harvest storage facilities: Past, present and future. Computers and Electronics
in Agriculture 98: 184-194
Ansys (2014). Ansys Fluent. http://www.ansys.com/ Products/Simulation+Technology /Fluid+Dynamics/ Fluid+Dynamics+Products/ANSYS+Fluent (Access Date: 07.12.2014)
Bartzanas T, Kacira M, Zhu H, Karmakar S, Tamimi E, Katsoulas N, Lee I B & Kittas C (2013). Computational fluid dynamics applications to improve crop production systems. Computers and Electronics
in Agriculture 98: 151-167
Bjerg B, Gascone G, Lee I B, Bartzanas T, Norton T, Hong S W, Seo I H, Banhazi T, Liberati P, Marucci A & Zhang G (2013). Modelling of ammonia emissions from naturally ventilated livestock buildings-Part three: CFD modelling. Biosystems Engineering
116(3): 259-27
Chourasia M K & Goswami T K (2007a). Steady state CFD modelling of airflow, heat transfer and moisture loss in a commercial potato cold store. International
Journal of Refrigeration 30(4): 672-689
Chourasia M K & Goswami T K (2007b). CFD simulation of effects of operating parameters and product on heat transfer and moisture loss in the stack of bagged potatoes. Journal of Food Engineering 80: 947-960 Delele M A, Schenk A, Tijskens E, Ramon H, Nicolaο
B M & Verboven P (2009). Optimization of the humidification of cold stores by pressurized water atomizers based on a multiscale CFD model. Journal
Numerical Modelling and Experimental Validation of a Cold Store Ambient Factors, Akdemir & Bartzanas
Delele M A, Vorstermans B, Creemers P, Tsige A A, Tijskens E, Schenk A, Opara U L, Nicolaï B M, Verboven P (2012). CFD model development and validation of a thermonebulisation fungicide fogging system for postharvest storage of fruit. Journal of
Food Engineering 108: 59-68
Testo (2015). Testo 177H1 Technical Data sheet Retrieved in April, 1, 2015 from http://www.farnell.com/ datasheets/ 62058.pdf
Foster A M, Swain M J, Barrett R, D’Agaro P & James S J (2006). Effectiveness and optimum jet velocity for a plane jet air curtain used to restrict cold room infiltration. International Journal of Refrigeration
29(5): 692-699
Foster A M, Swain M J, Barrett R & James S J (2003). Experimental verification of analytical and CFD predictions. International Journal of Refrigeration
26: 918-925
Gilani S, Montazeri H, Blocken B (2013). CFD Simulation of Temperature Stratification For a Building Space: Validation and Sensitivity Analysis.In: Proceedings
Book of 13th Conference of International Building Performance, August 26-28, Chambéry, France, pp.
504-511
Hoang M L, Verboven P, De Baerdemaeker J & Nicolai B M (2000). Analysis of the air flow in a cold store by means of computational fluid dynamics. International
Journal of Refrigeration 23: 127-140
Launder B E & Spalding D B (1974). Numerical computational methods for turbulent flows. Computer
Methods in Applied Mechanics and Engineering 3(2):
269-289
Le Page J F, Chevarin C, Kondjoyan A, Daudin J D & Mirade P S (2009). Development of an approximate empirical-CFD model estimating coupled heat and water transfers of stacked food products placed in airflow. Journal of Food Engineering 92(2): 208-216 Marcilla A, Zarzo M & Delrio M A (2006). Effect of
storage temperature on the flavour of citrus fruit.
Spanish Journal of Agricultural Research 4(4):
336-344
Martins M A, Oliveira L S & Saraz J A (2011). Numerical study of apple cooling in tandem arrangement. Dyna
78(166): 158-165
Mirade P S & Picgirard L (2006). Improvement of ventilation homogeneity in an industrial batch-type carcass chiller by CFD investigation. Food Research
International 39(8): 871-881
Mohammadi B & Pironneau O (1994). Analysis of the K-Epsilon Turbulence Model. Wiley-Masson Series Research in Applied Mathematics Book 2, pp. 212 Monteith J L & Unsworth M H (1990). Principles of
Environmental Physics. Edward Arnold New York 2nd Ed, pp. 422
Moureh J & Flick D (2004). Airflow pattern and temperature distribution in a typical refrigerated truck configuration loaded with pallets. International
Journal of Refrigeration 27: 464-474
Moureh J, Letang G, Palvadeau B & Boisson H (2009). Numerical and experimental investigations on the use of mist flow process in refrigerated display cabinets.
International Journal of Refrigeration 32: 203-219
Nahor H B, Hoang, M L, Verboven P, Baelmans M & Nicolai B M (2005). CFD model of the airflow, heat and mass transfer in cool stores. International Journal
of Refrigeration 28(3): 368-380
Nuyttens D, De Schampheleire M, Verboven P & Sonck B (2009). Comparison between indirect and direct spray drift assessment methods. Biosystems Engineering
105(1): 1-12
Schaldach G, Berger L, Razilov I & Berndt H (2000). Computer simulation for fundamental studies and optimisation of ICP spray chambers. ISAS (Institute of Spectrochemistry and Applied Spectroscopy) Current Research Reports, Berlin, Germany
Soysal M I (2007). Principles of Biometry (in Turkish). Trakya University, Tekirdag Faculty of Agriculture Publication no:95, Lecture notes: 64, Tekirdag Stamou A & Katsiris I (2006). Verification of a CFD
model for indoor airflow and heat transfer. Building
and Environment 41: 1171-1181
Tanaka F, Konishi Y, Kuroki Y, Hamanaka D & Uchino T (2012). The use of CFD to improve the performance of a partially loaded cold store. Journal of Food
Process Engineering 35(6): 874-880
Tassou S A & Xiang W (1998). Modelling the environment within a wet air-cooled vegetable store. Journal of
Food Engineering 38(2): 169-187
Xia B & Sun D W (2002). Applications of computational fluid dynamics (CFD) in the food industry: A review.
Computers and Electronics in Agriculture 34: 5-24
Xie J, Qu X H, Shi J Y & Sun D W (2006). Effects of design parameters on flow and temperature fields of a cold store by CFD simulation. Journal of Food
Engineering 77(2): 355-363
Xu Y & Burfoot D (1999). Simulating the bulk storage of food stuffs. Journal of Food Engineering 39(1): 23-29